
Chapter 16 – Operational Performance Measurement: Further Analysis of Productivity and Sales
3. Obtain Information and Conduct Analyses of the Alternatives
Schmidt calculates the sales quantity, market share and market size variances. Schmidt also
conducts further economic analysis which shows that, in the coming years, the dollar will likely fall
against other currencies and that the worldwide recession will continue to show lower and lower levels of
consumer spending.
4. Based on Strategy and Analysis, Choose and Implement the Desired Alternative
Based on an analysis of the quantity, market share and market size variances for both products, which
show an unfavorable market size variance, but a favorable market share variance and a favorable quantity
variance, and with the negative news about the dollar and the global recession, Schmidt decides to make
contingency plans for the possible reduction in the production and sales of the FB-33 product. One
reason is the lower unit contribution of the FB-33 product. The second reason is that while the global
recession will affect sales worldwide, and XV-1 has a greater share of worldwide sales, Schmidt expects
that the recession will have the greatest negative impact on sales in the U.S and thus a relatively greater
impact on FB-33.
5. Provide an On-going Evaluation of the Effectiveness of implementation in Step 4.
As the global economic environment becomes more certain, including potential changes in the value
of the dollar, management should continue to review its planning for the two products. Also,
management should consider obtaining additional information about the market size for each product, so
that the company can further partition the market share and market size variances for each product.
Supplemental Discussion – Strategic Proitability Analysis
The variances discussed in chapters 14 and 16 can be used to managers to help improve their
understanding of the impact of various factors on the operating results of their organization. These
variances can be grouped a bit differently to support strategic profitability analysis. The purpose of
strategic profitability analysis is to analyze the difference in operating income between two periods to
assess successful implementation of the firm’s strategy. To facilitate the analysis, changes in operating
income are separated into effects of changes in sales volume (growth), selling price and cost of input
resources (price-recovery), and productivity.
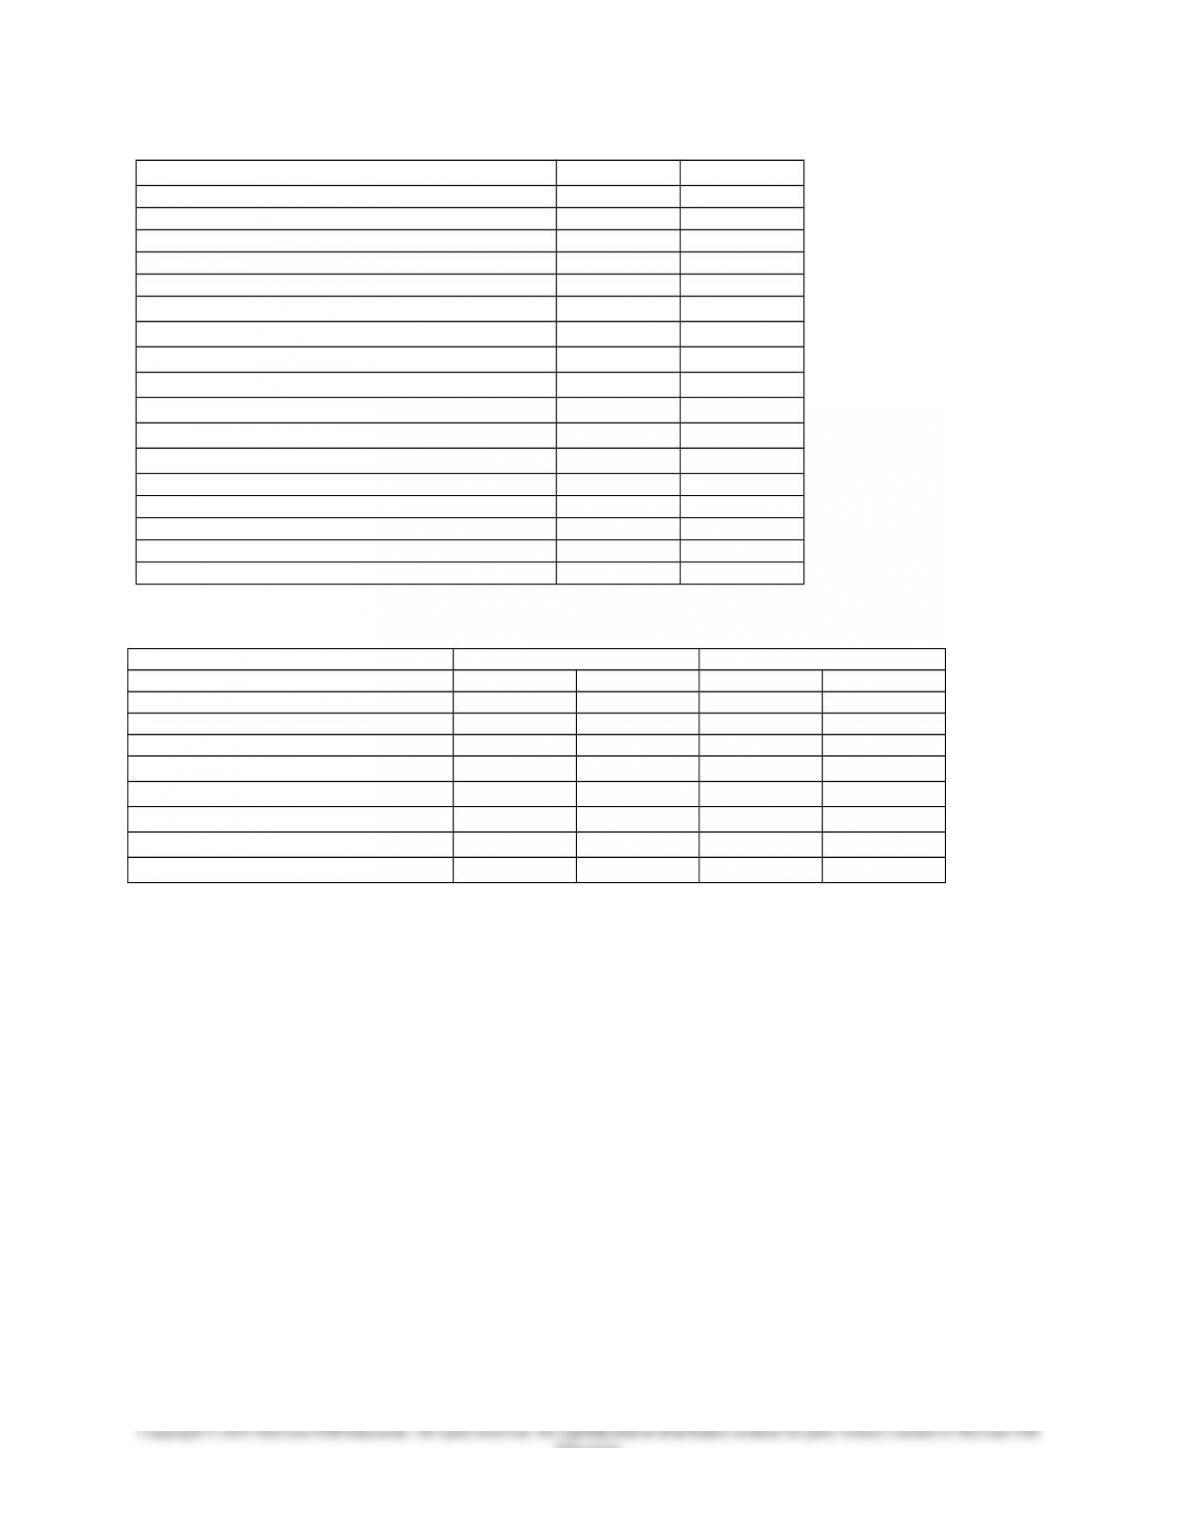
The following tables presents the operating data and operating results pertaining to 2015 and 2016 of the
Circuit-Switching Division (CSD) of the Schmidt Machinery Company. CSD manufactures an error-free
circuit switch, EF10.
Compared to the operating results in 2015 the division sold 240 units more in 2016, or 2.56 percent, and
earned $290,400 more in operating income, or 13.46 percent. It appears that the division did a good job in
2016. Did the division move along the strategic direction set for the division? To find an answer to this
question, we need to know factors contributing to the improved operating results. Changes in operating
results can arise from changes in units sold (growth), selling price and cost of production factors (price
recovery), and productivity in using production factors.
16-8
Chapter 16 – Operational Performance Measurement: Further Analysis of Productivity and Sales
Operating Data—CSD Division
2015 2016
Units produced and sold 9,360 9,600
Total market (units) 234,000 257,400
Selling price per unit $ 900 $ 920
Total sales $8,424,000 $8,832,000
Direct materials
Cost per pound $ 45 $ 48
Total direct materials used (pounds) 51,480 58,560
Total direct materials cost $2,316,600 $2,810,880
Other variable costs
Cost per hour $ 60 $ 56
Total hours 33,696 36,480
Total other variable costs $2,021,760 $2,042,880
Total variable operating cost $4,338,360 $4,853,760
Manufacturing capacity (in units) 15,000 10,000
Fixed costs (excluding R&D) $1,200,000 $ 960,000
R&D $ 727,800 $ 570,000
R&D employees 12 10
Income Statement—CSD Division for 2015 and 2016
2015 2016
Sales $8,424,000 100.00% $8,832,000 100.00%
Total variable costs 4,338,360 51.50% 4,853,760 54.96%
Contribution margin $4,085,640 48.50% $3,978,240 45.04%
Fixed costs
Manufacturing and operating 1,200,000 14.25% 960,000 10.87%
R&D 727,800 8.64% 570,000 6.45%
Operating income $2,157,840 25.62% $2,448,240 27.72%
Increase in operating income $290,400
Growth Factor
The growth factor measures the change in operating income attributable to change in sales quantity. The
analysis is similar to the analysis of quantity (efficiency) variance for a direct material or direct labor
variance. As sales quantities change, both sales revenues and operating costs change and the change in
operating income is a result of the changes in the sales revenue and operating costs. The net effect of
growth on the operating income is the combined growth effects of sales revenue and operating costs.
Revenue Effect of Growth
Total sales revenues change as the units of sales fluctuate. To determine the effect of changes in sales
units on total sales revenue we assume that the selling price per unit remains unchanged in the following
formula:
(Units sold in 2016 – Units sold in 2015) × 2015 selling price per unit
(9,600 – 9,360) × $900 = $216,000 F
The analysis above uses 2015 operating data as the benchmark and calculates the change in total revenue
when the unit of sales increased from 9,360 in 2015 to 9,600 in 2016 using the 2015 selling price per unit.
Since the unit selling price remains unchanged, the result, $216,000 favorable, is attributable solely to the
increase in units sold.
Cost Effect of Growth
16-9
Education.

Chapter 16 – Operational Performance Measurement: Further Analysis of Productivity and Sales
Fluctuations in units of sale also affect operating costs of the firm. The cost effect of growth measures the
change in operating costs because of the change in units of sales, assuming no changes in both the cost
per unit of input resources and the productivity of these input resources, we end up with the following
formula:
(Actual units of input resources used in 2015 – Units of input resources that would have been used to
produce 2016 output at 2015 productivity) × 2015 cost per unit of input resources
The calculation assumes no change in either productivity or cost of input resources. The second term in
the parentheses estimates the total units of input resources that the firm would have used to manufacture
the 2016 unit of output if the firm maintains its 2015 productivity in using the input resources. The
amount calculated in the parentheses, therefore, is the change in input resources needed to meet the
changed output level if the input-output relationship (productivity) remains unchanged at the 2015 level.
The effect in dollars is determined using the 2015 unit cost of input resource for the change in the
required input resources for the output. A positive amount denotes favorable variance. The variables costs
are now analyzed.
Direct Materials CSD used 51,480 pounds of direct materials to produce 9,360 units of the product, or
5.5 pounds (51,480 pounds ÷ 9,360 = 5.5 pounds) per unit in 2015. To produce the 9,600 units in 2016 at
the 2015 productivity, CSD would require 52,800 pounds (9,600 × 5.5) of direct materials, or 1,320
pounds of additional direct materials for the additional 240 units. At the 2015 cost of $45 per pound, the
cost of direct materials would have increased by $59,400. The actual formula and computations appear
below.
Actual units of direct materials used in 2015 – Units of direct materials that would have been used to
produce 2016 output at 2015 productivity x 2015 cost of direct materials
(51,480 pounds – 52,800 pounds) × $45 = $59,400 U Cost of direct materials per pound in 2015
Other Variable Costs CSD spent 33,696 hours on other variable cost to manufacture 9,360 units in 2015,
an average of 3.6 hour (33,696 ÷ 9,600 = 3.6) per unit. If CSD maintains the same productivity in 2016 as
in 2015, the manufacturing of 9,600 would require 34,560 hours, or 864 additional hours. At the same
hourly rate of $60, the additional hours would have increased the other variable costs by $51,840.
Other variable cost effect of growth = (33,696 – 34,560) × $60 = $51,840 U
Note that the cost effect of growth applies only to variable input resources. A fixed operating cost will
have cost effect of growth only if the changed output quantity required the firm to operate at a different
level such as the addition of a factory.
Fixed Costs and R&D Both fixed and R&D costs would remain unchanged to manufacture the slightly
higher units of output in 2016. Therefore, there is no cost effect of growth attributable to fixed and R&D
costs.
In summary, the net effect in operating income resulting from the increase in units of sales (growth) is
Revenue effect of the growth $216,000 F
Cost effect of the growth
Direct materials $59,400 U
Other variable costs 51,840 U
Fixed costs and R&D costs 0
111,240 U
Increase in operating income attributable to growth $104,760 F
16-10
Education.

Chapter 16 – Operational Performance Measurement: Further Analysis of Productivity and Sales
Further Analysis of Growth Effect
Variations in units sold can be a result of changes in either the total market size for the product, the firm’s
share of the market, or both. The total market for CSD’s products increased 10 percent (257,400 234,000
110%) in 2016. CSD would have increased its total sales units by 10 percent, 936 units, if it maintained
the same market share as in 2015.
9,360 units in 2015 × 10% = 936 units
The contribution margin per unit is $436.50 in 2015:
$900 – ($45 × 5.5 pounds) – ($60 × 3.6 hours) = $436.50 per unit
The increase in operating income from selling 936 more in units, or the effect of the market size on
growth effect of operating income, is
Market size variance:
936 × $436.50 = $408,564 F
However, the firm’s market share decreased in 2016. In 2015, CSD had 4 percent of the total market
(9,360 234,000 4%). The firm managed to have only 3.73 percent of the total market in 2016 (9,600
257,400 3.7296%). The decrease in market share cost CSD a decrease of 696 units in units sold. 2016
market share
(2015 market share – 2016 market share) × 2016 market size
(4% – 3.7296%) × 257,400 units = 696 units, unfavorable
The effect of the market share on growth effect of operating income is
696 U × $436.50 = $303,804 U
In summary
Market size variance 936 × $436.50 = $408,564 F
Market share variance: (4% – 3.7296%) × 257,400 × $436.50 = 303,804 U
Total growth effect on operating income $104,760 F
Price-Recovery Factor
The price-recovery factor measures changes in operating income attributable to changes in the selling
prices of products and the costs of input resources. This factor reflects the extent to which a firm was able
to recover changes in the costs of input resources through changes in selling prices of the firm’s products.
Similar to the growth factor, the price-recovery factor is determined separately for revenues and costs.
The calculations of price-recovery effects are similar to the computation of price variance for direct
materials discussed in Chapter 14.
Revenue Effect of Price Recovery
CSD sold 9,600 units in 2016 at $920 per unit, which is $20 higher than the selling price in 2015. The
increase in selling price brings in an additional $192,000 for CSD.
Revenue effect of price recovery computations:
Output selling price per unit in 2016 – Output selling price per unit in 2015 × Units of output sold in 2016
($920 – $900) × 9,600 = $192,000 F
16-11
Education.

Chapter 16 – Operational Performance Measurement: Further Analysis of Productivity and Sales
Cost Effect of Price Recovery
The cost effect of price recovery calculation focuses on changes in the cost of input resources. It looks at
the units of input resources that would have been used to produce 2016 output at 2015 productivity.
Remember that the capacity level of fixed costs that would have been used to produce the 2016 output
quantity remains the same at the 2015 level.
The cost effect of price recovery formula is:
(Cost per unit of input resource in 2015 – Cost per unit of input resource in 2016) × Units of input
resources that would have been used to produce the 2016 output units at 2015 productivity
The last term in the equation above, units of input resources that would have been used to produce the
2016 output units at 2015 productivity, has been determined in the calculation for the cost effect of
growth, except for fixed costs. For fixed costs the capacity level is unchanged from the 2015 level.
The cost effect of price recovery is determined separately for each of the input resources or capacity.
Cost effect of price recovery
Direct materials costs ($45 – $48) × 52,800 pounds = $158,400 U
Other variable costs ($60 – $56) × 34,560 hours = 138,240 F
Fixed operating costs ($80 – $96) × 15,000 units = 240,000 U
R&D ($60,650 – $57,000) × 12 = 43,800 F
Total cost effect of price recovery on operating income $216,360 U
The cost of direct materials increased from $45 to $48 per pound. At the 2015 productivity (5.5 pounds of
direct materials per unit of the output), CSD needs 52,800 pounds to manufacture the 2016 output of
9,600 units (9,600 units × 5.5 pounds per unit). The higher direct materials price in 2016 decreased
operating income by $158,400. However, CSD reduced the hourly rate for other variable costs from $60
in 2015 to $56 in 2016. The saving of $4 per hour for the 34,560 total hours that CSD would need to
manufacture 9,600 units at the 2015 productivity for the other variable costs added $138,240 to 2016
operating income.
CSD paid $1,200,000 fixed costs for 15,000 units of manufacturing capacity and $727,800 for 12
employees in R&D in 2015, or average costs of $80 per unit of the manufacturing capacity and $60,650
per R&D employee. The average costs for 2016 are $96 and $57,000 for fixed manufacturing capacity
and R&D, respectively. Even though CSD lowered its manufacturing capacity in 2016 to save fixed costs,
the fixed cost per unit of manufacturing capacity in 2016 was higher than that of 2015. As a result, the
price-recovery effect of fixed manufacturing capacity costs is $240,000 unfavorable. However, the cost
per R&D employee decreased and the price-recovery effect of R&D cost is $43,800 favorable.
The net price-recovery effect is the sum of revenue and cost effects, $24,360 unfavorable:
Revenue effect of price recovery $192,000 F
Cost effect of price recovery 216,360 U
Price-recovery effect on operating income $ 24,360 U
The result suggests that the cost increases in the firm’s resource is higher than the increase in selling
prices of the firm’s products.
Productivity Factor effect
Productivity effects of manufacturing factors are determined similar to the productivity measures
discussed in the first section of this chapter. The productivity factor effect measures impacts of changes
16-12

Chapter 16 – Operational Performance Measurement: Further Analysis of Productivity and Sales
in the input-output relationship on the 2016 operating income based on the 2016 costs of input resources
capacity.
(Input units or capacity that would have been used to produce 2016 output at 2015 productivity –
Input units or capacity used in 2016) × Actual cost per unit in 2016
The input units or capacity that would have been used to manufacture the 2016 output units at the 2015
productivity have already been calculated in determining the cost effect of growth. For the CSD division,
the productivity effect is
Direct materials (9,600 × 5.5 pounds per unit – 58,560) × $48 = $276,480 U
Other variable costs (9,600 × 3.6 hours per unit – 36,480) × $56 = 107,520 U
Fixed operating costs (15,000 – 10,000) × $96 per hour = 480,000 F
R&D (12 10) × $57,000 per employee = 114,000 F
Total productivity effect on operating income $210,000 F
Notice that the calculation uses 2016 cost for the resources. At 2015 productivity, CSD should have used
52,800 pounds of direct materials to manufacture 9,600 units in 2016. Instead, CSD used 58,560 pounds,
an excess of 5,760 pounds. At $48 per pound that CSD paid for the direct materials in 2016, the excess
usage added $276,480 to the total cost. Similarly, CSD should have spent 34,560 hours on other variable
costs in 2016 to manufacture 9,600 units. It used 36,480 hours and, at $56 per hour in 2016, increased
costs by $107,520. However, CSD reduced its manufacturing capacity from 15,000 units in 2015 to
10,000 units in 2016. At $96 average cost per unit (2016 cost), the reduction saved CSD $480,000 in cost.
Similarly, the division saved $114,000 in R&D by reducing the number of employees from 12 to 10.
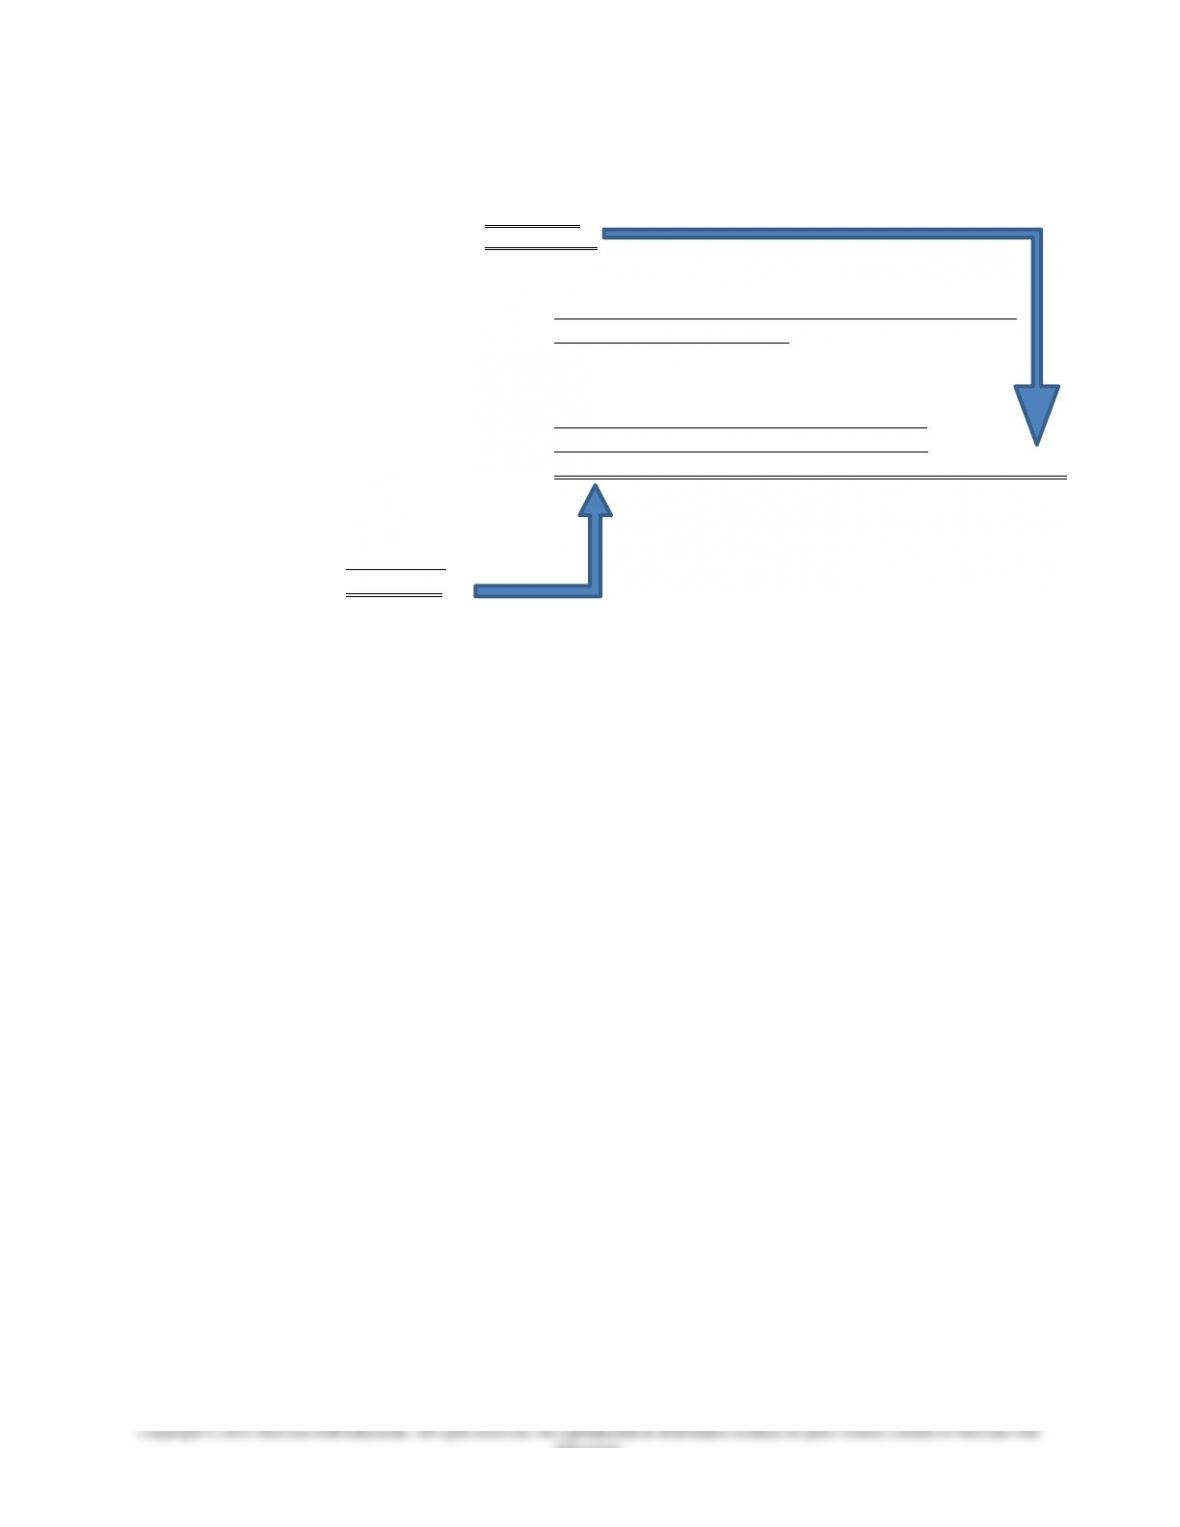
Summary of Strategic Profitability Analysis
The exhibit below summarizes variances for strategic profitability analysis. The top panel shows that the
firm increased its operating income by $290,400 in 2016. The strategic profitability analysis in the middle
panel shows that the increase in operating incomes is attributable to favorable growth and productivity.
The firm was not successful in recovering increases in resources through higher selling prices of its
products. The bottom panel of Exhibit 15.21 is a further analysis of the effect of growth factor on
operating income. The analysis points out that the $104,760 favorable growth factor effect the firm
experienced is a result of the expansion in the market size of the firm’s product. The firm is fortunate in a
growing industry. However, the significant unfavorable market share variance (12.4 percent of the total
operating income in 2016) raises the question of whether the firm is successful in executing its strategy.
An unfavorable market share variance is always a warning signal management seldom can afford to
ignore. A firm with a differentiation strategy is not successful if it loses market share. It signals that the
market did not recognize the value of the firm’s products and the firm failed in differentiating the value of
its products. The lower market share of a cost leadership firm indicates that the firm is not competitive
against its competitors.
16-13
Education.
Chapter 16 – Operational Performance Measurement: Further Analysis of Productivity and Sales
Summary of Strategic Profitability Analysis— CSD Division 2016
Change in operating income:
2015 operating income $2,157,840
2016 operating income 2,448,240
Changes in operating income $ 290,400 F
Strategic profitability analysis:
Growth Price Recovery Productivity Total
Total sales $216,000 F $192,000 F
Direct materials $ 59,400 U $158,400 U $276,480 U
Other variable costs $ 51,840 U $138,240 F $107,520 U
Fixed costs of manufacturing capacity $ – 0 – $240,000 U $480,000 F
R&D $ – 0 – $ 43,800 F $114,000 F
Total cost variances $111,240 U $216,360 U $210,000 F
Total effect on operating income $104,760 F $ 24,360 U $210,000 F $290,400 F
Further analyses of growth factor effect:
Market size $408,564 F
Market share $303,804 U
Total $104,760 F
Increase in selling price can also decrease market share. As costs increase, firms are likely to raise selling
prices to preserve profitability. Firms may also raise prices to earn a higher operating income. Costs of
input resources for CSD increased during 2016 because of the increased direct materials prices and
decreased productivity. Increases in selling prices contribute $192,000 to operating income. However,
increases in direct materials costs and decreases in direct materials productivity add $434,880 ($158,400
+ $276,480) to the cost of 2016. CSD benefited from the decreased hourly cost of other variables costs
(from $60 to $56 per hour). The lower hourly cost contributed $138,240 to the operating income.
However, the lower productivity on using other variable costs lessened the benefit by $107,520. Overall,
the increase in selling prices that added $192,000 to the operating income failed to cover the increase in
variable costs of $404,160 ($158,400 + $276,480 – $138,240 + $107,520).
Through reductions in fixed costs and R&D expenses, CSD added $397,800 ( $240,000 – $43,800 –
$480,000 – $114,000) to 2016 operating income. Reductions in excess capacity increased operating
income of the period. The reduction is a good decision if the firm will not need the reduced capacity in
the foreseeable future or the savings from the reduced capacity is greater than the cost to restore the
capacity in the event that the firm needs the capacity. The savings from R&D would be questionable,
especially for a firm with a differentiation strategy. CSD reduced the number of employees in R&D and
lowered the average salary from $60,650 to $57,000 per employee. Continuous improvements often are
critical for a firm competing on a differentiation strategy. Decreases in R&D expenditures may diminish
competitiveness of the firm. The decreases in manufacturing capacity and R&D are appropriate for a cost
leadership firm if the firm will not need the reduced manufacturing capacity to meet market demands in
the future and the reduced R&D is not needed to maintain competitiveness.
CSD’s increases in selling price lagged behind faster increases in costs in 2016. This suggests that the
firm was not effective if it competes on a cost leadership strategy. A cost leadership firm rarely can afford
unfavorable variances on input resources, especially for variable manufacturing resources. Unfavorable
cost variances take away the firm’s competitiveness on cost leadership.
16-14
Education.