Chapter 15 – Operational Performance Measurement: Indirect-Cost Variances and Resource-Capacity Management
15-41 (Continued-1)
does say, however, that when practical capacity is used to set fixed overhead rates,
then allocated cost (to outputs) equals the ratio of actual output to practical capacity.
Further, this Regulation stipulates that any resulting fixed overhead variance, when
the fixed overhead rate is based on practical capacity, can be written off as a period
cost (rather than being pro-rated across inventories and CGS).
convergence of these requirements) over time.
2. As noted in the text, there are two basic ways to handle the end-of-period disposition
of standard-cost variances, including those associated with manufacturing overhead.
One approach is to close out the variances to the CGS account. (In effect, this
method treats the overhead variances as period costs, or negative period costs.) The
alternative method is to pro-rate the variances across inventory and cost of goods
sold (CGS) accounts.
GAAP (FASB ASC 330-10-30-6 and -7, previously SFAS151—“Inventory Costs: An
Amendment of ARB No. 43, Chapter 4,” and available at www.fasb.org) reaffirms
(and brings U.S. reporting standards more in line with International Accounting
Standards in the area) that abnormal amounts of idle facility expense (as well as
GAAP implies that when normal capacity is used for allocated fixed overhead costs to
product, then any amount of unallocated overhead should be viewed as “abnormal”
and therefore treated as a period cost.
Current income-tax requirements regarding the end-of-period disposition of overhead
variances is found in Reg. Reg. §1.471-11 (“Inventories of Manufacturers”). This
Regulation stipulates that companies must prorate variances, unless they are
15-51
Education.
Chapter 15 – Operational Performance Measurement: Indirect-Cost Variances and Resource-Capacity Management
15-41 (Continued-2)
3. Our position is that, for internal-reporting purposes, a certain amount of latitude
should be afforded managers in regard to setting fixed overhead rates (specifically,
choice of denominator activity level) and the manner in which standard cost variances
are treated at the end of the year. Thus, one approach to this question is to focus on
intent. Here the IMA’s Statement of Ethical Professional Practice (www.imanet.org)
Each member (of the profession) has a responsibility to: communicate
information fairly and objectively; and, to disclose all relevant information
that could reasonably be expected to influence an intended user’s
understanding of reports, analyses, or recommendation.
Under this standard, therefore, one might argue that it would be unethical to choose
(or change) the denominator activity level solely to improve reported operating
results, particularly when these results would then be communicated to financial
readers both alternatives not chosen as well as the operating income that would have
been reported under these alternatives.
Finally, students might note that the standard of “competence” applies to the question
at hand. Part of this Standard states that IMA members are expected “to perform
professional duties in accordance with relevant…technical standards.” At issue is
Education.

Chapter 15 – Operational Performance Measurement: Indirect-Cost Variances and Resource-Capacity Management
15-42 Research Assignment, Strategy, Resource Capacity Planning; Time-Driven ABC
(50-60 Minutes)
1. A summary, diagrammatic representation of the “closed-loop” management system
proposed by Kaplan and Norton (2008) is provided on page 65 of the article. The five
components of this system are as follows:
1) Stage 1: Developing Strategy—Set Clear Strategic Goals (e.g., “what business are
we in, and why?”, “what are the key issues we face in our business?”, and “How
can we best compete?”
2) Stage 2: Strategy Translation—Development of Specific Objectives and Initiatives
That Will Be Communicated to All Employees (via use of Strategy Maps, Balanced
Scorecards, Strategic Themes, and Development of Strategic Expenditures Budget
—see text Chapter 12)
3) Stage 3: Operational Planning (i.e., how the organization intends to accomplish its
strategic objectives specified in Stage 2; available tools include: process-
improvement plans; resource capacity planning; and budgeting—both operating
budgets and capital budgets)
4) Stage 4: Monitoring and Learning (i.e., both operational-review meetings and
strategy-review meetings are conducted to review results and performance
metrics)
5) Stage 5: Testing and Adapting the Strategy (i.e., assessment of the strategy itself
and, if necessary, revision of the strategy)
In terms of text Chapter 15, we note the relevance of “resource capacity planning,” a
component of Stage 3 of the management system proposed by Kaplan and Norton
(2008).
2. As noted above, planning resource capacity is one of the key elements of Stage 3 of
the management system. As noted on page 72 of the article, the process of planning
resource capacity presumes the existence of a sales forecast and operating plan for
3. In traditional ABC, resource expenses assigned to activities (e.g., handling a
customer’s order) are determined through employee surveys, time-logs, and
interviews. Activity cost-driver rates for each major activity are then calculated by
15-53
Chapter 15 – Operational Performance Measurement: Indirect-Cost Variances and Resource-Capacity Management
15-42 (Continued-1)
dividing budgeted resource expenditures (in the cost pool) by the outputs of each
activity (e.g., number of orders processed). Such systems were therefore subject to
inherent in accuracies. Further, traditional ABC systems are difficult (cumbersome) to
update (e.g., to account for increases in operational efficiencies). These problems,
and others, combined to prevent the successful implementation of traditional ABC
a) The cost of supplying resource capacity in each department or process; this
activity in question (e.g., handling a customer’s order)
As noted on page 72 of the article, time equations from TDABC are used to model
resource consumption of products, services, and customers. Once a sales and
operating plan has been determined, TDABC can be used to forecast resource
4. Essentially, Towerton Financial followed the procedure outlined above in (3) to
estimate resource capacity needed to support its sales and operating plan for the
period. First, the company broke down its total sales forecast into the four component
revenue sources listed on page 70. It then, for each line of business, estimated the
total volume of support activities (e.g., calls to customer service center) that would be
15-54
Education.
Chapter 15 – Operational Performance Measurement: Indirect-Cost Variances and Resource-Capacity Management
15-43 Research Assignment: Control of Capacity-Related Manufacturing Costs;
Strategy (60-75 Minutes)
This assignment pertains to the following article: K. Snead, D. Stott, and A. Garcia,
“The Causes of Misapplied Capacity-Related Manufacturing Costs and
Corresponding Reporting Implications: A Conceptual Perspective,” Journal of
Accounting Education, Vol. 28 (2010), pp. 85-102.
1. In general, how does this article relate to the material covered in Chapter 15?
A major theme in chapter 15 is the determination and interpretation of end-of-period
standard cost variances for indirect manufacturing costs (i.e., manufacturing
overhead). As indicated in the chapter, the total fixed overhead variance for a given
period can be broken down into a fixed overhead spending variance and a fixed
overhead production volume variance (also referred to as the denominator variance).
This latter variance is the difference between budgeted fixed overhead for the period
2. What do the authors of this article mean when they use the term “misapplied capacity
costs”?
As indicated in the Abstract to Snead et al. (2010), the authors use the term
“misapplied capacity costs” to refer to over/under-absorbed budgeted fixed overhead
costs during a period or, in short, the production volume variance. Note that: (1) the
notion of capacity costs refers to short-term fixed costs that provide the capacity or
3. Into what three components do the authors feel the production volume variance
should be decomposed? How are each of the three component variances calculated?
The authors propose that for management decision-making and control purposes that
the total production volume variance be partitioned into a portion related to capacity
15-55
Education.
Chapter 15 – Operational Performance Measurement: Indirect-Cost Variances and Resource-Capacity Management
15-43 (Continued-1)
but in the shorter run planned to be used to cover seasonality effects. In addition, the
effect of “estimation error” is also explicitly considered in the authors’ framework. To
operationalize the framework recommended by the authors requires the following
estimates: practical capacity (PC); normal capacity (NC); expected annual capacity
(EAC) usage; expected quarterly capacity (EQC) usage; and, actual capacity used
during a period. Note that EAC represents the annualized (mean) of each year’s four
EQC levels.
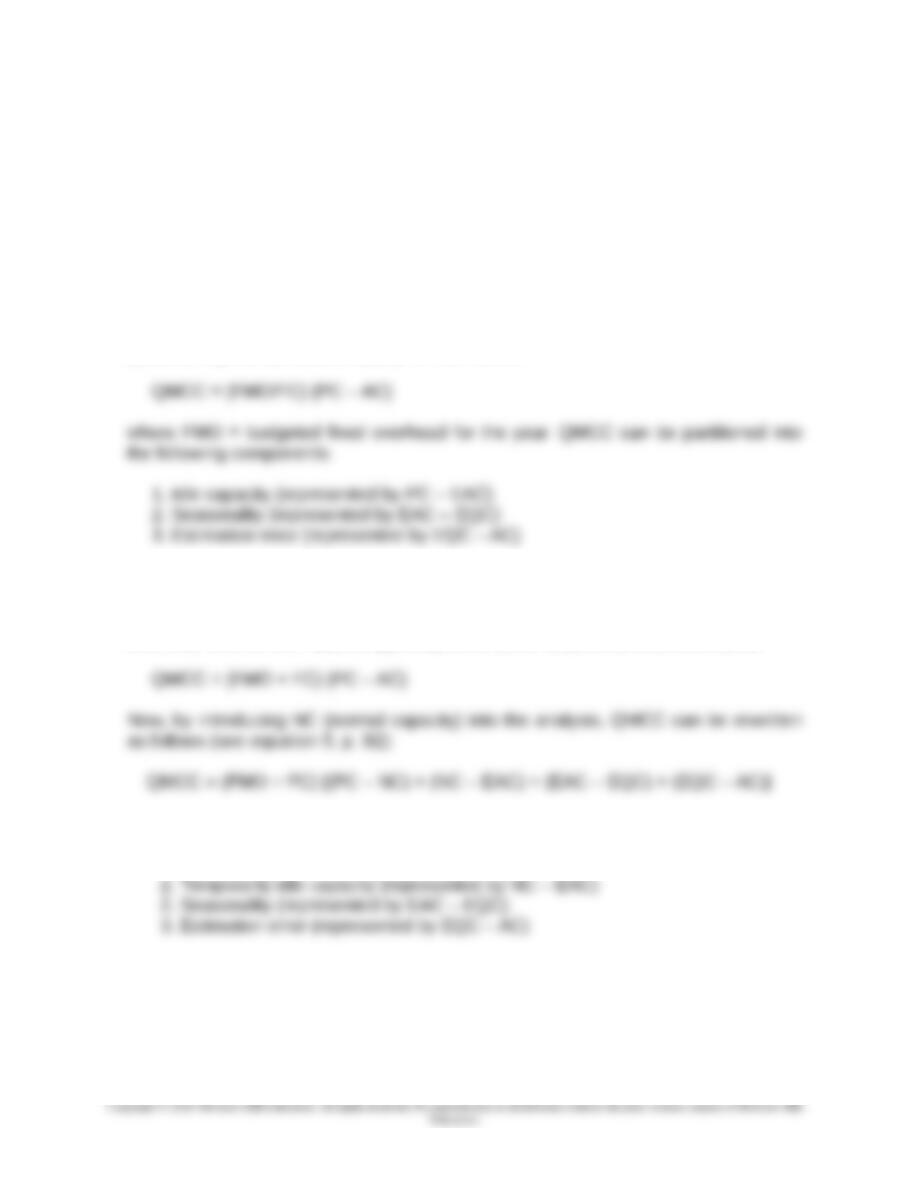
In a single-year timeframe, quarterly misapplied overhead cost for each quarter
(QMCC) is given by equation (3), p. 91, as follows:
In a multi-year timeframe, the preceding formula is expanded in order to capture
expected annually increasing use of capacity due to anticipated growth in demand.
As before, the analysis is presented on a quarterly basis so that quarterly misapplied
overhead cost for each quarter (QMCC) is the same as presented above, that is:
Next, QMCC be partitioned as follows:
1. Permanently idle capacity (represented by PC – NC)
15-56
Chapter 15 – Operational Performance Measurement: Indirect-Cost Variances and Resource-Capacity Management
15-43 (Continued-2)
4. According to the authors, what is the connection between the variance-decomposition
model they are proposing and the managerial control of capacity-related costs?
As seen in Chapter 14 (in the discussion of variances associated with variable costs),
partitioning a total variance into its constituent parts provides deeper understanding
regarding the source/cause of the variance. In terms of the production volume
variance, application of the authors’ framework in practice could allow us to proceed
beyond the rather vague statement in the chapter to the effect that “the production
5. What do the authors of this article indicate are the financial-reporting consequences
of their proposed reporting framework?
One important implication for financial-reporting purposes pertains to end-of-period
disposition of standard cost variances, particularly the portion of the production
volume variance related to seasonality and the portion related to anticipated growth.
exploration costs).
Further, as stated in the text and the article by Snead et al., current financial reporting
guidelines require that NC, not PC, be used to calculate predetermined application
rates for fixed overhead. Thus, one interesting issue is whether, based on the
arguments set forth in the article, this particular financial reporting requirement might
be reexamined.
Finally, as noted by the authors (p. 100), the proposal to allow deferral of certain
15-57
Education.

Chapter 15 – Operational Performance Measurement: Indirect-Cost Variances and Resource-Capacity Management
15-44 Proration of Variances (60 minutes)
Proration of Direct Materials Variances
Proration of DM Proration of DM Net Change Total $DM
Standard Price Variance, PV Total after Usage Variance After After
1. The amount of direct materials price variance, PV, prorated to finished goods ending inventory: $1,794
2. The total amount of direct materials in finished goods ending inventory after proration of all materials variances:
Total direct labor variance $15,000U
Actual manufacturing overhead incurred $690,000
Manufacturing overhead applied to:
Finished goods inventory $104,400
Cost of goods sold 591,600 696,000
Manufacturing overhead overapplied $ 6,000
15-58

Chapter 15 – Operational Performance Measurement: Indirect-Cost Variances and Resource-Capacity Management
15-44 (Continued-1)
Total Cost DL Cost before Proration of Prorated Total
Before Proration DL OH DM Cost after
Proration Dollar % Variance Variance Variance Proration
FG 321,900 130,500 15 2,250U 900F 1,268F 321,982
CGS 1,679,100 739,500 85 12 ,750 U 5 ,100 F 5 ,072 F 1,681,678
Total 2,001,000 870,000 100 15 ,000 U 6 ,000 F 6 ,340 F 2,003,660
4. The total cost of goods sold for the year ended December 31 after all variances have been prorated: $1,681,678
5. Generally accepted accounting principles (GAAP) (FASB ASC 330-10-30-3 to -7, previously SFAS151—“Inventory
Costs: An Amendment of ARB No. 43, Chapter 4,” and available at www.fasb.org) reaffirms (and brings U.S. reporting
standards more in line with International Accounting Standards in the area) that “abnormal” amounts of “idle facility
6. The point of this question is to impress upon students the fact that under absorption costing, reported operating income
can be affected by the method used to dispose of any production volume variance associated with fixed overhead. In
other words, the variance-disposition method can be used to “manage earnings” under absorption costing.
15-59
15-44 (Continued-2)
production volume variance is disposed of at the end of the period. Specifically, this
ability to affect reported income is confined to the situation where the production
volume variance is written off entirely to cost of goods sold (CGS), as follows:
If inventory is increasing, choosing a lower denominator-volume level will
resulting production volume variance is accounted for that provides management an
opportunity to manage earnings under absorption costing. The above points suggest
that managers can increase short-run operating income by: (1) choosing larger
denominator levels if they expect inventory to decrease, or (2) choosing smaller
denominator levels if they expect inventory to increase. Note, however, that if the
Education.