
Chapter 10 – Strategy and the Master Budget
10-42 Activity-Based Budgeting (ABB) with Continuous Improvement (40 Minutes)
1. Unit-Level: Pick packing, Data entry—Lines
Batch-Level: Requisition handling, Data entry—Requisitions,
Desktop delivery
2. Budgeted cost for each activity and for the division as a whole, February &
March:
Budgeted cost-driver rates:
Cost-Reduction Cost-Driver Rates
Activity Rate (per month) January February March
Requisition Handling 98% $12.50 $12.250 $12.0050
Pick Packing 99% $ 1.50 $ 1.485 $ 1.4702
Budgeted Costs by Activity and for the Division as a whole, February and March:
Activity
Activity Volume February March
Requisition Handling 30,000 $ 367,500 $ 360,150
Pick Packing 800,000 $1,188,000 $1,176,120
Data Entry—Lines 800,000 $ 633,600 $ 627,264
3. Factors that may influence the success of a continuous-improvement (Kaizen)
program include:
Reasonable or achievable cost reductions.
Awareness of all employees on the expected (scheduled) cost
improvements over at least the immediate future periods.
10-40
Education.
Chapter 10 – Strategy and the Master Budget
10-42 (Continued)
4. Primary criticisms of Kaizen (continuous-improvement) budgets include the
following:
The budgeting process tends to place enormous pressure on employees
to reduce all costs, which can lead to employee “burnout.”
10-41
Education.
Chapter 10 – Strategy and the Master Budget
10-43 Time-Driven Activity-Based Budgeting (TDABB) (60 minutes)
1. Calculation of budgeted resource costs per hour (at practical capacity):
Practical Budgeted
Budgeted
Capacit
y Cost per
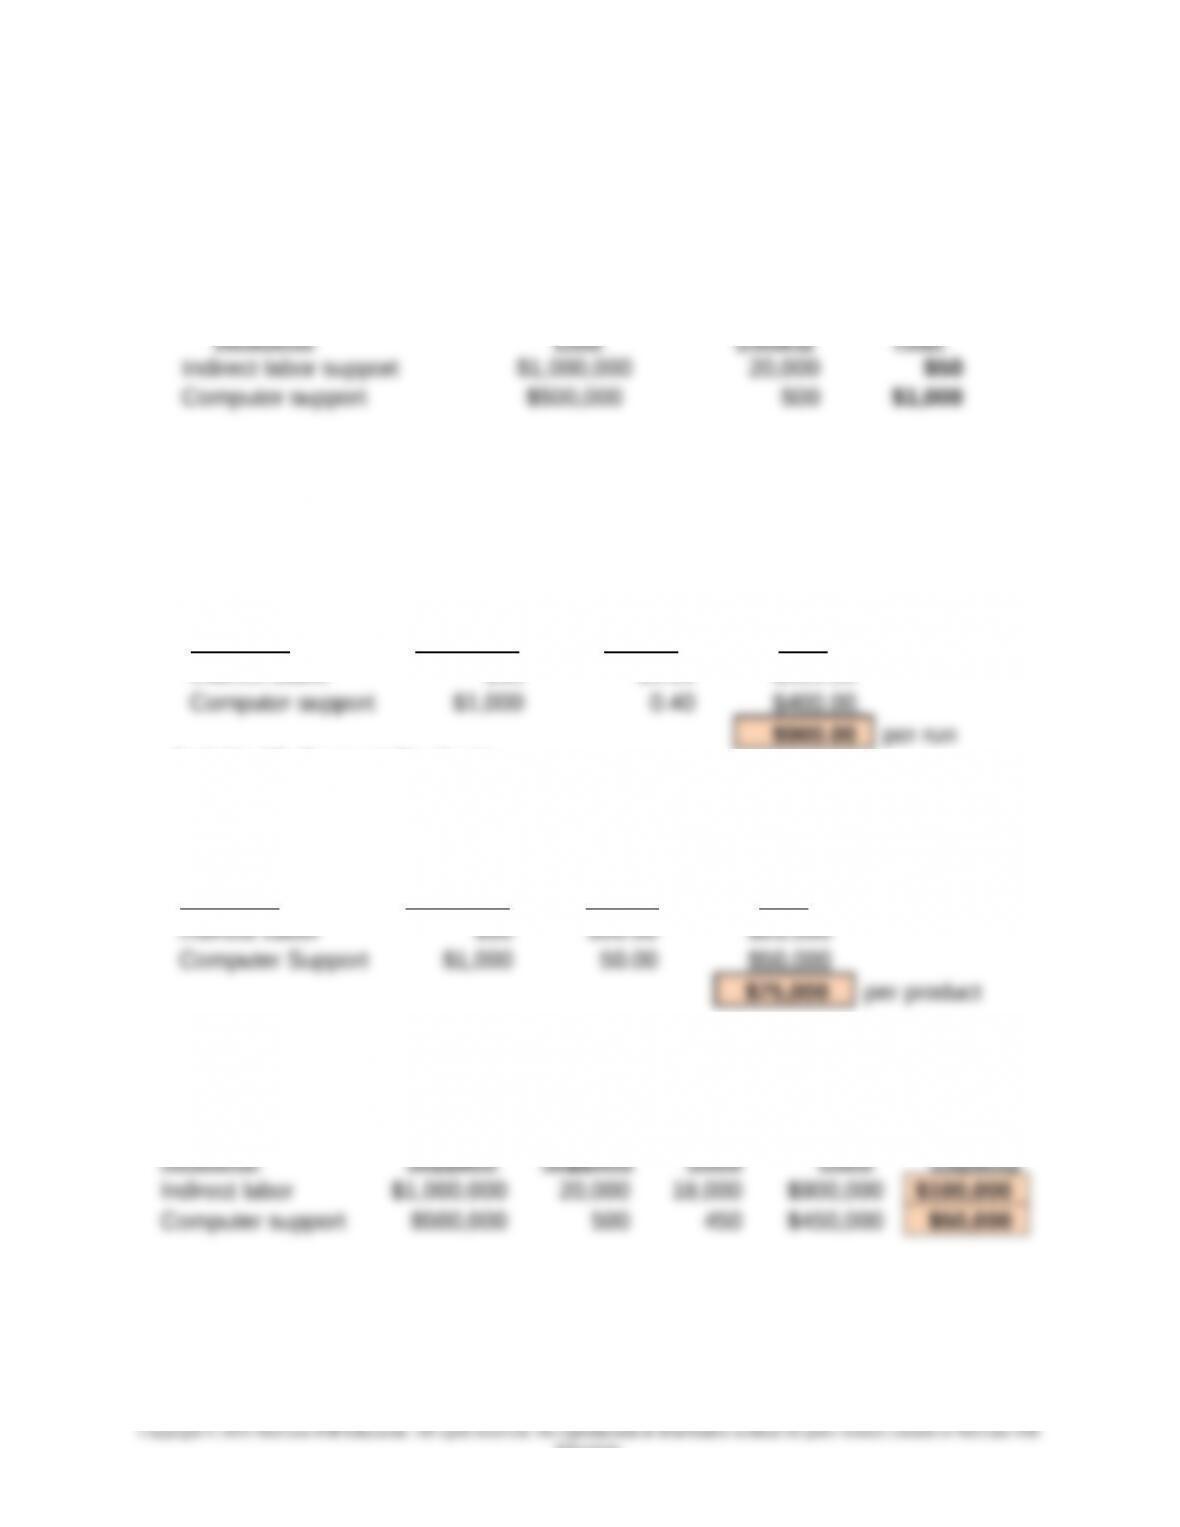
2. Cost-driver rates for each activity (handle production runs, and support product):
Activity #1: Handle Production Runs
(From 1
above) Unit Budgeted
Budgeted Times Cost-Driver
Resource Cost/Hour (hours) Rate
Indirect Labor $50 10.00 $500.00
Activity #2: Support Products
(From 1
above) Unit Budgeted
Budgeted Times Cost-Driver
Resource Cost/Hour (hours) Rate
3. Cost of unused capacity for the quarter, by resource:
Cost of Resource Resource Cost of Cost of
Resource Units Units Resources Unused
10-42
Education.
Chapter 10 – Strategy and the Master Budget
10-43 (Continued)
Generally speaking, the cost of unused capacity should not be assigned to
actual units produced or customers served during the period. However, the cost
of unused capacity should not be ignored–it is someone’s responsibility in the
organization. That is, the cost of unused capacity for a period should be
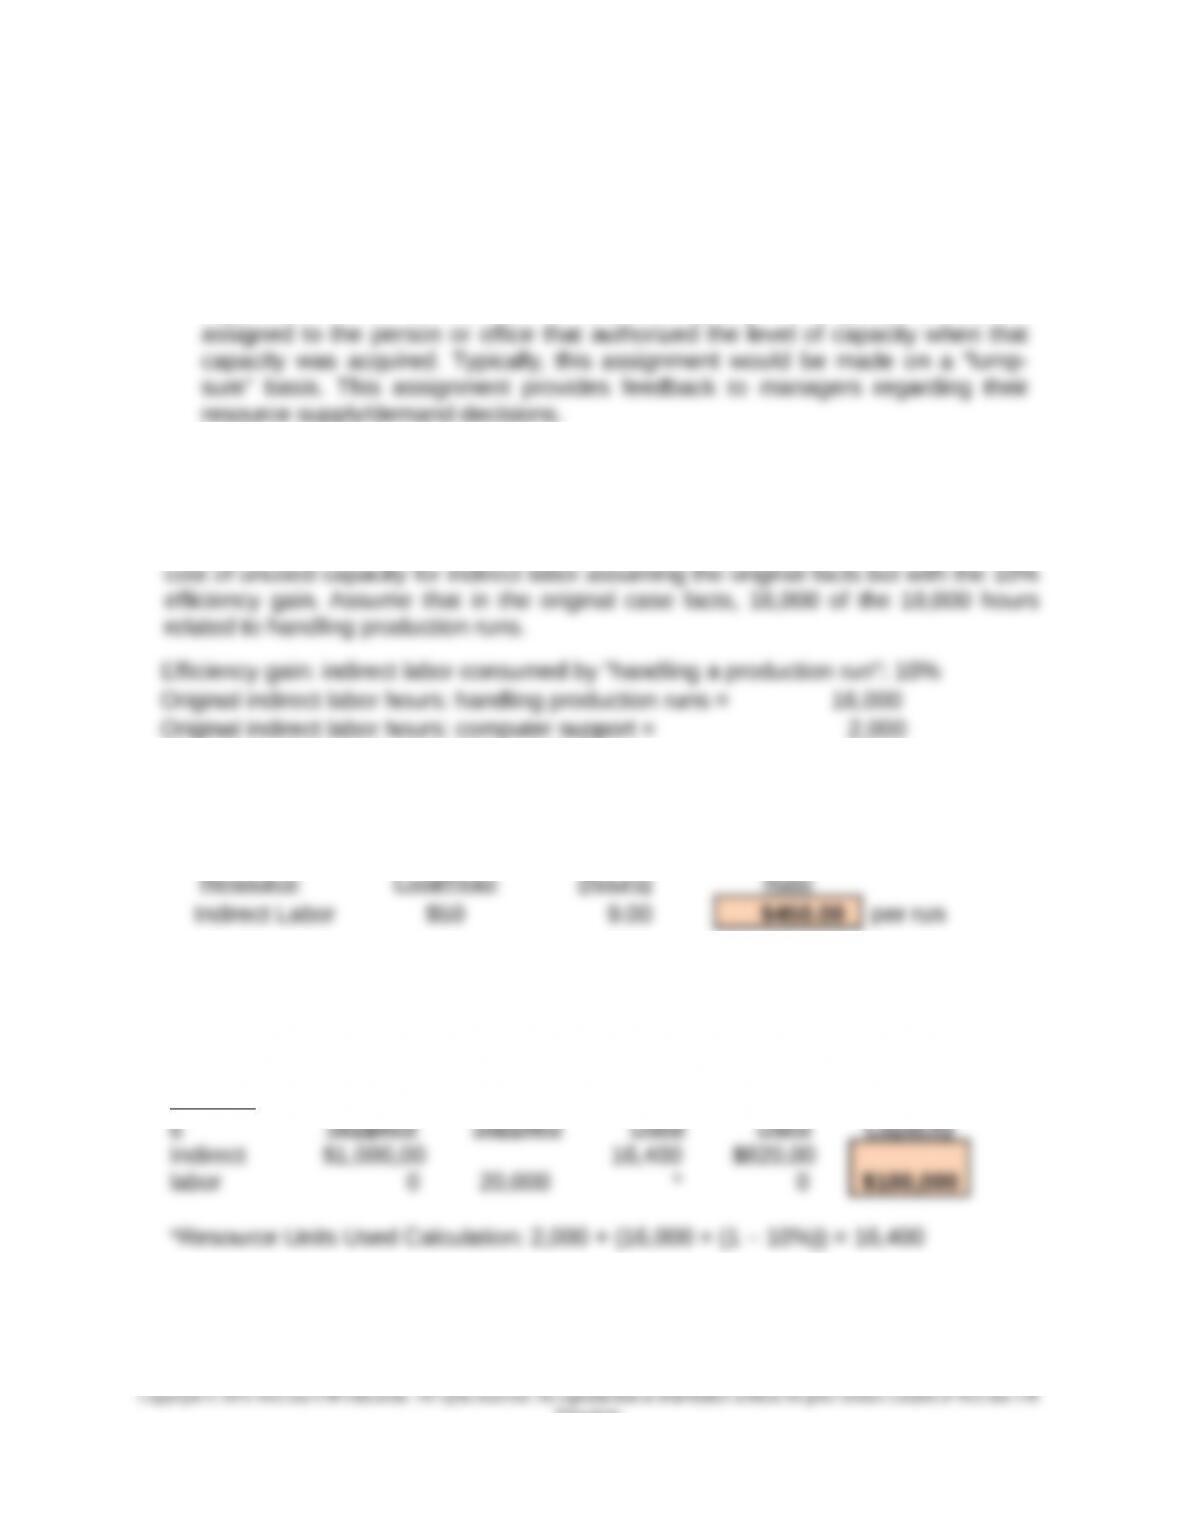
4. After implementing a TQM program, the company was able to implement process-
efficiency changes, the end result of which was a 10% reduction in the indirect labor
time associated with the activity “handling production runs.” Re-estimate the indirect
labor cost component of the cost to handle a production run. Also, recalculate the
Revised Budgeted Cost-Driver Rate: Indirect labor support for “handling a production
run”:
Unit Budgeted
Budgeted Times Cost-Driver
Revised Cost of Unused Capacity–Indirect Labor Support Cost:
Cost of
Resourc
e
Resourc
e Cost of Cost of
Resource Units Units Resources Unused
Resourc
As can be seen, the efficiency gain resulted in “freed-up” indirect labor resources,
which are now available for use elsewhere in the company. In the event that
alternative uses for this labor cannot be found, then management faces the issue
10-43
Education.
Chapter 10 – Strategy and the Master Budget
of whether to reduce its workforce. Also, the reduced cost-driver rate ($50
reduction) would be of potential strategic use to management, for pricing and
product promotion purposes.
10-44 Rolling Financial Forecasts (25 minutes)
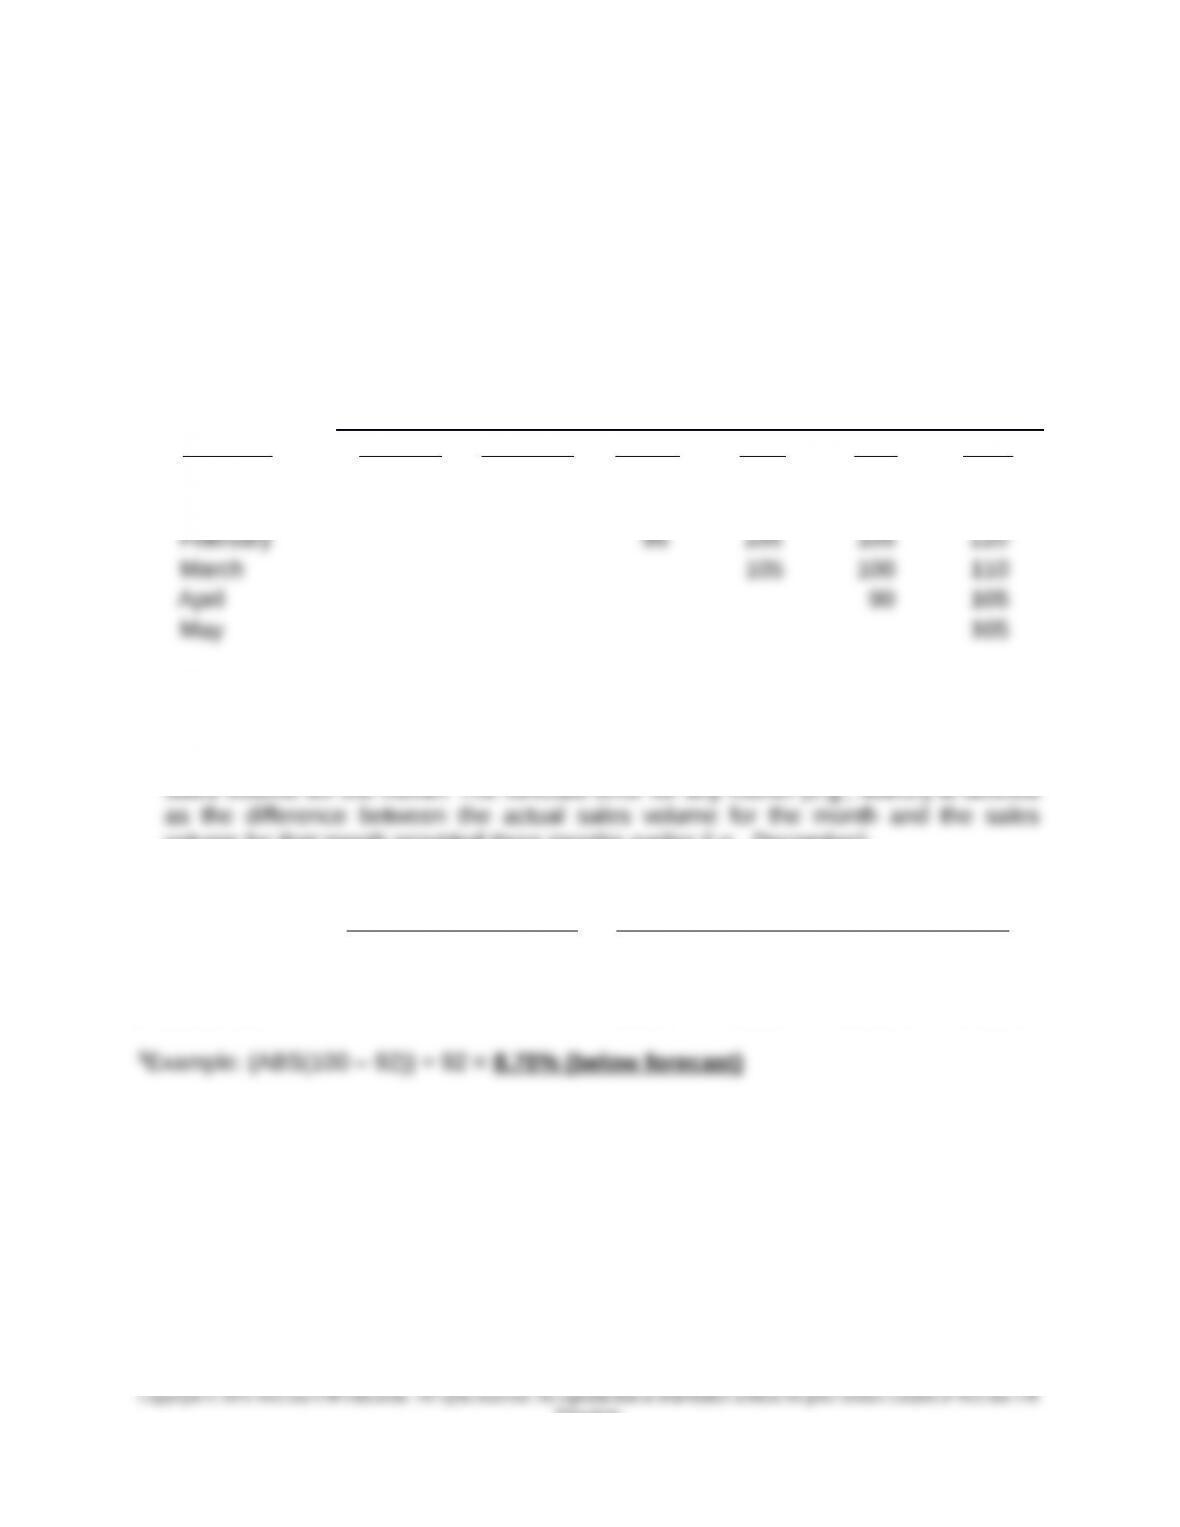
1. “Rolling forecasts” of sales:
Month of Forecast for Month of
Forecast January February March April May June
December 100 95 100 110 120 125
January 90 100 105 110 120
2. Three-month forecast error rates, March through June. (Note: Error rate = 1 –
absolute forecast error.) For example, the forecast error rate for March’s sales is
found by dividing the absolute value of the forecast error for this month by the actual
volume for that month provided three months earlier (i.e., December).
January February ___March April May June
Actual Sales 98 95 92 108 98 100
Forecast error rate – – 8.70%11.85% 22.45% 25.00%
Direction of error – – Below Below Below Below
10-44
Education.
Chapter 10 – Strategy and the Master Budget
10-45 Resource Capacity Planning/ABC (25 minutes)
1. Likely result of the decision to raise prices?
Recalculated fixed operating cost per meal, based on available capacity (meals per
If demand (e.g., because of competitive pressures) should drop even further and the
daily fixed operating cost per meal recalculated again, based on the lower demand,
then the average fixed cost per meal (and total cost per meal) would increase even
further. Perhaps the owners would be tempted to raise prices once again, in an
attempt to recover “cost.” In all likelihood, however, the rising prices of meals would
exacerbate the situation, leading the business to a downward (or what some refer to
as “death”) spiral.
2. Alternative approach for allocating daily fixed operating cost to each meal:
The owners of this business should consider calculating the fixed operating cost per
meal based on “practical capacity.” This practice would avoid the downward business
spiral referred to above and attributable to an escalating “cost” per meal. In fact,
using some notion of capacity would allow the owners to make an assessment of the
10-45
Education.
Chapter 10 – Strategy and the Master Budget
10-46 Kaizen Budgeting (50 minutes)
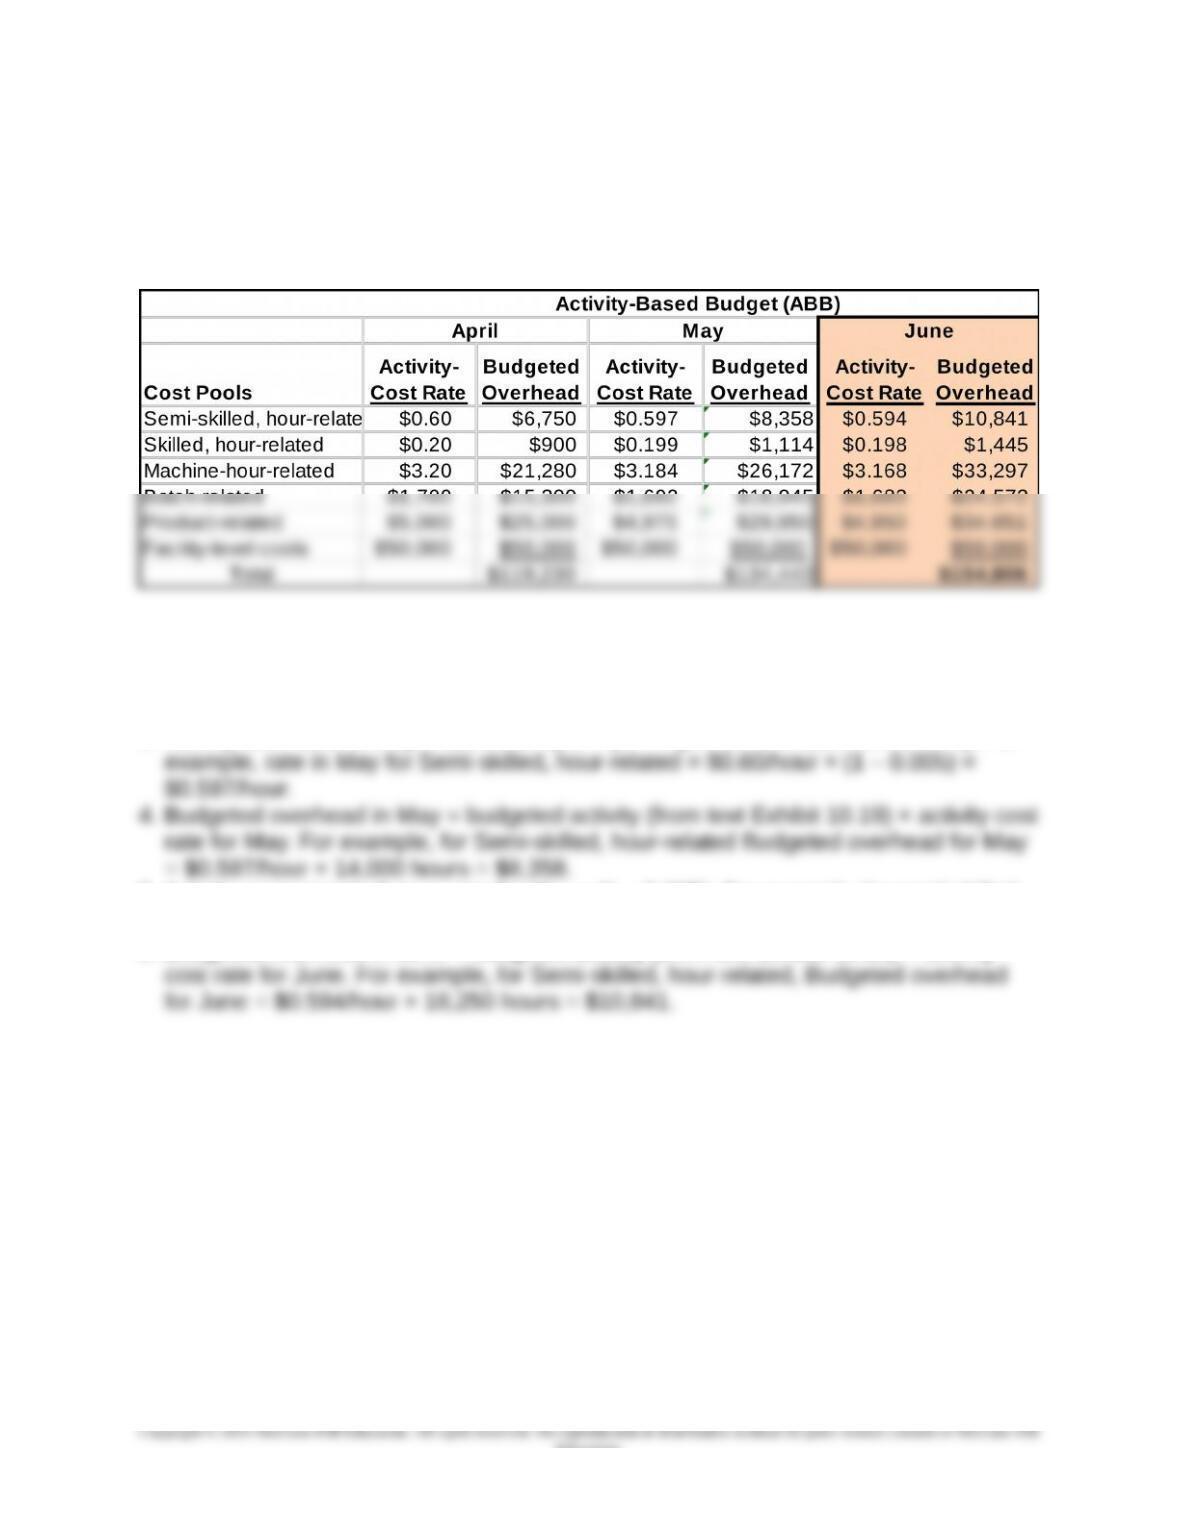
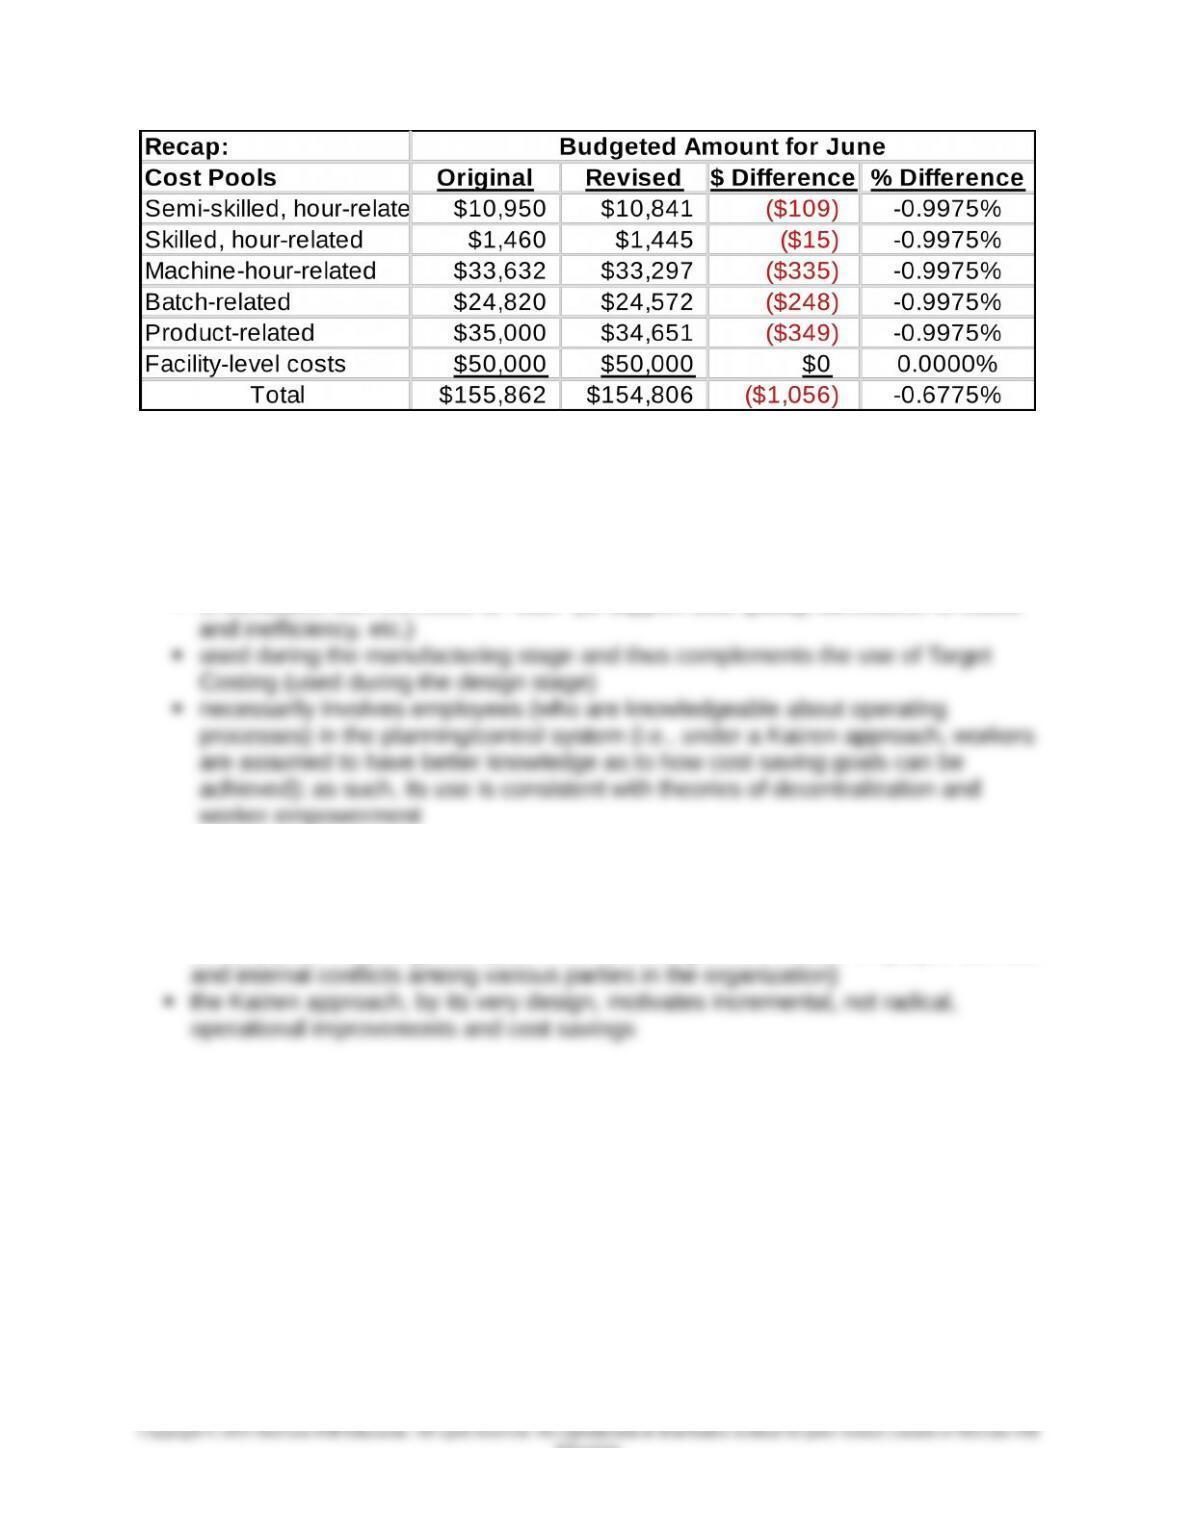
1. Recalculated budgeted factory overhead cost for June, under the assumption that,
starting in May, each budgeted cost-driver rate decreases by 0.5% relative to the
preceding month.
Sample Calculations:
1. Activity cost rates in April: Given (text Exhibit 10.19)
2. Budgeted overhead in April: Given (text Exhibit 10.19)
3. Activity cost rates in May: Rate from April × (1 – improvement rate/month, 05%). For
5. Activity cost rates in June = rate for May x (1 – 0.005). For example, for semi-skilled,
hour-related, June’s activity cost rate = $0.597/hour × (1 – 0.005) = $0.594/hour.
6. Budgeted overhead in June = budgeted activity (from text Exhibit 10.19) × activity
10-46 (Continued-1)
10-46
Education.
Chapter 10 – Strategy and the Master Budget
2. In general, the benefits associated with a move to continuous (i.e., Kaizen) budgeting
include the following:
helps ensure that the budget is a forward-looking tool
may help the organization stave off competition or otherwise secure a competitive
advantage
is consistent with the move to “lean” (to support total quality, elimination of waste
3. Principal concerns or limitations associate with Kaizen budgeting:
a Kaizen approach places pressure on employees to meet continually revised (and
stricter) performance goals; dysfunctional consequences include employee burnout
4. Examples of how Kerry Company could realize the cost savings referenced above in
Requirement 1: the activity cost rates are calculated as budgeted spending (on
resources) divided by the practical capacity (i.e., supply) of resources acquired.
Therefore, the rate can go down either because total budgeted spending is decreased,
or the supply of activities is increased while holding spending constant. Both would
seem to rest on notions of increasing efficiency. Some examples, referenced to text
Exhibit 10.19 might include the following:
10-47
Education.
Chapter 10 – Strategy and the Master Budget
10-46 (Continued-2)
move to a JIT production system
incorporate technology into (i.e., automate) the order-processing system used by
effecting changes in the layout of the facility (e.g., to reduce movement and
storage of inventory
Notice, too, that in order to reduce spending (on resources), management has to take
direct and deliberate action to do so. This is due in large part because some of the
activity costs in an ABC model are considered short-term fixed costs. As such, the only
10-48
Chapter 10 – Strategy and the Master Budget
10-47 Budgetary Slack and Zero-Based Budgeting (ZBB) (30 minutes)
1. Budgetary slack is a planned difference between budgeted revenue and expected
revenue, and/or budgeted expenditures and expected expenditures. Budgetary
slack describes the tendency of managers to under-estimate revenues and over-
2. a. From the point of view of the business unit manager, budgetary slack provides:
performance that will “look better” in the eyes of their superiors
evaluate the performance of subordinates and to use the budget as a control
mechanism over subordinate performance.
b. From the perspective of corporate management, the use of budgetary slack
increases the probability that budgets will be achieved. This increased
probability facilitates the overall corporate budgeting process. Corporate
management may also allow budgetary slack as a form of reward to managers
for previous good performance.
However, from the point of view of corporate management, the use of budgetary
3. a. Zero-based budgeting (ZBB) is a budgeting technique that evaluates all
proposed operating and administrative expenditures as though they were being
b. Atlantis Laboratories could benefit from ZBB as each of the business unit
10-49
Education.