Chapter 10 – Strategy and the Master Budget
10-33 Accounts Receivable Collections and Sensitivity Analysis (50 minutes)
Original Assumptions/Data:
Actual credit sales for March $130,000
Actual credit sales for April $160,000
Estimated credit sales for May $210,000
Estimated collections in month of sale 25%
Estimated collections in first month following month of sale 60%
Estimated collections in the second month after month of sale 10%
Estimated provision for bad debts in month of sale 5%
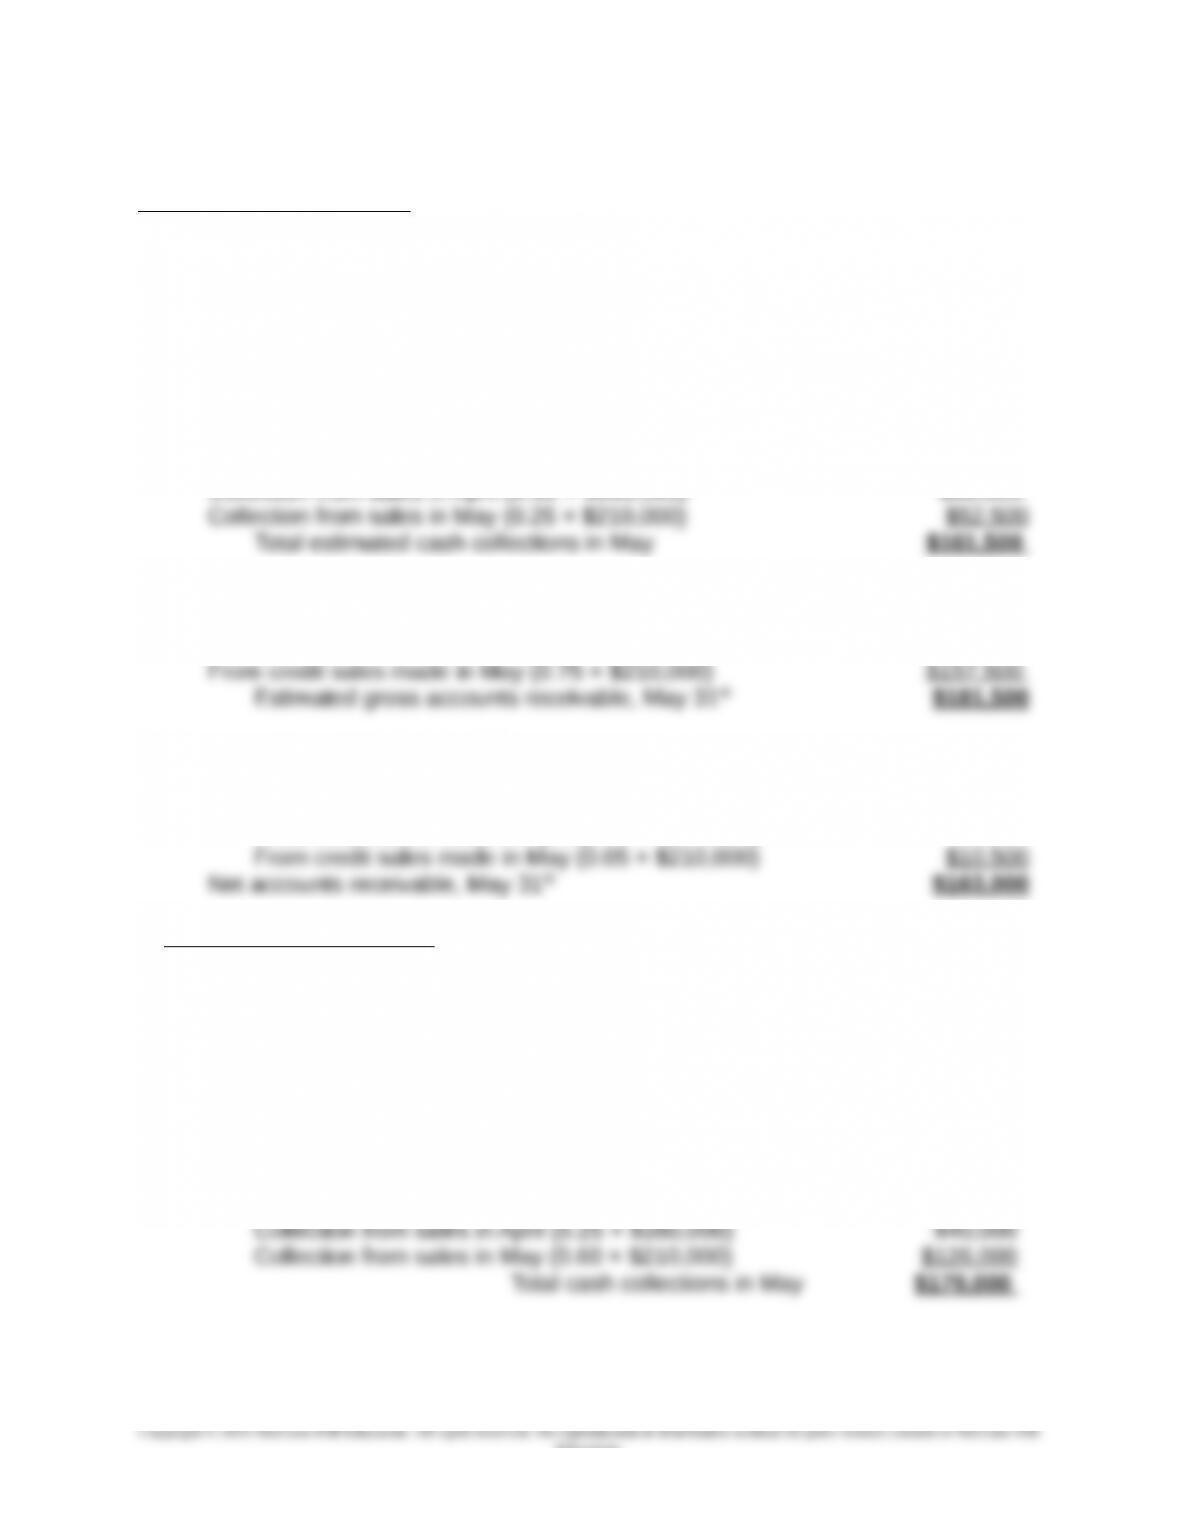
1. Estimated cash receipts in May from collection of accounts receivable:
Collection from sales in March (0.10 × $130,000) $13,000
Collection from sales in April (0.60 × $160,000) $96,000
2. Gross accounts receivable, May 31st (after appropriate write-off uncollectible
accounts):
From credit sales made in April (0.15 × $160,000) $24,000
3. Net accounts receivable, May 31st:
Gross accounts receivable, May 31st (from (2) above) $181,500
Less: Allowance for uncollectible accounts:
From credit sales made in April (0.05 × $160,000) $8,000
4. Revised data/assumptions:
Actual credit sales for March $130,000
Actual credit sales for April $160,000
Estimated credit sales for May $210,000
Estimated collections in month of sale 60%
Estimated collections in first month following month of sale 25%
Estimated collections in the second month after month of sale 10%
Estimated provision for bad debts in month of sale 5%
a. Estimated cash receipts from collections in May:
Collection from sales in March (0.10 × $130,000) $13,000
10-20
Education.
Chapter 10 – Strategy and the Master Budget
10-33 (Continued)
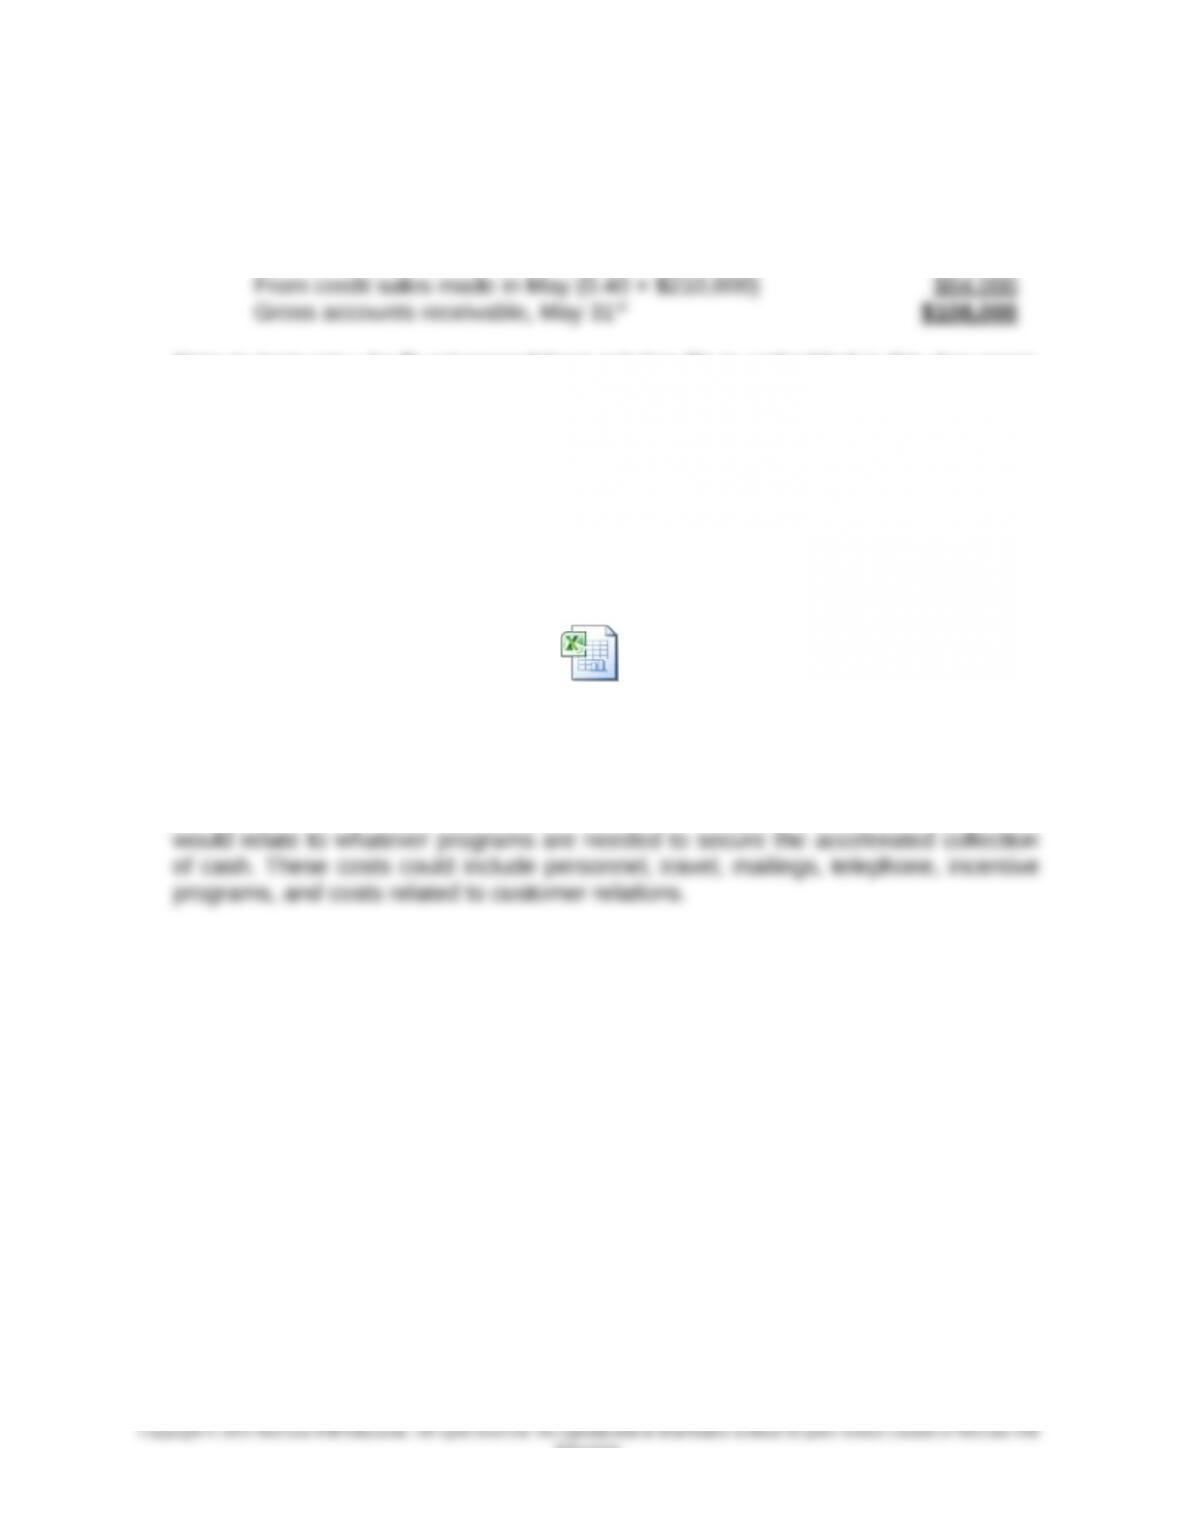
b. Gross accounts receivable, May 31st (after appropriate write-off of uncollectible
accounts)
From credit sales made in April (0.15 × $160,000) $24,000
Note to Instructor: An Excel spreadsheet solution file is embedded in this document.
You can open the spreadsheet “object” that follows by doing the following:
1. Right click anywhere in the worksheet area below.
2. Select “worksheet object” and then select “Open.”
3. To return to the Word document, select “File” and then “Close and return
to…” while you are in the spreadsheet mode. The screen should then
return you to the Word document.
5. The principal benefit is the accelerated receipt of cash, which the company can
potentially employ to pay down debt, reduce borrowing, invest, etc. Principal costs
10-21
Education.
Ex. 10-33 7e.xlsx
Chapter 10 – Strategy and the Master Budget
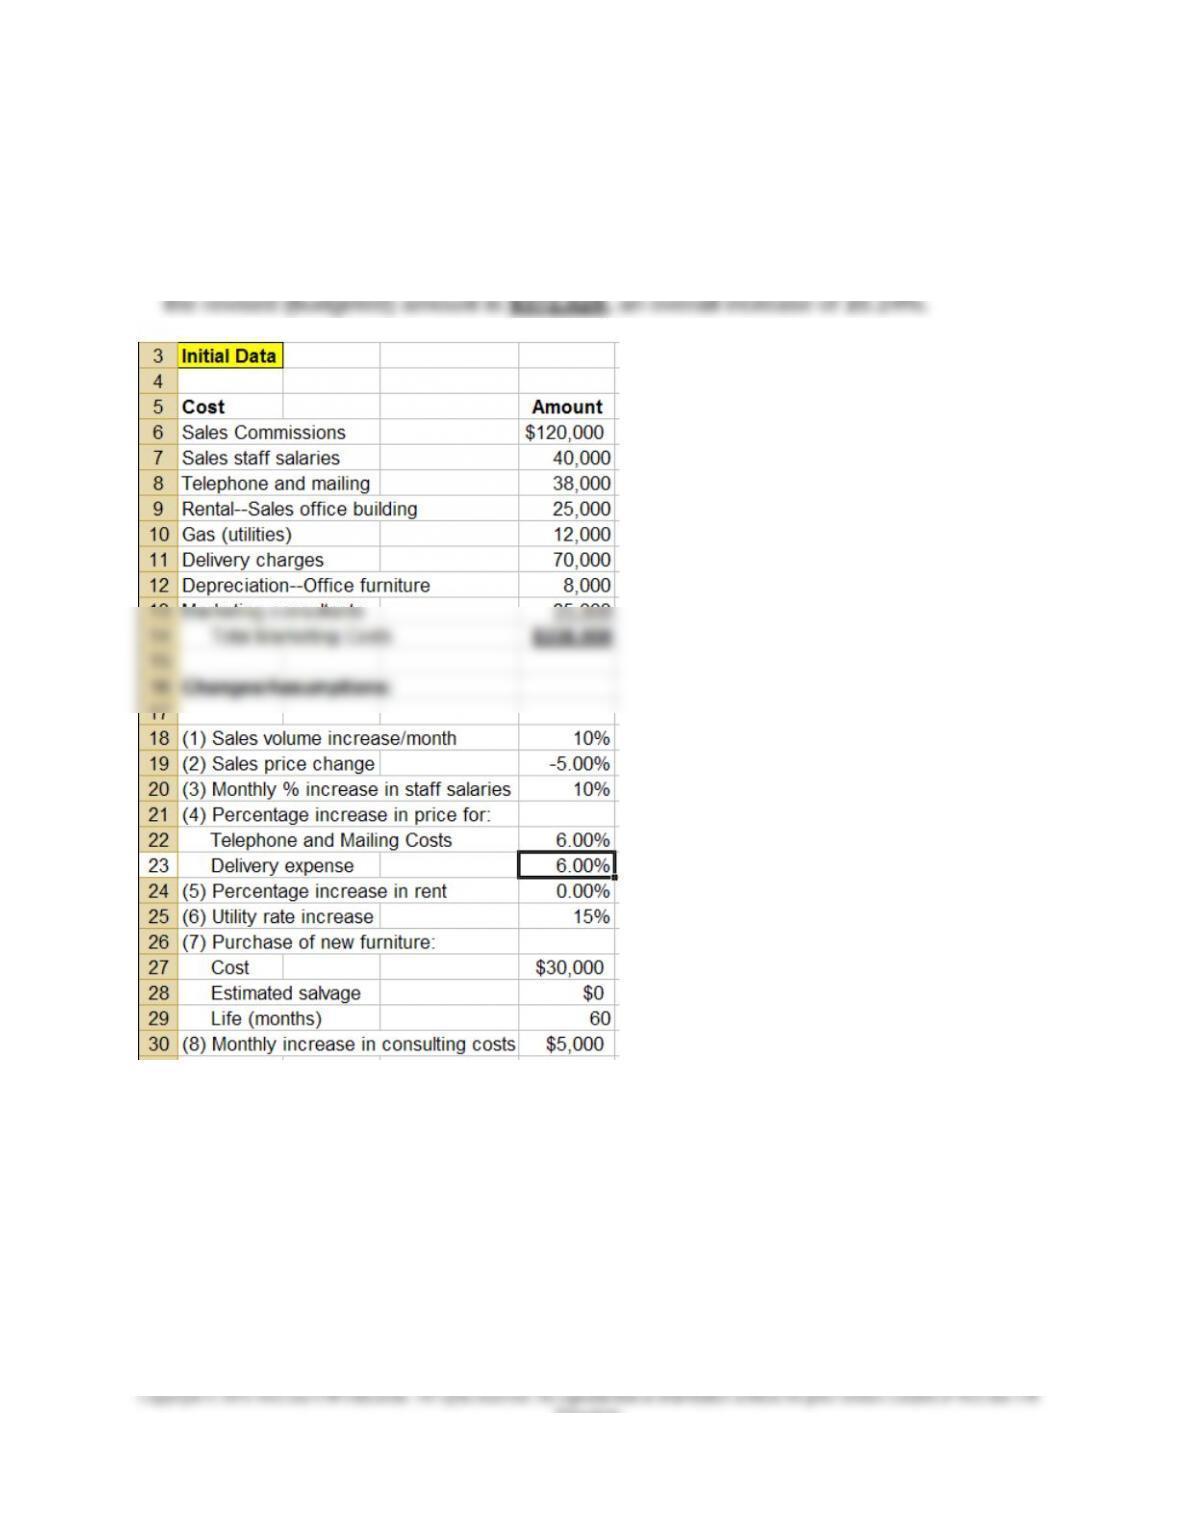
10-34 Budgeting for Marketing Expenses; Strategy (50 minutes)
1. The following screen shots are from the Excel spreadsheet created for this problem.
It shows that the original monthly budgeted marketing expense is $338,000 and that
10-22
Education.
Chapter 10 – Strategy and the Master Budget
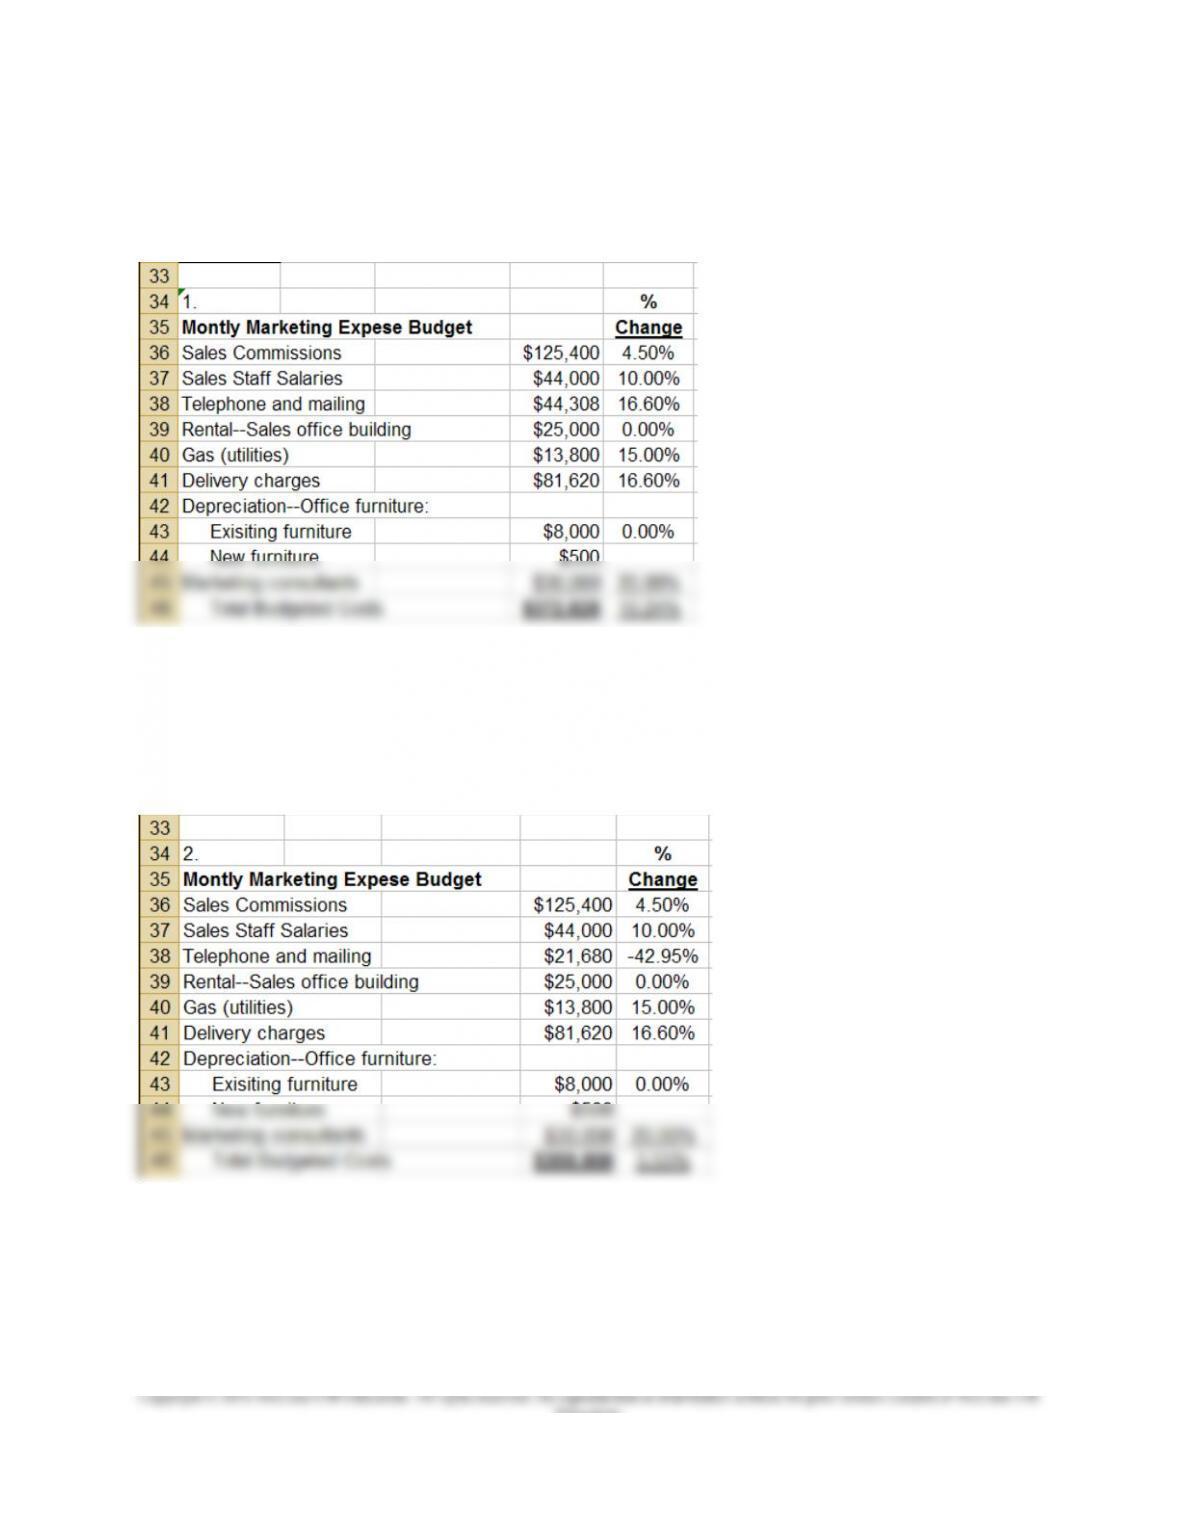
10-34 (Continued-1)
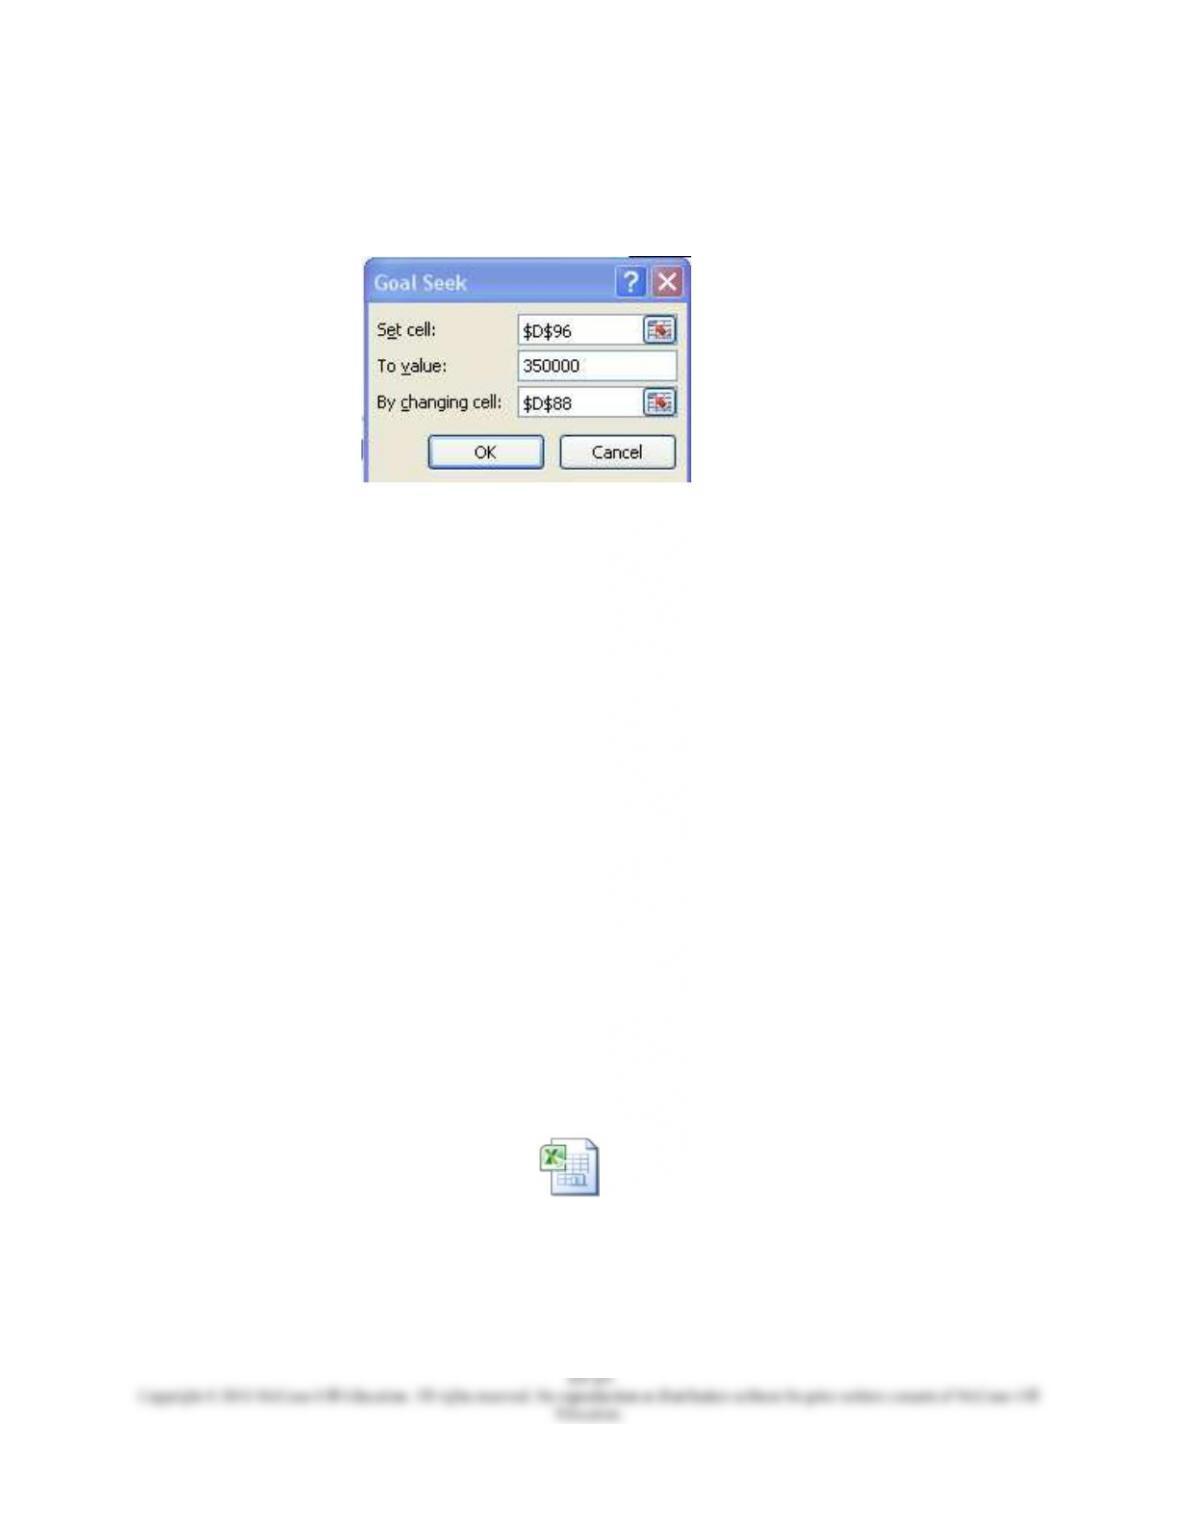
2. To achieve the monthly targeted cost of $350,000, the rate of “telephone and mailing”
costs cannot increase at all (as is the case in the proposed budget); in fact, the
results of the “goal seek” analysis indicates that such rates must be decreased by
approximately 43%, as shown below:
These results are generated by completing the following dialog box that appears after
activating the “Goal Seek” command from the “Data” tab, then “What-If Analysis”
menu in Excel 2010:
10-23
Education.
Chapter 10 – Strategy and the Master Budget
10-34 (Continued-2)
3. As indicated in the text, budgets can be used both for control and for planning
purposes. The relative importance of each can be linked either to the competitive
strategy the business is pursuing or to the product life-cycle. In the present case
(start-up company, competing on the basis of a product-differentiation strategy), the
relative emphasis of the marketing budget is likely more for planning than control.
That is, the information contained in this budget can assist the company in
determining its financing needs. However, it probably should not be used for
“controlling” (i.e., cutting) expenses in situations where the underlying expenditures
are determinants of competitive success. Further, many types of so-called
“discretionary costs” (such as marketing) are fixed (or at least “sticky”) and therefore
difficult to cut in the short run. As such, the primary benefit of the budget in such
cases is to better plan for, rather than control, the underlying expenses.
Note to Instructor: The Excel 2010 spreadsheet solution referred to above is
embedded below. You can open the spreadsheet “object” by doing the following:
1. Right click anywhere in the worksheet area below.
2. Select “Worksheet Object,” then “Open.”
3. To return to the Word document, select “File” and then “Close and return to…”
while you are in the spreadsheet mode.
Ex. 10–34 7e.xlsx

Chapter 10 – Strategy and the Master Budget
10-34 (Continued-3)
The following web-accessible tutorials regarding the use of Excel 2010 to perform
“What-If analysis” may be helpful:
1.Introduction to What-If Analysis:
http://office.microsoft.com/en-us/excel-help/introduction-to-what-if-analysis-HA010342628.aspx
2. Using Excel to Perform Scenario Analysis:
http://office.microsoft.com/en-us/excel-help/switch-between-various-sets-of-
values-by-using-scenarios-HP010072669.aspx
3. Using Excel to Create Data Tables:
http://office.microsoft.com/en-us/excel-help/calculate-multiple-results-by-using-a-data-table-
HP010342214.aspx
4. Using the Goal Seek Routine in Excel:
http://office.microsoft.com/en-us/excel-help/use-goal-seek-to-find-the-result-you-want-by-adjusting-
an-input-value-HP010342990.aspx
5. Using Solver to Perform What-If Analysis:
http://office.microsoft.com/en-us/excel-help/define-and-solve-a-problem-by-using-solver-
HP010342416.aspx
http://office.microsoft.com/en-us/excel-help/video-use-the-solver-add-in-VA101840549.aspx
10-25
Education.

Chapter 10 – Strategy and the Master Budget
10-35 “What-If” Analysis (25 Minutes)
1. The term “what if” analysis is one example of the more general term “sensitivity
analysis” and is used to explore the effects (e.g., on a decision or a budget for an
upcoming period) of different marketing, production, or selling strategies (e.g., the
effect on revenues of lowering product selling prices, the profit-effect of using a
different sales-promotion plan). That is, a “what-if” analysis examines how a result
will change if the original (baseline) data are not achieved or, as in the present
case, if an underlying assumption (viz., rate of bad debts expense) changes.
2. What-if Analysis
January February March
Credit Sales $100,000 $120,000 $110,000
Estimated Bad Debts Expense
January February March
Assumed rate of B/D
expense:
1% $1,000 $1,200 $1,100
3% $3,000 $3,600 $3,300
5% $5,000 $6,000 $5,500
8% $8,000 $9,600 $8,800
3. Managers today work in a world of uncertainty. One way to cope with uncertainty
in the master budgeting process is to model the underlying relationships
associated with the various budgets that are prepared and then to perform
sensitivity analysis. One form of sensitivity analysis is the “what-if” analysis
described above. For Tyson Company, this type of analysis can help the firm
decide whether it might need to implement a more restrictive credit-granting policy
and, if so, how much it might be willing to spend in this regard.
10-26
Education.
Chapter 10 – Strategy and the Master Budget
10-36 Profit Planning and Sensitivity Analysis (45 minutes)
1. Sales volume in units:
Let “X” = required sales volume. Thus, when total cost at each alternative cost structure
is the same, we have:
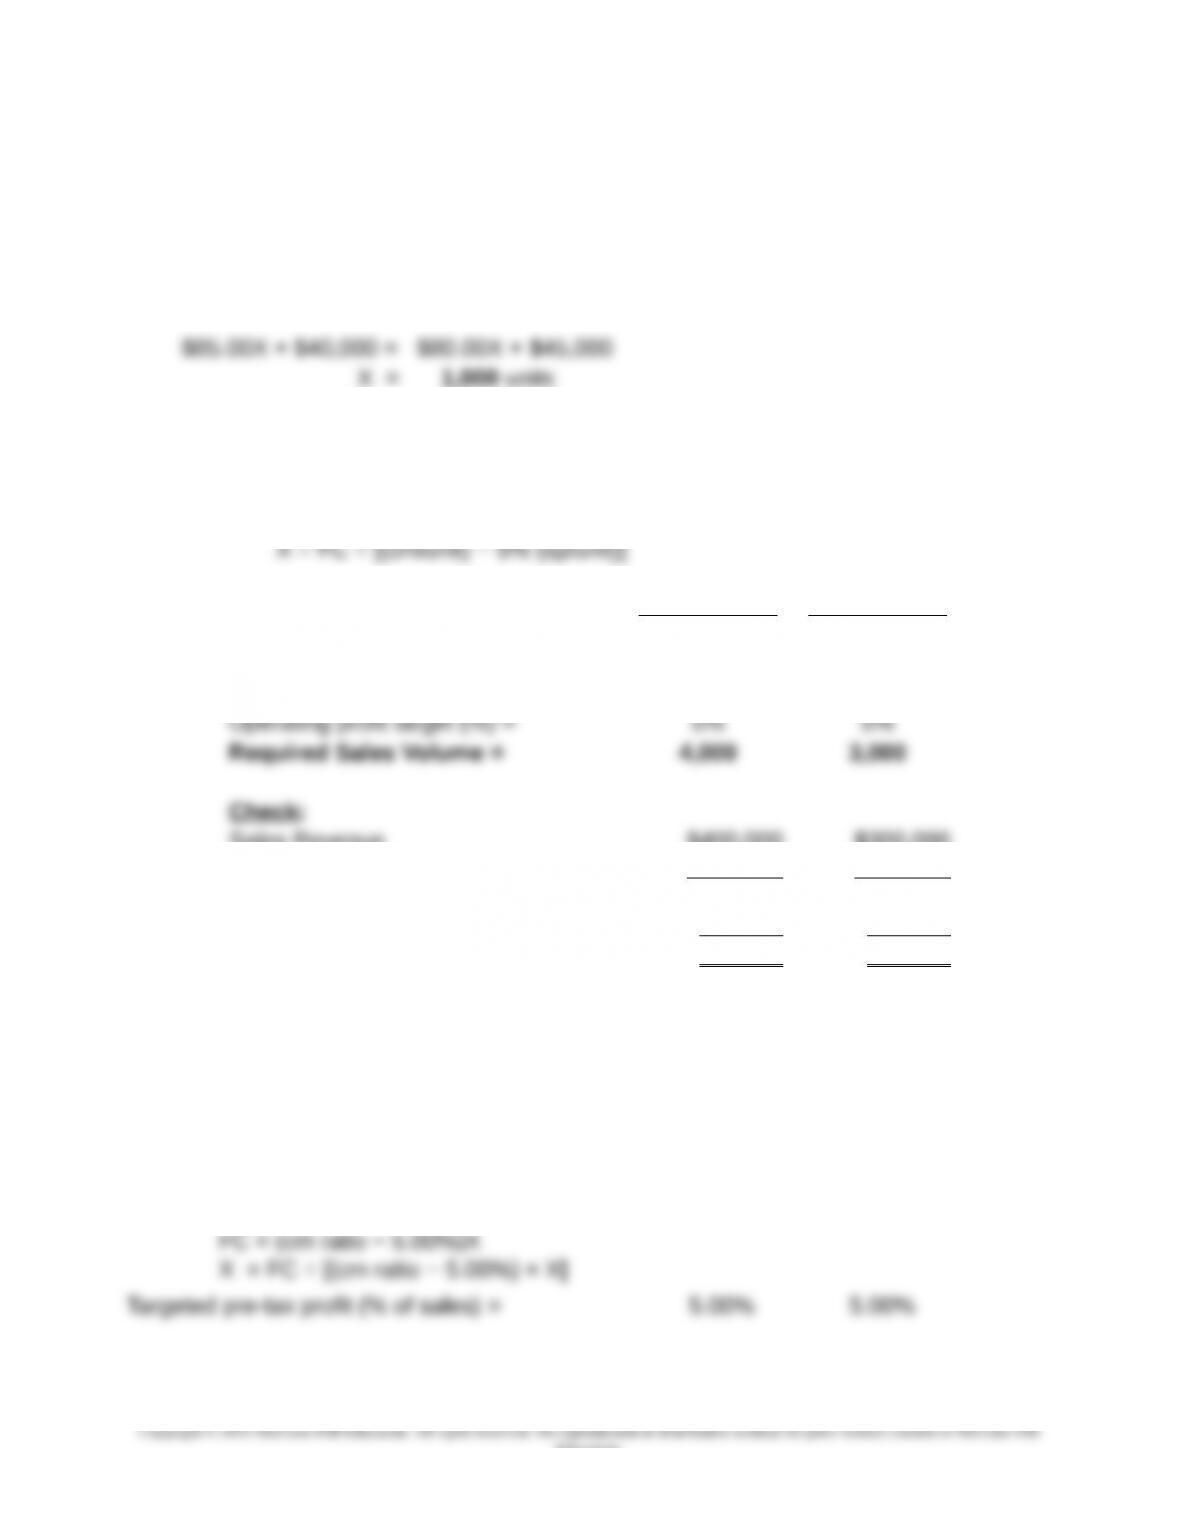
2. Sales level needed:
Pre-tax profit = (cm/unit * X) − FC = 5% (sp/unit * X)
0 = [(cm/unit * X) − 5% (sp/unit * X)] − FC
Alternative 1 Alternative 2
Selling price/unit = $100.00 $100.00
Variable cost/unit = $85.00 $80.00
Contribution margin/unit = $15.00 $20.00
Sales Revenue $400,000 $300,000
Variable Costs $340,000 $240,000
CM $60,000 $60,000
Fixed Costs $40,000 $45,000
Operating Profit $20,000 $15,000
Operating Profit ÷ Sales Revenue 5.00% 5.00%
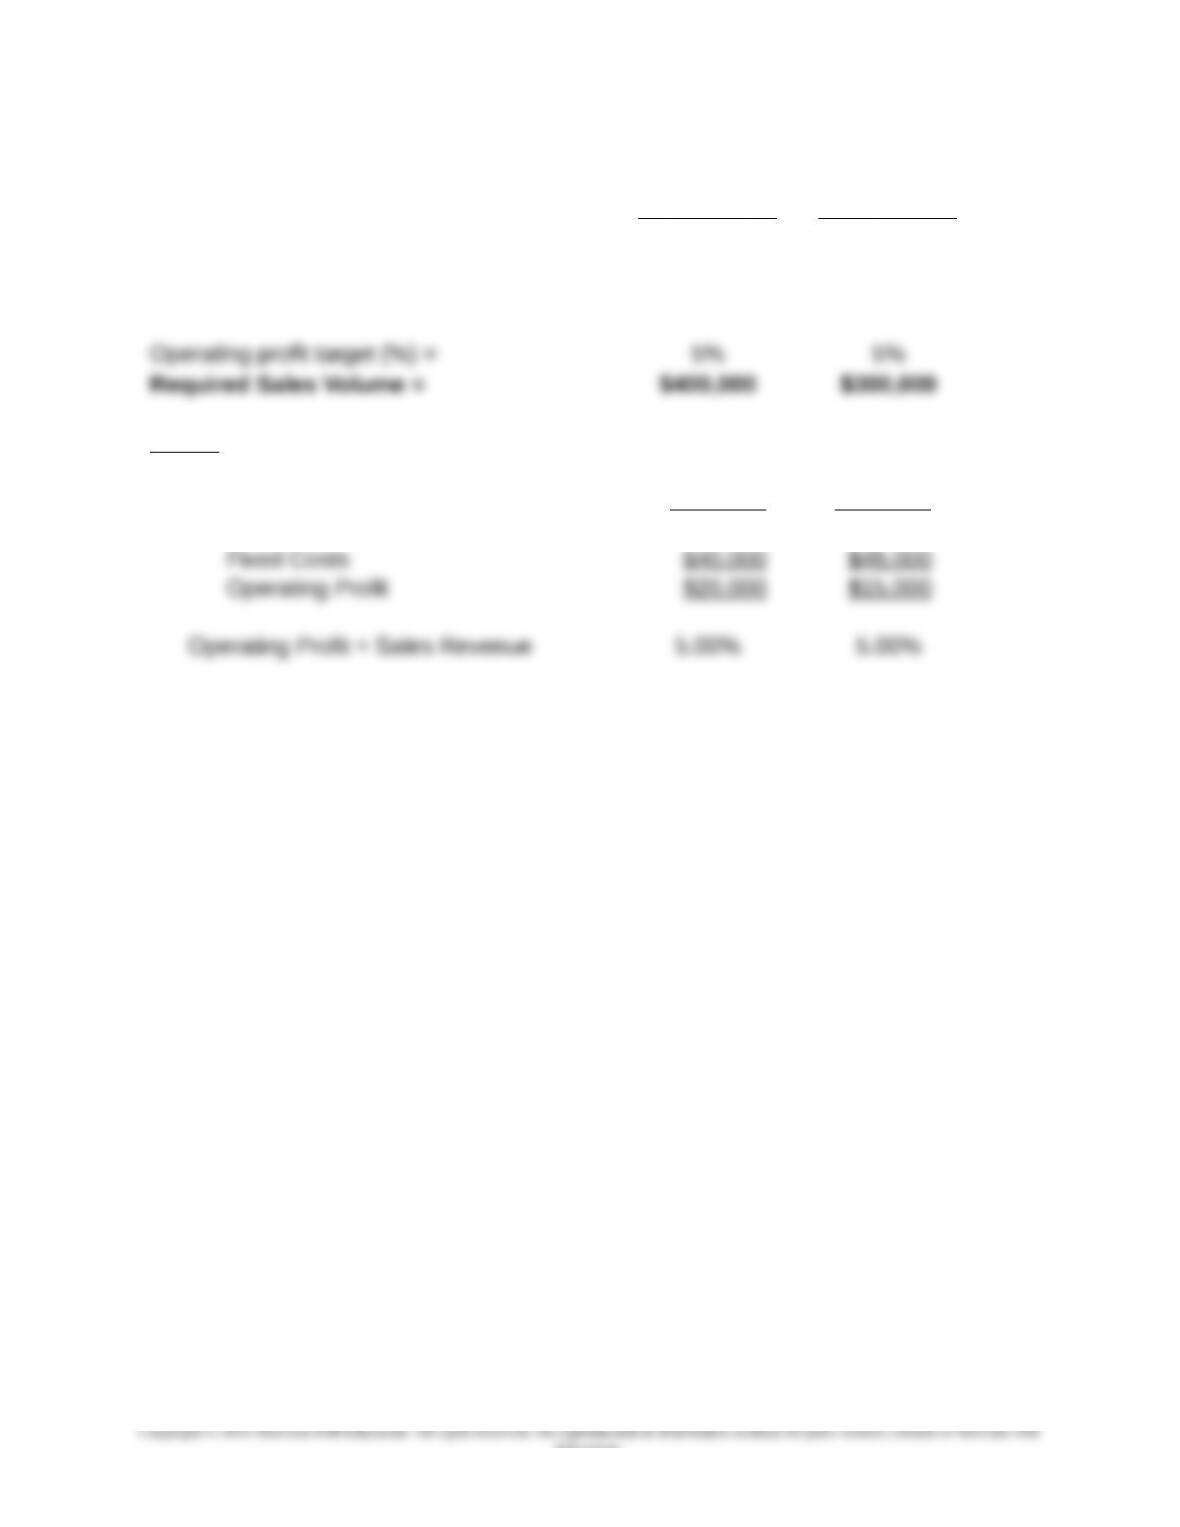
3. Sales volume in dollars needed under each alternative to achieve a profit goal of 5%
on sales.
10-27
Education.
Let X = sales dollars, then:
Pre-tax profit = [(cm ratio) × X] − FC = 5.00%X
FC = (cm ratio × X) − 5.00%X
Chapter 10 – Strategy and the Master Budget
10-36 (Continued)
Alternative 1 Alternative 2
Selling price/unit = $100.00 $100.00
Contribution margin/unit = $15.00 $20.00
Contribution margin ratio = 15.00% 20.00%
Check:
Sales Revenue $400,000 $300,000
Variable Costs $340,000 $240,000
CM $60,000 $60,000
10-28
Education.

10-37 Scenario Analysis (50 minutes)
1. “What-If Analysis,” within the context of budgeting, refers to the process of varying
one or more budget inputs for the purpose of examining the resulting effect on a
variable of interest (e.g., budgeted sales, operating income, or operating cash flows).
Scenario analysis can be viewed as the result of simultaneously changing two or
more inputs and examining the resulting effect on a variable of interest.
The basic version of Excel can perform three kinds of “what-if” analyses: scenarios,
data tables, and Goal Seek. Scenarios and data tables take sets of input values and
determine possible results. A data table works only with one or two variables, but it
can accept many different values for those variables. A scenario can have multiple
variables, but it can accommodate only up to 32 values. Goal Seek works differently
from scenarios and data tables in that it takes a result and determines possible input
values that produce that result. In addition to these three methods, an Excel add-in,
Solver, can be used to perform “what-if” analyses. The Solver add-in is similar to
Goal Seek, but it can accommodate more variables.
See the following tutorials for additional information about performing “what-if”
analyses using Excel 2010:
1. Introduction to What-If Analysis:
http://office.microsoft.com/en-us/excel-help/introduction-to-what-if-analysis-
HA010342628.aspx
2. Using Excel to Perform Scenario Analysis:
http://office.microsoft.com/en-us/excel-help/switch-between-various-sets-of-values-by-
using-scenarios-HP010072669.aspx
3. Using Excel to Create Data Tables:
http://office.microsoft.com/en-us/excel-help/calculate-multiple-results-by-using-a-data-table-
HP010342214.aspx
4. Using the Goal Seek Routine in Excel:
http://office.microsoft.com/en-us/excel-help/use-goal-seek-to-find-the-result-you-want-by-
adjusting-an-input-value-HP010342990.aspx
5. Using Solver to Perform What-If Analysis:
http://office.microsoft.com/en-us/excel-help/define-and-solve-a-problem-by-using-solver-
HP010342416.aspx
http://office.microsoft.com/en-us/excel-help/video-use-the-solver-add-in-VA101840549.aspx
10-29
Education.