Chapter 03 – Demand, Supply, and Market Equilibrium
Chapter 03 – Demand, Supply, and Market Equilibrium
McConnell Brue Flynn 20e
DISCUSSION QUESTIONS
1. Explain the law of demand. Why does a demand curve slope downward? How is a market
demand curve derived from individual demand curves? LO2
Answer: As prices change, buyers will change the quantity they demand of that
Its downward slope reflects the law of demand—people buy more of a product,
By adding the quantities demanded by all consumers at each of the various
2. What are the determinants of demand? What happens to the demand curve when any of these
determinants change? Distinguish between a change in demand and a movement along a fixed
demand curve, noting the cause(s) of each. LO2
Answer: There are determinants of demand, which are factors that may shift the
demand curve, or cause a “change in demand.” These are the number of buyers,
The determinants of demand will cause a shift in the demand curve. If it is
A change in price causes movement along the commodity’s demand curve. This
3. Explain the law of supply. Why does the supply curve slope upward? How is the market supply
curve derived from the supply curves of individual producers? LO3
Answer: As prices rise because of increased demand for a commodity, producers
find it more and more profitable to increase the quantity they offer for sale; that is,
3-1
Copyright © 2015 McGraw-Hill Education. All rights reserved. No reproduction or distribution without the prior written
consent of McGraw-Hill Education.
Chapter 03 – Demand, Supply, and Market Equilibrium
The market supply curve is derived by horizontally adding the individual supply
4. What are the determinants of supply? What happens to the supply curve when any of these
determinants changes? Distinguish between a change in supply and a change in the quantity
supplied, noting the cause(s) of each. LO3
Answer: The non-price determinants of supply are: resource (input) prices,
Anything causing an increase in supply will shift the supply curve to the right. A
As price increases, the quantity supplied increases. An increase in price causes a
5. In 2001 an outbreak of foot-and-mouth disease in Europe led to the burning of millions of
cattle carcasses. What impact do you think this had on the supply of cattle hides, hide prices, the
supply of leather goods, and the price of leather goods? LO5
Answer: The supply of cattle hides was reduced, raising the price of hides.
Because hides were more expensive, it became more costly to produce leather,
reducing the supply and raising the price of leather goods
6. For each stock in the stock market, the number of shares sold daily equals the number of shares
purchased. That is, the quantity of each firm’s shares demanded equals the quantity supplied. So,
if this equality always occurs, why do the prices of stock shares ever change? LO5
Answer: During any given stock trading session, there will be both prospective
buyers and sellers, each willing to buy or sell a certain number of shares
depending on price. If at the current price (e.g. the day’s opening price) the
3-2
Copyright © 2015 McGraw-Hill Education. All rights reserved. No reproduction or distribution without the prior written
consent of McGraw-Hill Education.
Chapter 03 – Demand, Supply, and Market Equilibrium
7. What do economists mean when they say “price floors and ceilings stifle the rationing function
of prices and distort resource allocation”? LO6
Answer: When unrestrained, prices rise and fall to correct imbalances between
the quantity supplied and quantity demanded in a market. If sellers find
themselves at a given price with more output than consumers are willing to
purchase, they will lower the price. Likewise, if the market is not offering enough
8. LAST WORD In some countries, such as France, every corpse is available for doctors to
“harvest” for organs unless the deceased, while still alive, signed a form forbidding the organs to
be harvested. In the USA, it is the opposite: No harvesting is allowed unless the deceased had
signed, while still alive, an organ donor form authorizing doctors to harvest any needed organs.
Use supply and demand figures to show in which country organ shortages are likely to be less
severe.
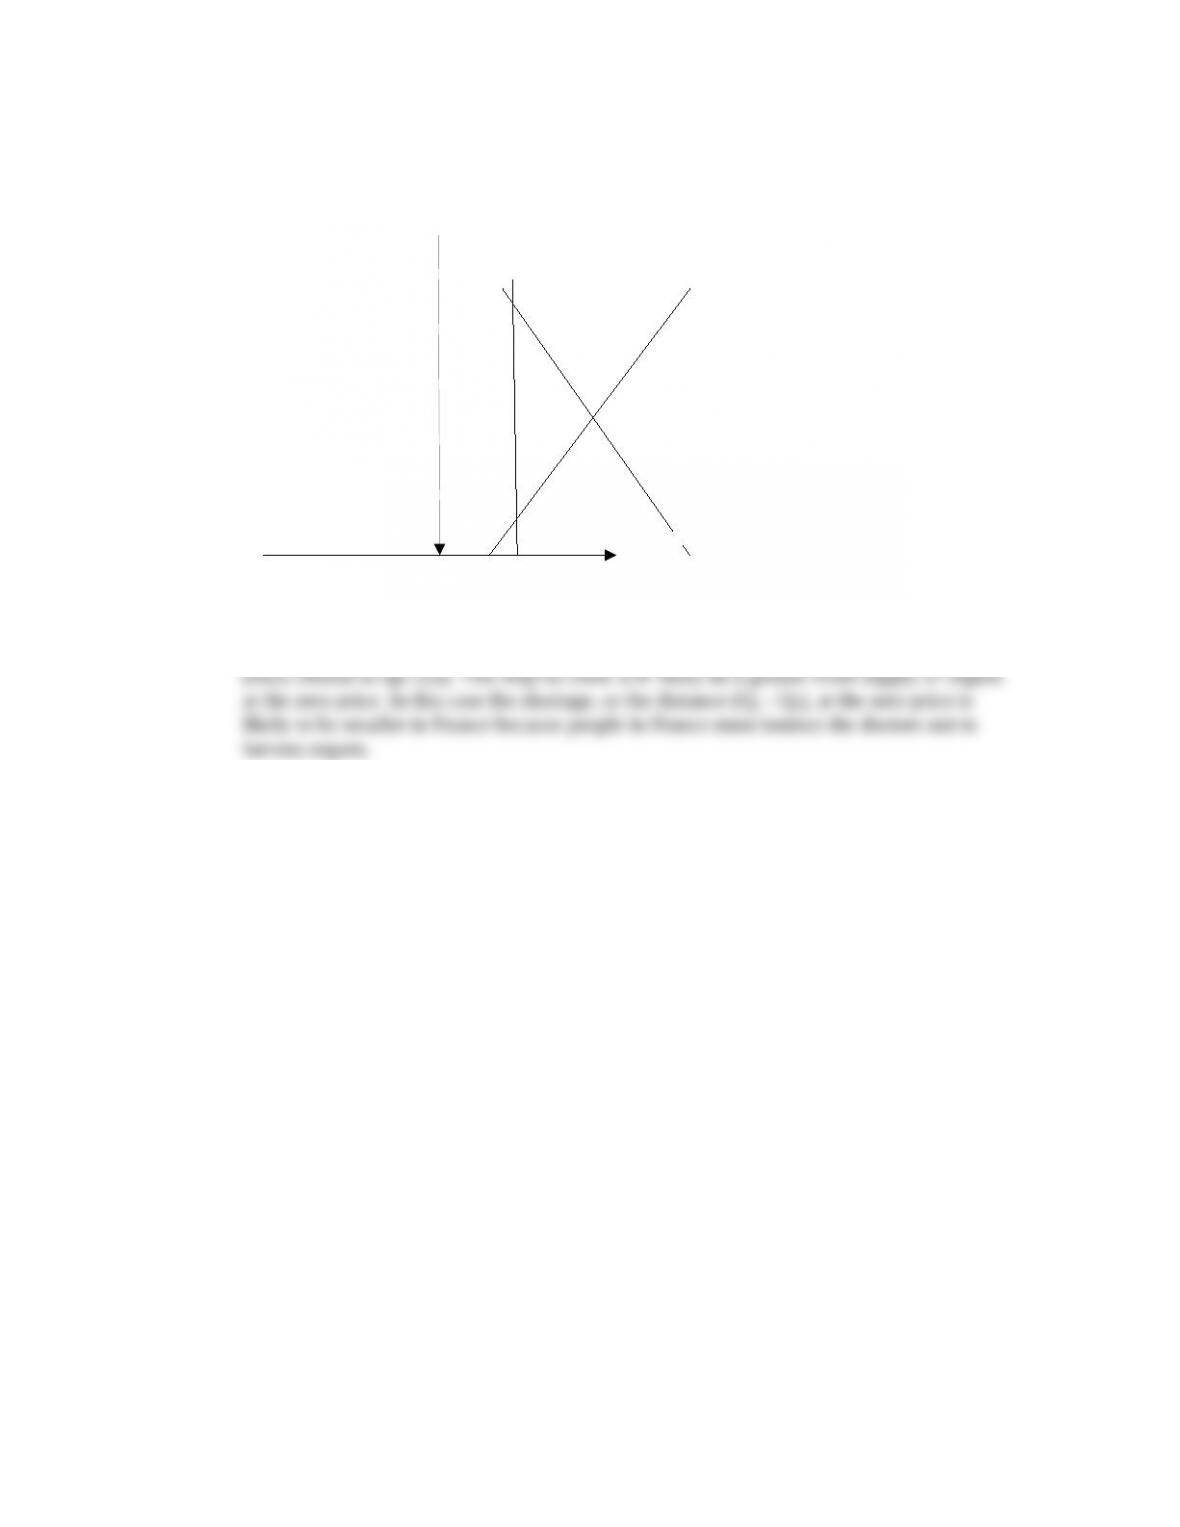
Answer: In France every corpse is available for doctors to “harvest” for organs unless
the person signed a form while he was still alive, forbidding his organs to be harvested.
Graphically, we first look at the U.S. case where individuals must opt into the program of
3-3
Copyright © 2015 McGraw-Hill Education. All rights reserved. No reproduction or distribution without the prior written
consent of McGraw-Hill Education.
Market
Supply
Price for
Organs
Quantity of Organs
Market
Demand
Fixed
Supply
Q3 Q1
Market
Supply
Price for
Organs
Quantity of Organs
Market
Demand
Fixed
Supply
Q3 Q1
Chapter 03 – Demand, Supply, and Market Equilibrium
We can also look at the graph for France. Here the default program is to donate organs
REVIEW QUESTIONS
3-4
Copyright © 2015 McGraw-Hill Education. All rights reserved. No reproduction or distribution without the prior written
consent of McGraw-Hill Education.
Chapter 03 – Demand, Supply, and Market Equilibrium
1. What effect will each of the following have on the demand for small automobiles such
as the Mini-Cooper and Fiat 500? LO2
a. Small automobiles become more fashionable.
b. The price of large automobiles rises (with the price of small autos remaining the same).
c. Income declines and small autos are an inferior good.
d. Consumers anticipate that the price of small autos will greatly come down in the near
future.
e. The price of gasoline substantially drops.
Answer: Demand increases in (a), (b), and (c); decreases in (d). The last one (e) is
ambiguous. As autos and gas are complements, one could argue that the decrease
2. True or False: A “change in quantity demanded” is a shift of the entire demand curve to the
right or to the left. LO2
Answer: False.
Be sure to distinguish properly between a change in quantity demanded and a change in
demand. A change in quantity demanded is a movement from one point to another point
3. What effect will each of the following have on the supply of auto tires? LO3
a. A technological advance in the methods of producing tires.
b. A decline in the number of firms in the tire industry.
c. An increase in the prices of rubber used in the production of tires.
d. The expectation that the equilibrium price of auto tires will be lower in the future than
currently.
e. A decline in the price of the large tires used for semi-trucks and earth-hauling rigs (with no
change in the price of auto tires).
f. The levying of a per-unit tax on each auto tire sold.
g. The granting of a 50-cent-per-unit subsidy for each auto tire produced.
Answer:
a. Supply will increase because the technological advance allows the tire manufacturers
b. Supply will decrease because there are less firms in the industry.
3-5
Copyright © 2015 McGraw-Hill Education. All rights reserved. No reproduction or distribution without the prior written
consent of McGraw-Hill Education.
Chapter 03 – Demand, Supply, and Market Equilibrium
d. Supply will increase because the expectation that the equilibrium price of auto tires
e. Supply will increase because the decline in the price of large tires used for semi trucks
f. Supply will decrease because per-unit tax on each auto tire sold increases the cost of
g. Supply will increase because the 50-cent-per-unit subsidy decreases the cost of
4. Given the following two statements: LO3
A. In the corn market, demand often exceeds supply and supply sometimes exceeds demand.
B. The price of corn rises and falls in response to changes in supply and demand.
In which of these two statements are the terms “supply” and “demand” used correctly?
Answer:
In the first statement, “supply” and “demand” are used incorrectly. Supply and demand
Supply and/or demand can change (the entire curves can shift). Each time this happens,
5. Suppose that in the market for computer memory chips, the equilibrium price is $50 per chip.
If the current price is $55 per chip, then there will be ______________ of memory chips. LO4
a. A shortage.
b. A surplus.
c. An equilibrium quantity.
d. None of the above.
Answer:
A surplus. At the equilibrium price of $50 per chip, the quantity demanded exactly
equals the quantity supplied. At higher prices, the quantity supplied increases while the
3-6
Copyright © 2015 McGraw-Hill Education. All rights reserved. No reproduction or distribution without the prior written
consent of McGraw-Hill Education.
Chapter 03 – Demand, Supply, and Market Equilibrium
6. Critically evaluate: “In comparing the two equilibrium positions in Figure 3.7b , I note that a
smaller amount is actually demanded at a lower price. This refutes the law of demand.” LO5
Answer:
The key point here is that the second equilibrium occurs after demand has decreased, that
is demand has shifted because of a change in determinants, which has caused buyers to
7. Label each of the follow scenarios with the correct combination of price change and
quantity change. In some scenarios, it may not be possible from the information given to
determine the direction of a particular price change or a particular quantity change. We will
symbolize those cases as, respectively, “P?” and “Q?” LO5
P↓ Q?
P↑ Q?
P? Q↓
P? Q↑
a. On a hot day, both the demand for lemonade and the supply of lemonade increase.
b. On a cold day, both the demand for ice cream and the supply of ice cream decrease.
c. When Hawaii’s Mt. Kiluea erupts violently, the demand on the part of tourists for sightseeing
flights increases but the supply of pilots willing to provide these dangerous flights decreases.
d. In a hot area of Arizona where they generate a lot of their electricity with wind turbines, the
demand for electricity falls on windy days as people switch off their air conditioners and enjoy
the breeze. But at the same time, the amount of electricity supplied increases as the wind turbines
spin faster.
Answer:
a. P: ?, Q: increases
The equilibrium quantity will definitely increase as the rightward shifts of both curves
b. P: ?, Q: decreases
With both curves shifting to the left, their intersection will also shift to the left. Thus, the
equilibrium quantity will definitely decline. However, the direction of the price change
c. P: increases, Q: ?
With demand increasing and supply decreasing, the intersection point between the
demand curve and the supply curve will have to be higher. Thus, the equilibrium price
3-7
Copyright © 2015 McGraw-Hill Education. All rights reserved. No reproduction or distribution without the prior written
consent of McGraw-Hill Education.
Chapter 03 – Demand, Supply, and Market Equilibrium
will definitely rise. However, the change in the equilibrium quantity is uncertain. It will
d. P: decreases, Q: ?
With demand falling and supply increasing, the intersection point between the demand
8. Suppose the total demand for wheat and the total supply of wheat per month in the Kansas City
grain market are as shown in the table below. Suppose that the government establishes a price
ceiling of $3.70 for wheat. What might prompt the government to establish this price ceiling?
Explain carefully the main effects. Demonstrate your answer graphically. Next, suppose that the
government establishes a price floor of $4.60 for wheat. What will be the main effects of this
price floor? Demonstrate your answer graphically. LO6
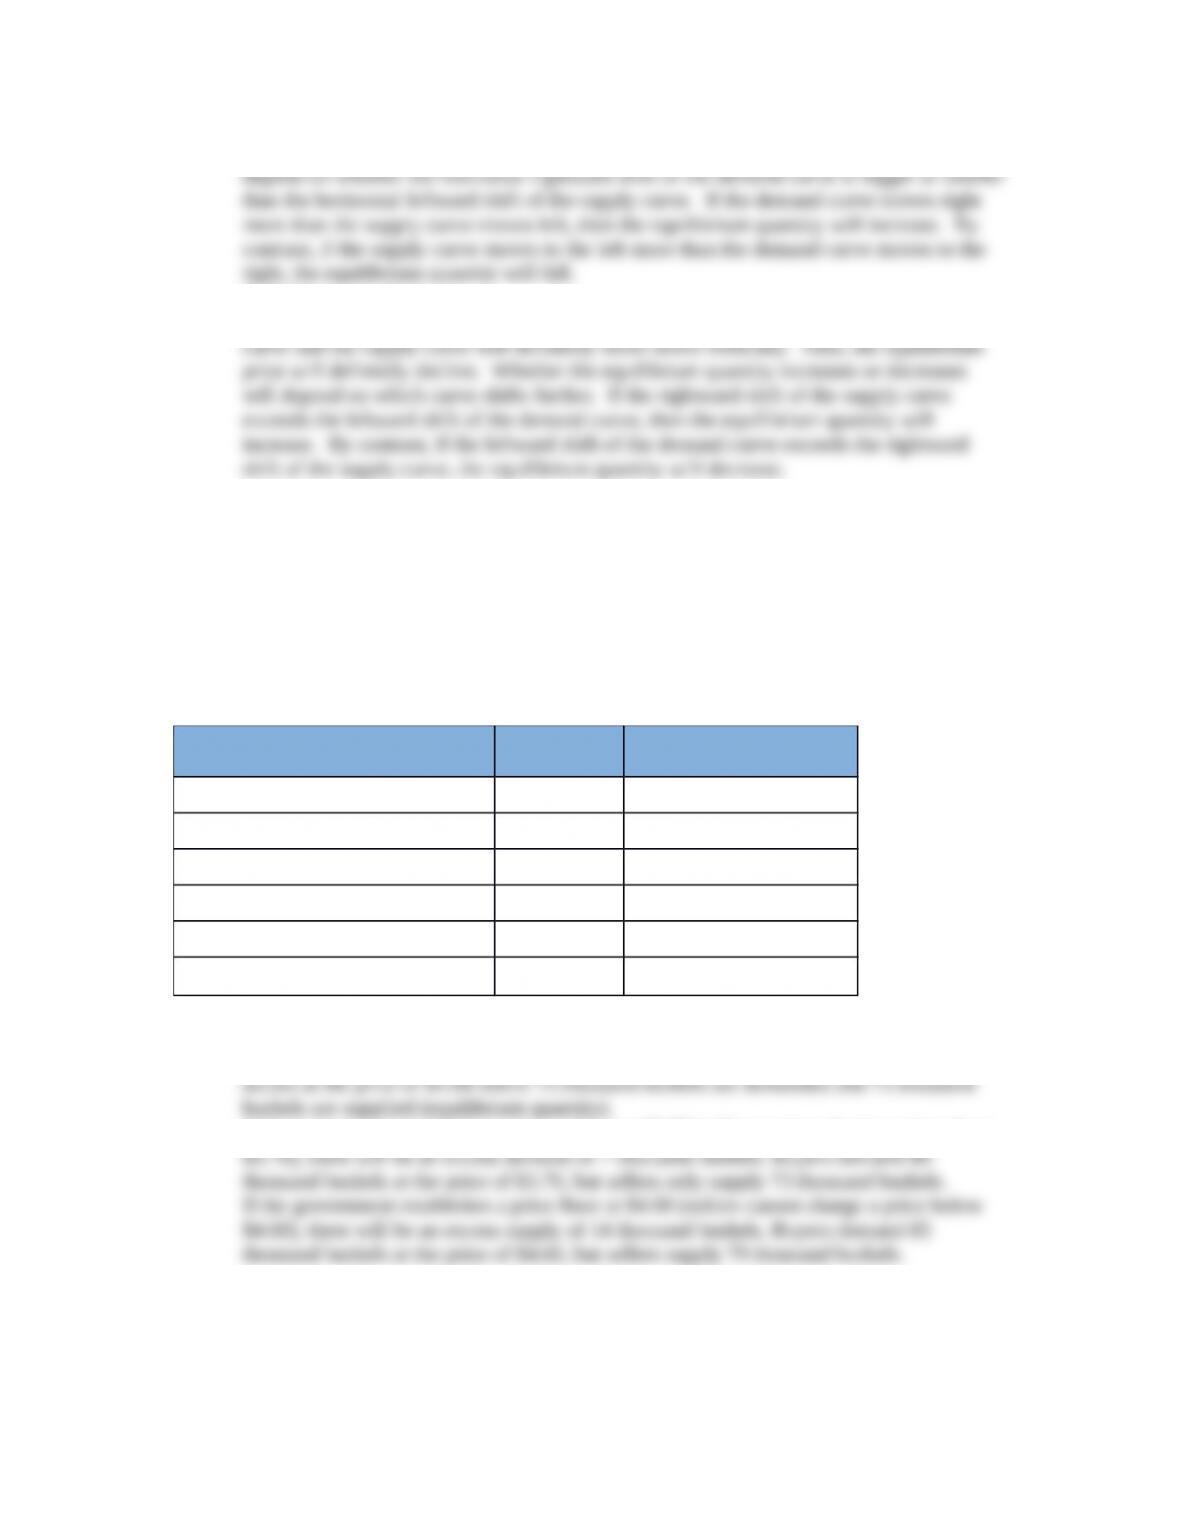
Thousands of Bushels Demanded Price Thousands of Bushels
Supplied
85 $3.40 71
80 $3.70 73
75 $4.00 75
70 $4.30 77
65 $4.60 79
60 $4.90 81
Answer:
The equilibrium price is found where quantity supplied equals quantity demanded. This
If the government establishes a price ceiling at $3.70 (sellers cannot charge a price above
9. A price ceiling will result in a shortage only if the ceiling price is ____________ the
equilibrium price. LO6
a. less than
b. equal to
3-8
Copyright © 2015 McGraw-Hill Education. All rights reserved. No reproduction or distribution without the prior written
consent of McGraw-Hill Education.
Chapter 03 – Demand, Supply, and Market Equilibrium
c. greater than
d. louder than
Answer: Less than.
If the ceiling price is set at a value below the equilibrium price, then a shortage will result
because quantity demanded will exceed quantity supplied. By contrast, if the ceiling
PROBLEMS
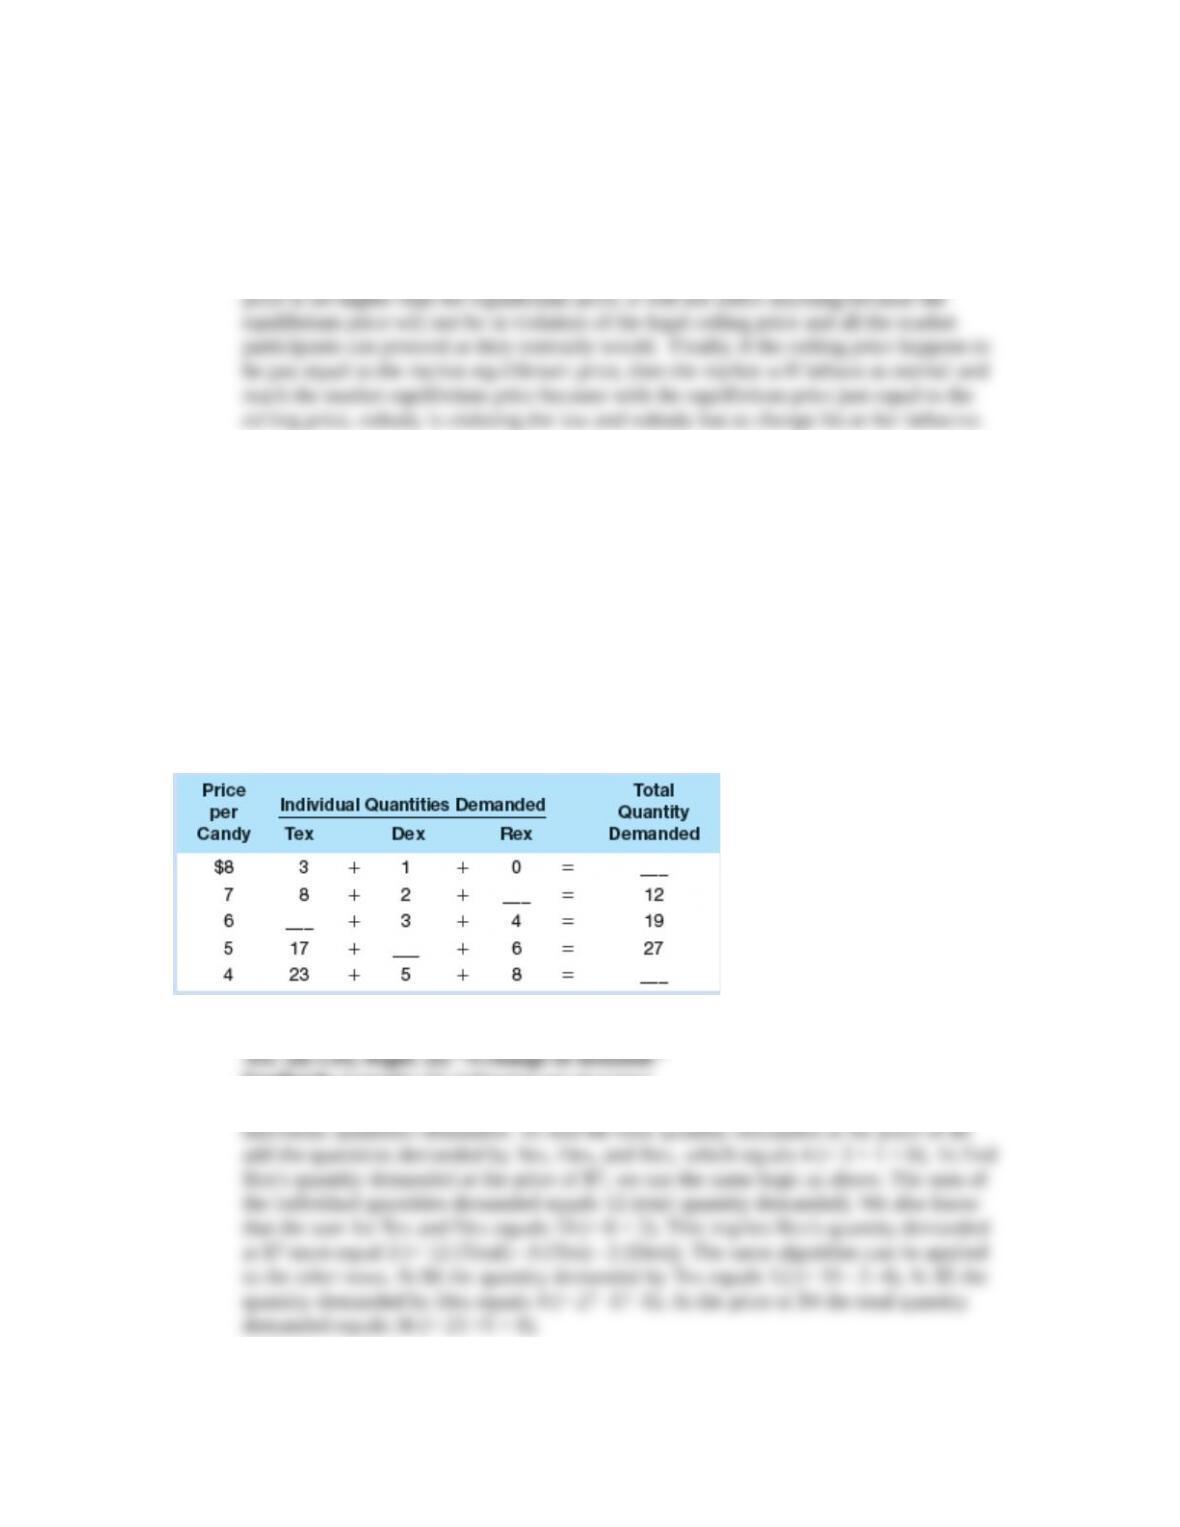
1. Suppose there are three buyers of candy in a market: Tex, Dex, and Rex. The market demand
and the individual demands of Tex, Dex, and Rex for candy are given in the table below. LO2
a. Fill in the table for the missing values.
b. Which buyer demands the least at a price of $5? The most at a price of $7?
c. Which buyer’s quantity demanded increases the most when the price is lowered from $7 to $6?
d. Which direction would the market demand curve shift if Tex withdrew from the market? What
if Dex doubled his purchases at each possible price?
e. Suppose that at a price of $6, the total quantity demanded increases from 19 to 38. Is this a
“change in the quantity demanded” or a “change in demand”?
Answers: (a) Row 1: 4; Row 2: 2; Row 3: 12; Row 4:4; Row 5: 36. (b) Dex, Tex. (c)
Feedback: Consider the following set of values:
Part a: At each price (row) the total quantity demanded will equal the sum of the
3-9
Copyright © 2015 McGraw-Hill Education. All rights reserved. No reproduction or distribution without the prior written
consent of McGraw-Hill Education.
Chapter 03 – Demand, Supply, and Market Equilibrium
Part b: At a price of $5 Dex demands the least amount of goods, which equals 4. Tex
demands 17, and Rex demands 6. At a price of $7 Tex demands the most amount of
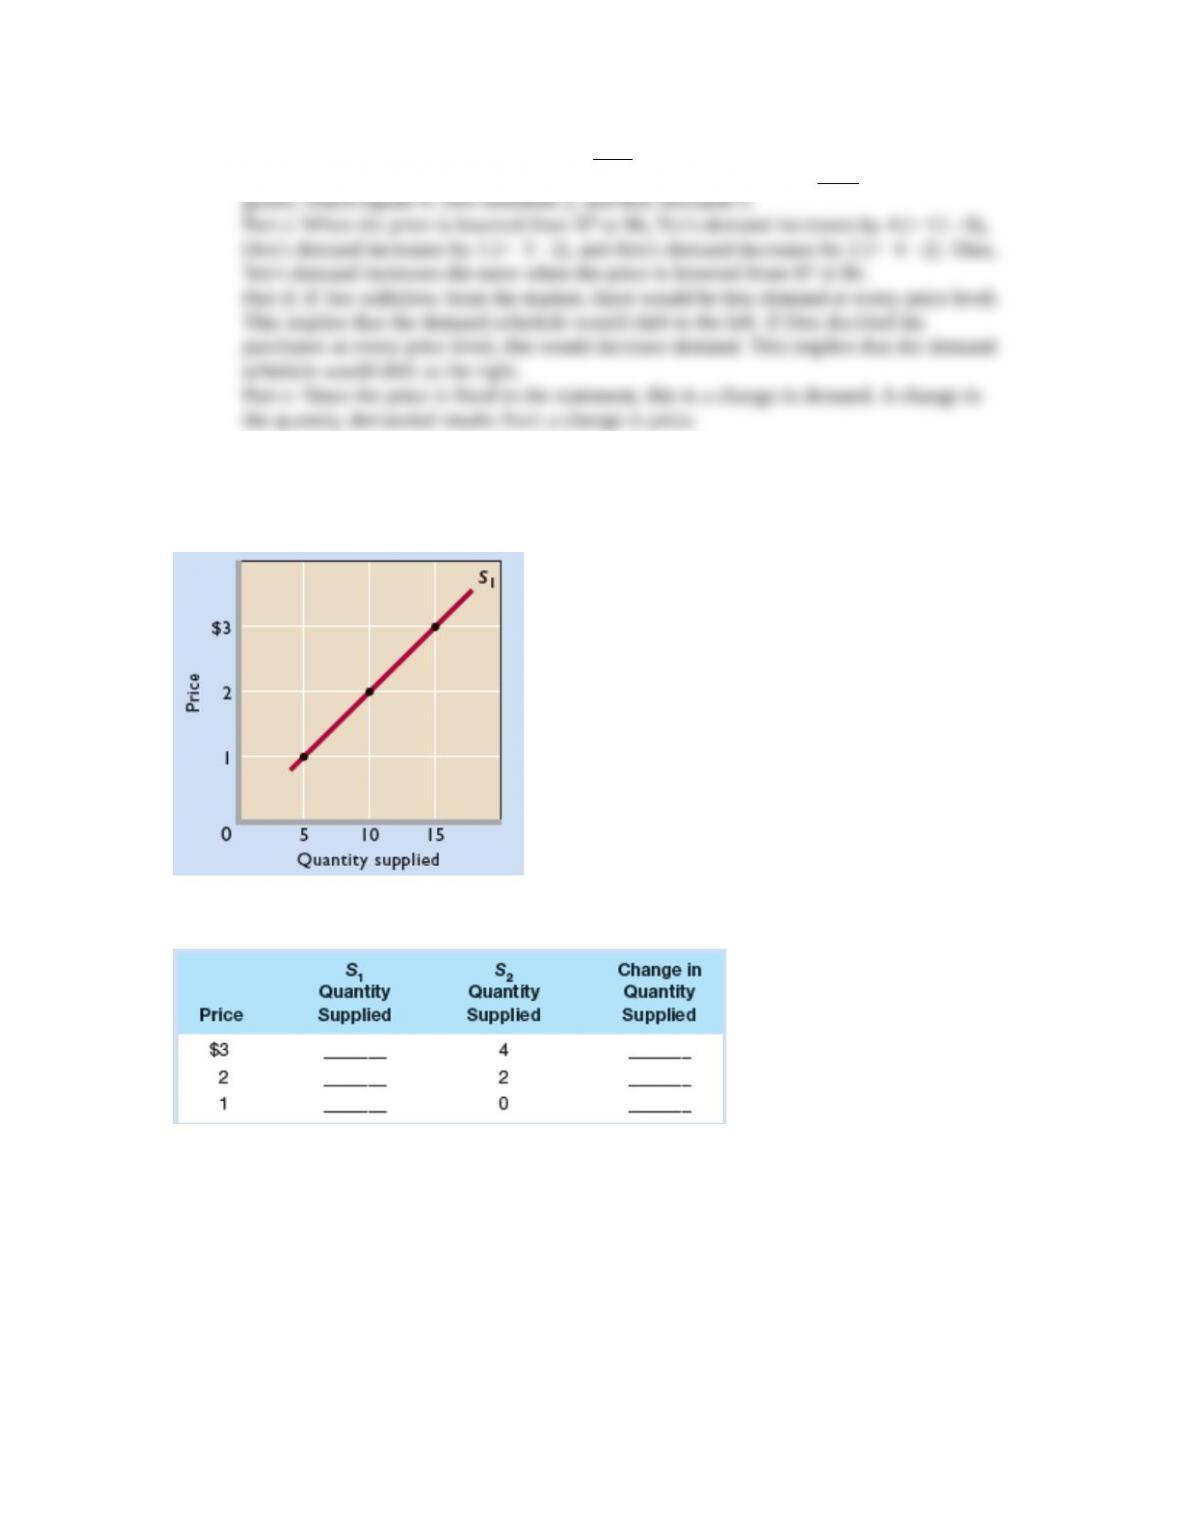
2. The figure below shows the supply curve for tennis balls, S1, for Drop Volley tennis, a producer
of tennis equipment. Use the figure and the table below to give your answers to the following
questions. LO3
a. Use the figure to fill in the quantity supplied on supply curve S1 for each price in the table
below.
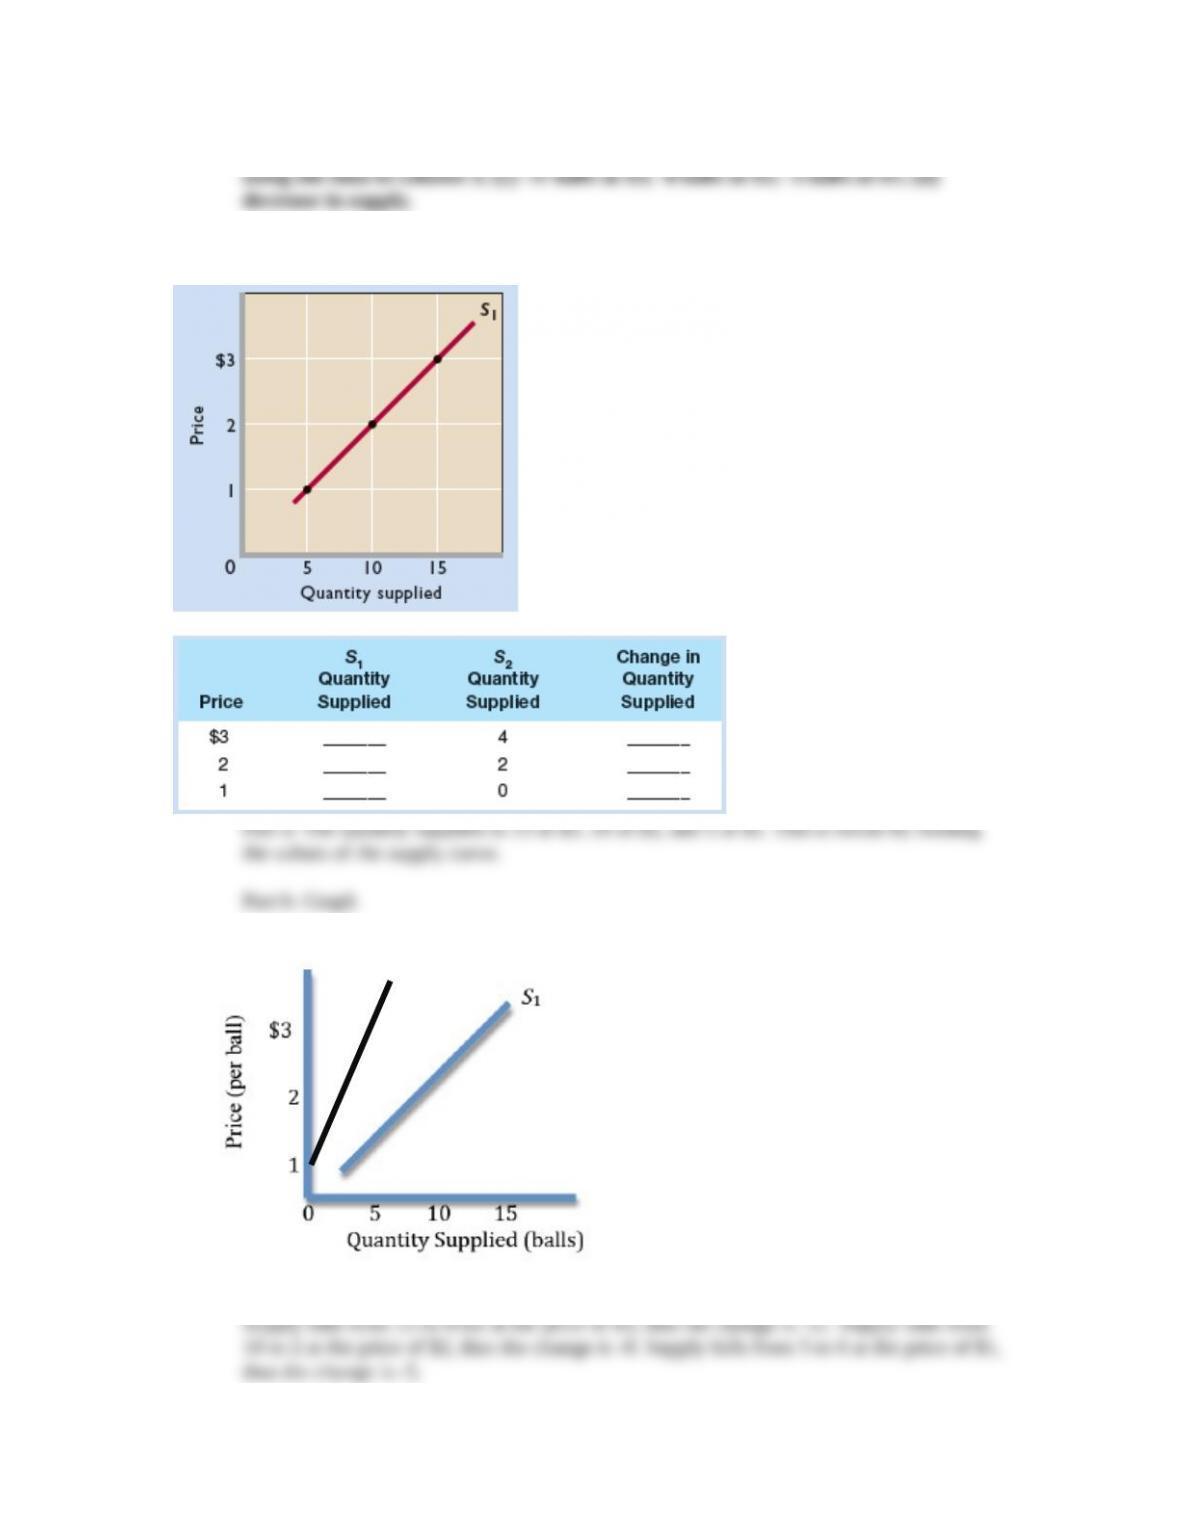
b. If production costs were to increase, the quantities supplied at each price would be as shown by
the third column of the table (“S2 Quantity Supplied”). Use that data to draw supply curve S2 on
the same graph as supply curve S1.
c. In the fourth column of the table, enter the amount by which the quantity supplied at each price
changes due to the increase in product costs. (Use positive numbers for increases and negative
numbers for decreases.)
d. Did the increase in production costs cause a “decrease in supply” or a “decrease in quantity
supplied”?
3-10
Copyright © 2015 McGraw-Hill Education. All rights reserved. No reproduction or distribution without the prior written
consent of McGraw-Hill Education.
Chapter 03 – Demand, Supply, and Market Equilibrium
Answers: (a) 15 balls at $3; 10 balls at $2, 5 balls at $1; (b) Draw in supply curve S2
Feedback: Consider the following figure and values.
Part c: The increase in production costs cause supply to decrease at each price level.
3-11
Copyright © 2015 McGraw-Hill Education. All rights reserved. No reproduction or distribution without the prior written
consent of McGraw-Hill Education.
S2

Chapter 03 – Demand, Supply, and Market Equilibrium
3-12
Copyright © 2015 McGraw-Hill Education. All rights reserved. No reproduction or distribution without the prior written
consent of McGraw-Hill Education.