Chapter 13 – Fiscal Policy, Deficits, and Debt
REVIEW QUESTIONS
1. Which of the following would help a government reduce an inflationary output gap? LO1
a. Raising taxes.
b. Lowering taxes.
c. Increasing government spending.
d. Decreasing government spending.
Feedback: Raising taxes and decreasing government spending are the correct answers
because each of them helps to reduce aggregate demand. Consider raising taxes: When
2. The economy is in a recession. A congresswoman suggests increasing spending to stimulate
aggregate demand but also at the same time raising taxes to pay for the increased spending. Her
suggestion to combine higher government expenditures with higher taxes is: LO1
a. The worst possible combination of tax and expenditure changes.
b. The best possible combination of tax and expenditure changes.
c. A mediocre and contradictory combination of tax and expenditure changes.
d. None of the above.
Feedback: The Congresswoman’s suggestion to increase spending but at the same time
The problem is that the two policies contradict each other. This is true because increasing
3. During the recession of 2007–2009, the U.S. federal government’s tax collections fell from
about $2.6 trillion down to about $2.1 trillion while GDP declined by about 4 percent. Does the
U.S. tax system appear to have built-in stabilizers? LO2
a. Yes.
13-1
Copyright © 2015 McGraw-Hill Education. All rights reserved. No reproduction or distribution without the prior written
consent of McGraw-Hill Education.
Chapter 13 – Fiscal Policy, Deficits, and Debt
b. No.
Feedback: The U.S. tax system does appear to have built-in stabilizers. In particular, it
appears to have a tax system that collects more money when the economy is doing well
4. Last year, while an economy was in a recession, government spending was $595 billion and
government revenue was $505 billion. Economists estimate that if the economy had been at its
full-employment level of GDP last year, government spending would have been $555 billion and
government revenue would have been $550 billion. Which of the following statements about this
government’s fiscal situation are true? LO3
a. The government has a non–cyclically adjusted budget deficit of $595 billion.
b. The government has a non–cyclically adjusted budget deficit of $90 billion.
c. The government has a non–cyclically adjusted budget surplus of $90 billion.
d. The government has a cyclically adjusted budget deficit of $555 billion.
e. The government has a cyclically adjusted budget deficit of $5 billion.
f. The government has a cyclically adjusted budget surplus of $5 billion.
Answer: c. The government has a non-cyclically adjusted budget deficit of $90 billion; e.
Feedback: The two correct answers are that the government has a non-cyclically
5. Label each of the following scenarios in which there are problems enacting and applying fiscal
policy as being an example of either recognition lag, administrative lag, or operational lag. LO5
a. To fight a recession, Congress has passed a bill to increase infrastructure spending—but the
legally required environmental-impact statement for each new project will take at least two years
to complete before any building can begin.
b. Distracted by a war that is going badly, inflation reaches 8 percent before politicians take
notice.
c. A sudden recession is recognized by politicians, but it takes many months of political deal
making before a stimulus bill is finally approved.
d. To fight a recession, the president orders federal agencies to get rid of petty regulations that
burden private businesses—but the federal agencies begin by spending a year developing a set of
regulations on how to remove petty regulations.
Answers: a. Operational lag: The two-year long process to complete environmental-
impact statements is an example of an operational lag because even after the stimulus
13-2
Copyright © 2015 McGraw-Hill Education. All rights reserved. No reproduction or distribution without the prior written
consent of McGraw-Hill Education.
Chapter 13 – Fiscal Policy, Deficits, and Debt
and a policy decision is reached. d. Operational lag: The delay caused by the bureaucrats
6. In January, the interest rate is 5 percent and firms borrow $50 billion per month for investment
projects. In February, the federal government doubles its monthly borrowing from $25 billion to
$50 billion. That drives the interest rate up to 7 percent. As a result, firms cut back their
borrowing to only $30 billion per month. Which of the following is true? LO6
a. There is no crowding-out effect because the government’s increase in borrowing exceeds firm’s
decrease in borrowing.
b. There is a crowding-out effect of $20 billion.
c. There is no crowding-out effect because both the government and firms are still borrowing a
lot.
d. There is a crowding-out effect of $25 billion.
Feedback: There is a crowding-out effect of $20 billion: A crowding-out effect occurs
when increased government borrowing drives up interest rates and thereby reduces
investment by firms. That is precisely what happens in this scenario, where the
PROBLEMS
1. Assume that a hypothetical economy with an MPC of .8 is experiencing severe recession. By
how much would government spending have to rise to shift the aggregate demand curve
rightward by $25 billion? How large a tax cut would be needed to achieve the same increase in
aggregate demand? Determine one possible combination of government spending increases and
tax increases that would accomplish the same goal without changing the amount of outstanding
debt. LO1
13-3
Copyright © 2015 McGraw-Hill Education. All rights reserved. No reproduction or distribution without the prior written
consent of McGraw-Hill Education.
Chapter 13 – Fiscal Policy, Deficits, and Debt
Answers: $5 billion; 6.25 billion; Combining the two effects above, we have an increase
Feedback: Part 1: The first step is to find the expenditure multiplier.
relationship.
Δ AD = expenditure multiplier x Δ government spending
rearranging,
Δ government spending = Δ AD/expenditure multiplier
Part 2: The first step is to calculate the tax multiplier. Here we need to recognize that a
tax cut will need to move through consumption before impacting the economy. Therefore
we need to multiply the tax cut by the MPC before applying the multiplier process.
Note that the tax multiplier is negative because changes in taxes and aggregate demand
(and aggregate expenditures) are inversely related.
The second step is to find the change in taxes required to shift the aggregate demand
schedule rightward by $25 billion. Here we use the following relationship.
Δ AD = tax multiplier x Δ taxes
rearranging,
Δ taxes = Δ AD/tax multiplier
Part 3: To answer this question we want to use the balanced budget multiplier concept.
First, we increase government spending by $25 billion. This results in an increase in
2. Refer back to the table in Figure 30.7 in the previous chapter. Suppose that aggregate demand
increases such that the amount of real output demanded rises by $7 billion at each price level. By
what percent will the price level increase? Will this inflation be demand-pull inflation or will it be
cost-push inflation? If potential real GDP (that is, full-employment GDP) is $510 billion, what
will be the size of the positive GDP gap after the change in aggregate demand? If government
wants to use fiscal policy to counter the resulting inflation without changing tax rates, would it
increase government spending or decrease it? LO1
Answers: increase by 8 percent; demand-pull inflation; $3 billion; decrease government
spending.
Feedback:
Real Output
Demanded
Real Output
Demanded (NEW)
Price Level Real Output
Supplied
13-4
Copyright © 2015 McGraw-Hill Education. All rights reserved. No reproduction or distribution without the prior written
consent of McGraw-Hill Education.
Chapter 13 – Fiscal Policy, Deficits, and Debt
(ORIGINAL)
$506 $513 108 $513
After the increase in real output demanded by $7 billion at each price level we see that
the new equilibrium is $513 billion (quantity demanded equals quantity supplied) at the
price level 108.
Since this inflation is the result of an increase in aggregate demand this is demand-pull
inflation.
billion).
If government wants to use fiscal policy to counter this inflation without changing tax
rates, it would decrease government spending.
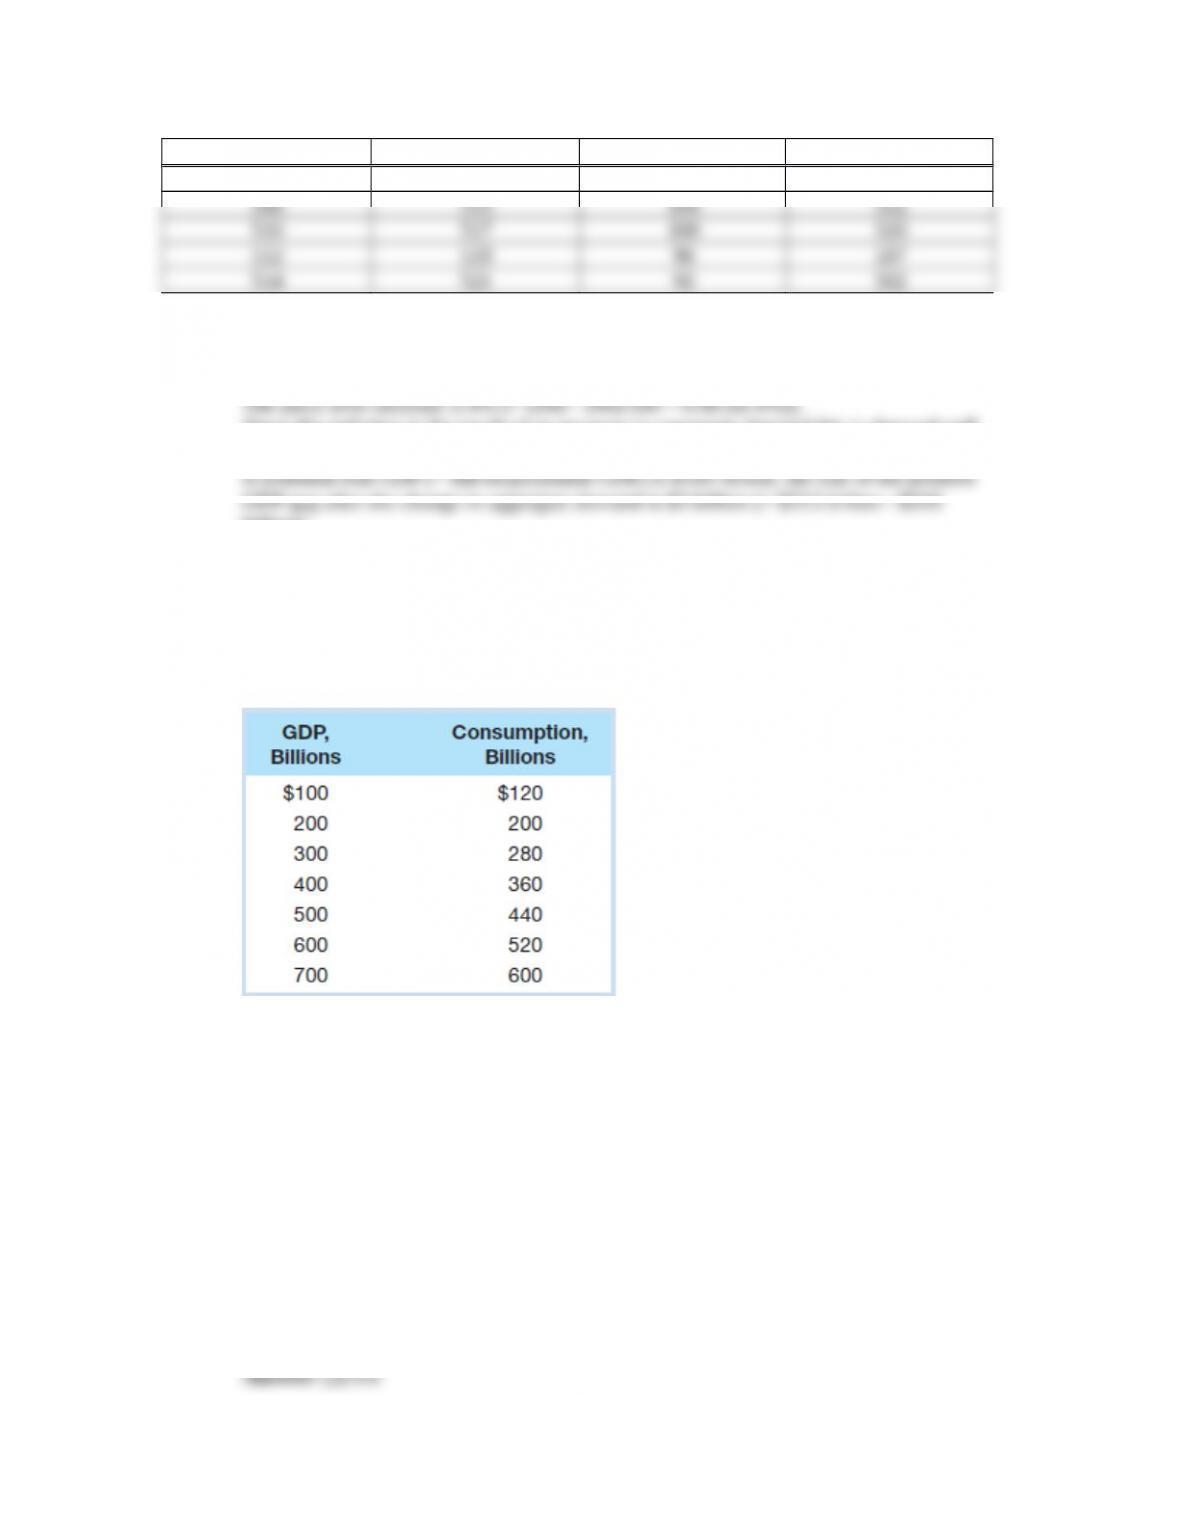
3. (For students who were assigned Chapter 29) Assume that, without taxes, the consumption
schedule for an economy is as shown below: LO1
a. Graph this consumption schedule. What is the size of the MPC?
b. Assume that a lump-sum (regressive) tax of $10 billion is imposed at all levels of GDP.
Calculate the tax rate at each level of GDP. Graph the resulting consumption schedule and
compare the MPC and the multiplier with those of the pretax consumption schedule.
c. Now suppose a proportional tax with a 10 percent tax rate is imposed instead of the regressive
tax. Calculate and graph the new consumption schedule and note the MPC (tax inclusive) and the
multiplier.
d. Finally, impose a progressive tax such that the tax rate is 0 percent when GDP is $100, 5
percent at $200, 10 percent at $300, 15 percent at $400, and so forth. Determine and graph the
new consumption schedule, noting the effect of this tax system on the MPC (tax inclusive) and
the multiplier.
e. Use a graph similar to Figure 30.3 to show why proportional and progressive taxes contribute
to greater economic stability, while a regressive tax does not.
13-5
Copyright © 2015 McGraw-Hill Education. All rights reserved. No reproduction or distribution without the prior written
consent of McGraw-Hill Education.
Chapter 13 – Fiscal Policy, Deficits, and Debt
same
different
Feedback:
Part a:
The MPC =
(
$200−$120
)
billion/
(
$200−$100
)
billion =80/100=0 .8
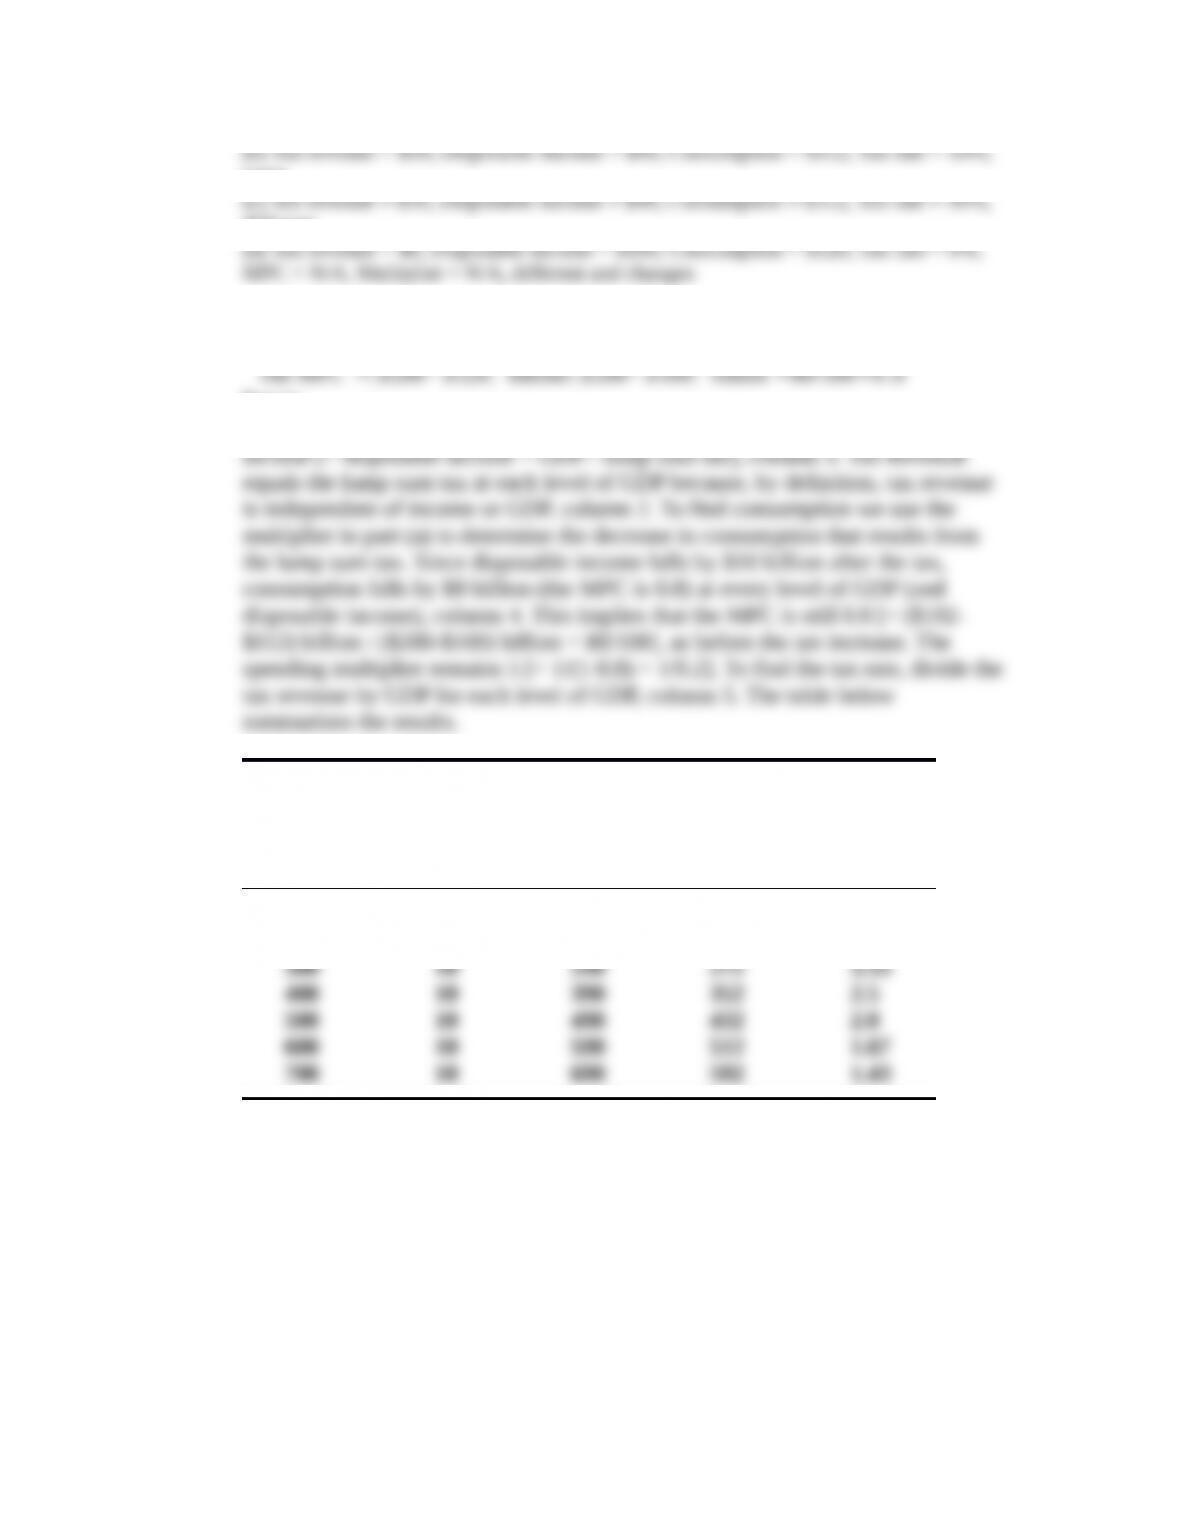
Part b:
The lump tax of $10 billion is subtracted from GDP to determine disposable
GDP,
billions
Tax,
billions
DI,
billions
Consumptio
n
after tax
Tax rate,
percent
billions
$100
200
$10
10
$ 90
190
$112
192
10%
5.0
13-6
Copyright © 2015 McGraw-Hill Education. All rights reserved. No reproduction or distribution without the prior written
consent of McGraw-Hill Education.
Chapter 13 – Fiscal Policy, Deficits, and Debt
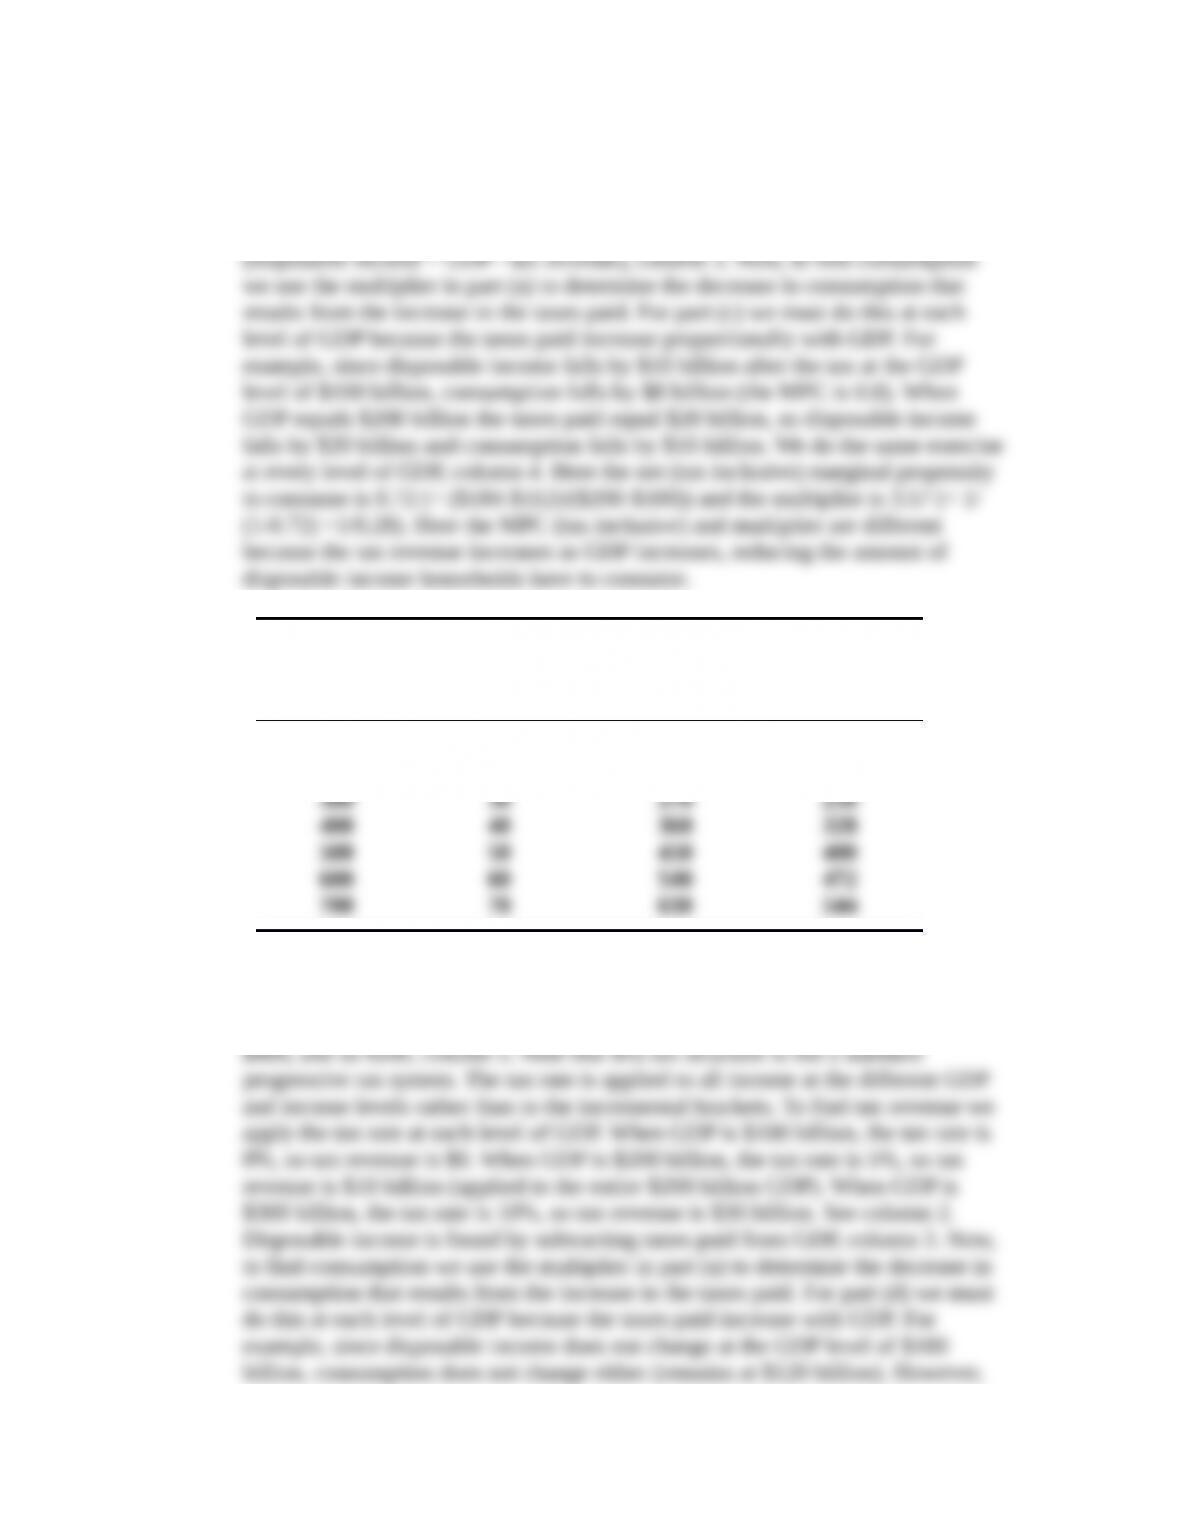
Part c:
With the 10% tax rate we find the tax revenue by taking 10% of GDP, column 2.
We then find disposable income by subtracting the tax revenue from GDP
GDP,
billions
Tax,
billions
DIs
billions
Consumption
after tax,
billions
$100
200
$10
20
$90
180
$112
184
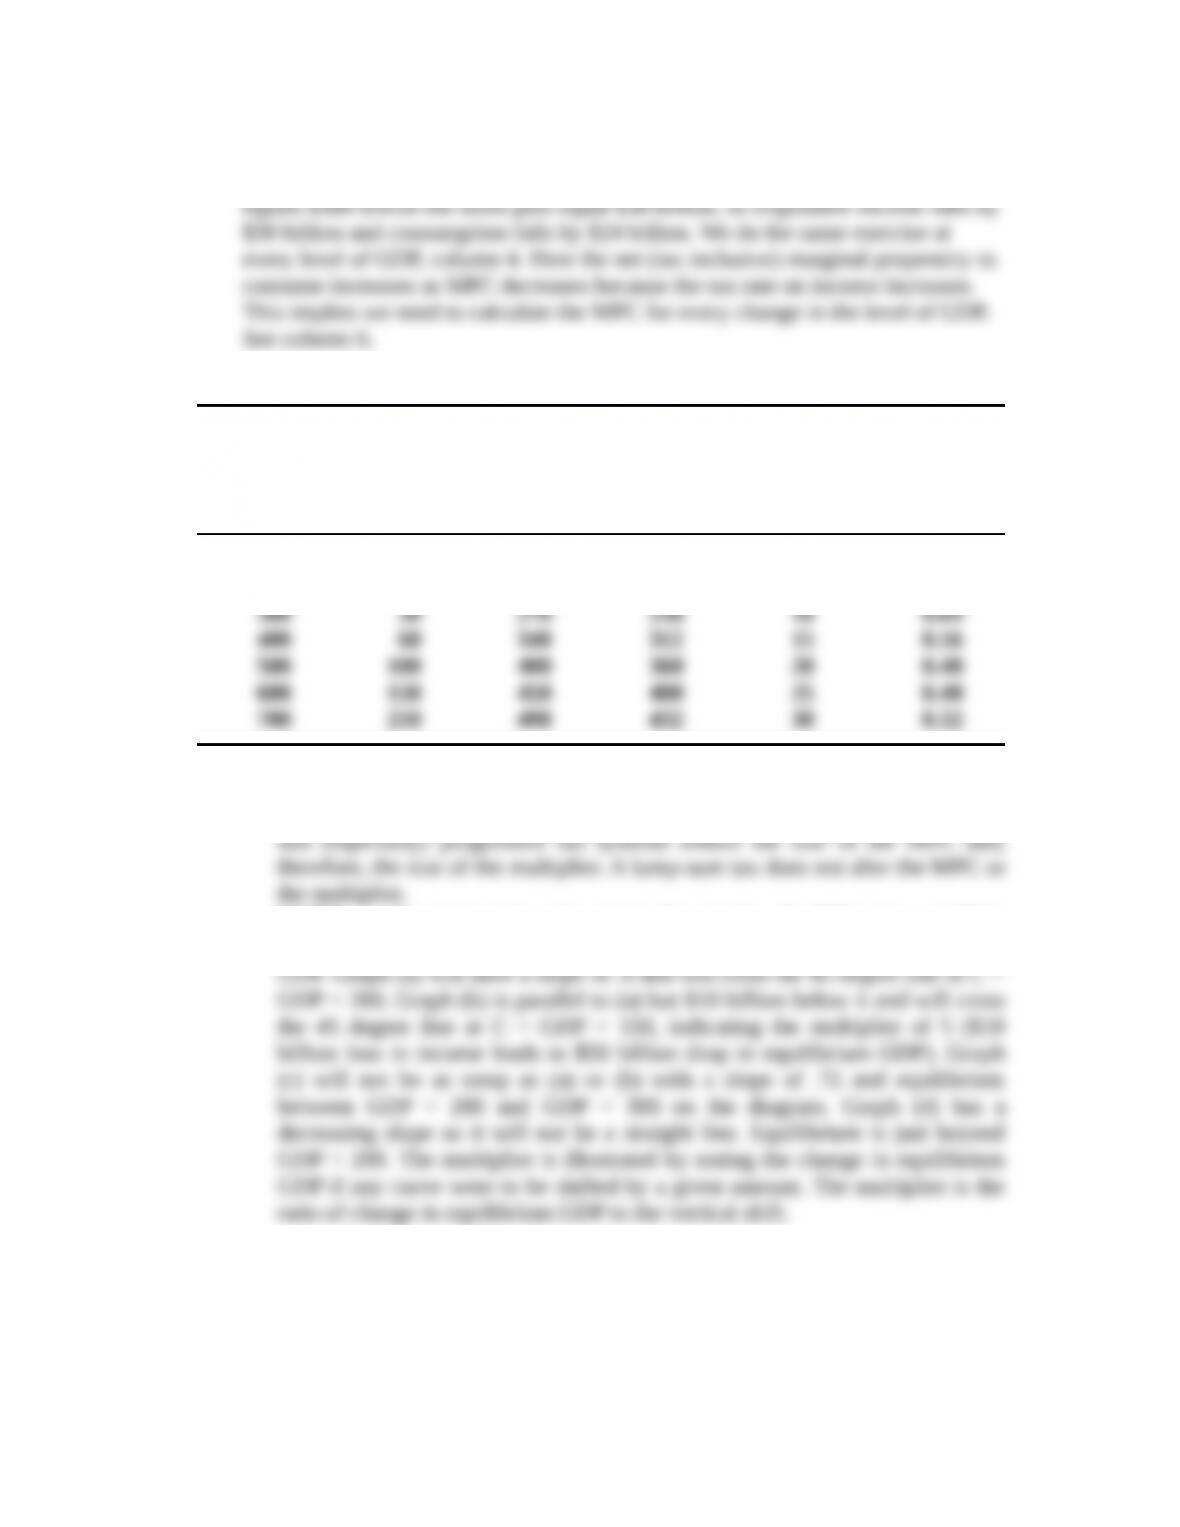
Part d:
For this part of the problem we impose a progressive tax such that the tax rate is 0
percent when GDP is $100, 5 percent at $200, 10 percent at $300, 15 percent at
13-7
Copyright © 2015 McGraw-Hill Education. All rights reserved. No reproduction or distribution without the prior written
consent of McGraw-Hill Education.
Chapter 13 – Fiscal Policy, Deficits, and Debt
when GDP equals $200 billion the taxes paid equal $10 billion, so disposable
income falls by $10 billion and consumption falls by $8 billion. When GDP
GDP
billions
Tax,
billions
DI,
billions
Consumptio
n
after tax
Tax rate,
percent
billions MPC
$100
200
$ 0
10
$100
190
$120
192
0%
5
0.72
Part e:
The MPC decreases as shown in the right-hand column above. Proportional
NOTE: For instructors who assign the graphs, the following would be
true. For each graph (a) through (d), plot the consumption schedule against the
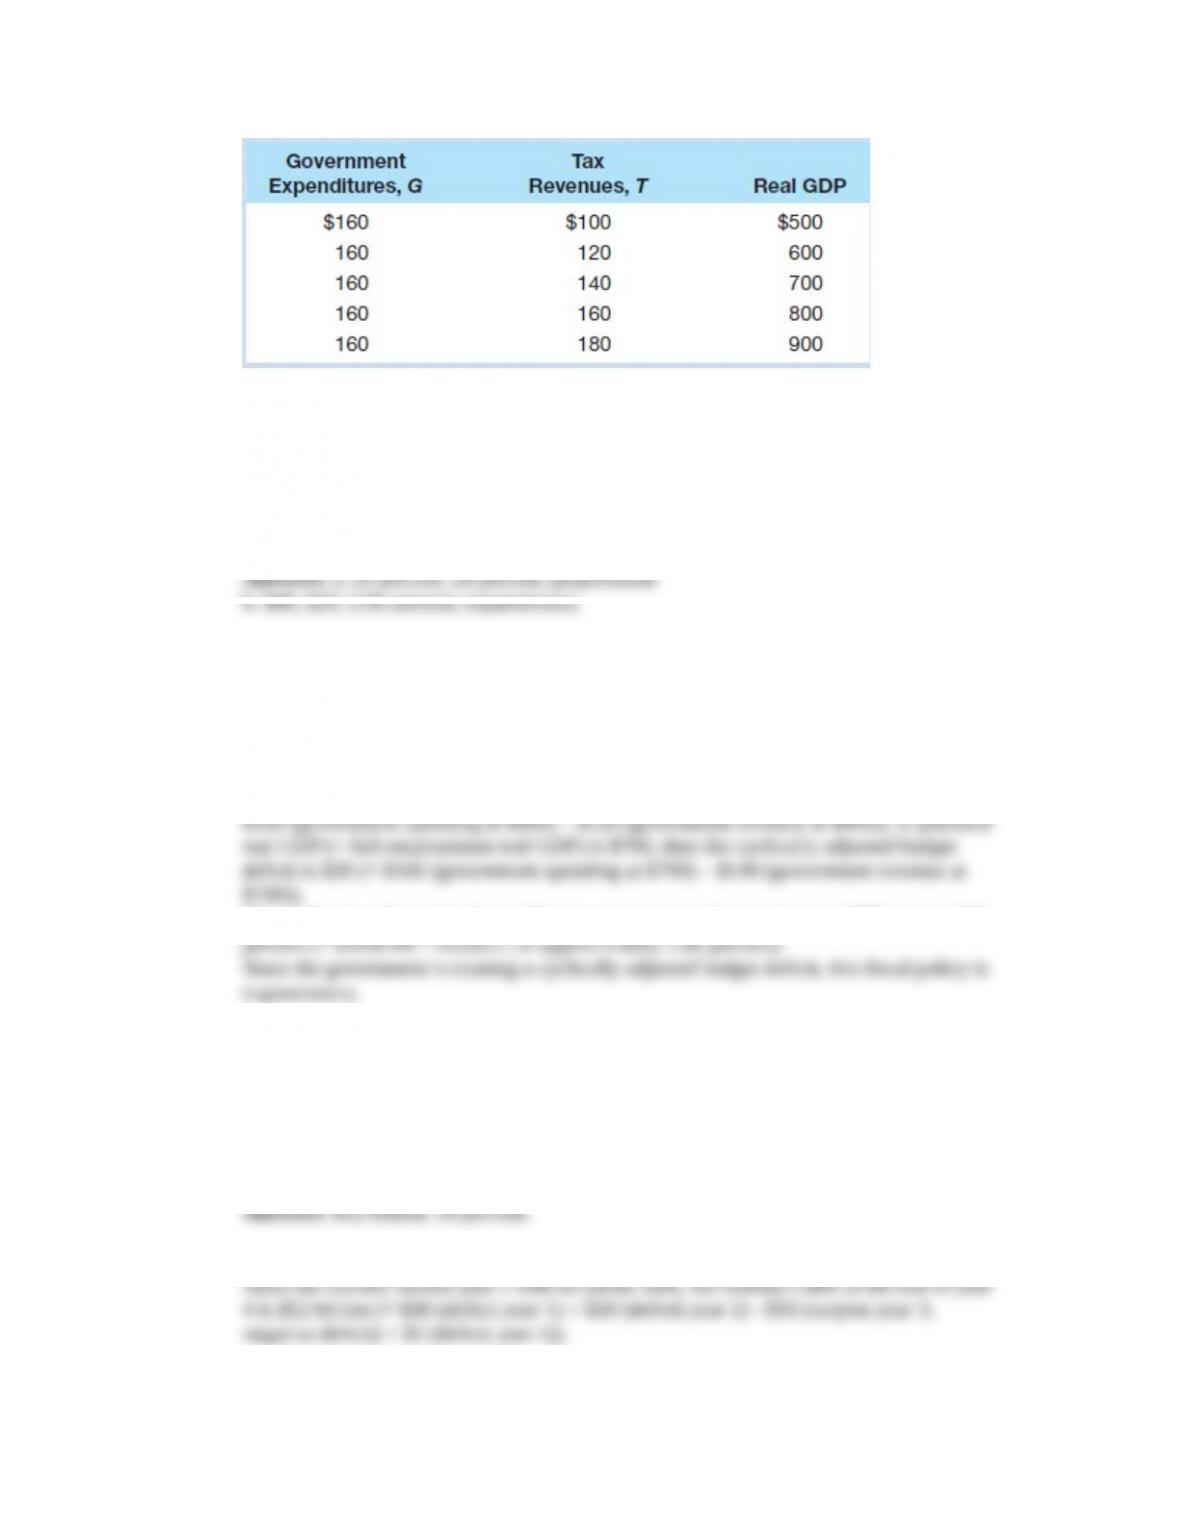
4. Refer to the accompanying table for Waxwania: LO2
13-8
Copyright © 2015 McGraw-Hill Education. All rights reserved. No reproduction or distribution without the prior written
consent of McGraw-Hill Education.
Chapter 13 – Fiscal Policy, Deficits, and Debt
a. What is the marginal tax rate in Waxwania? The average tax rate? Which of the
following describes the tax system: proportional, progressive, regressive?
b. Suppose Waxwania is producing $600 of real GDP, whereas the potential real GDP (or
full-employment real GDP) is $700. How large is its budget deficit? Its cyclically-
adjusted budget deficit? Its cyclically-adjusted budget deficit as a percentage of potential
real GDP? Is Waxwania’s fiscal policy expansionary or is contractionary?
5. Refer to the table for Waxwania in problem 4. Suppose that Waxwania is producing $600 of
real GDP, whereas the potential real GDP (or full-employment real GDP) is $700. How large is
its budget deficit? Its cyclically adjusted budget deficit? Its cyclically adjusted budget deficit as a
percentage of potential real GDP? Is Waxwania’s fiscal policy expansionary or is it
contractionary? LO3
Answer: If Waxwania is producing $600 of real GDP, the budget deficit equals $40 (=
The cyclically adjusted budget deficit as a percentage of potential real GDP equals 2.86
6. Suppose that a country has no public debt in year 1 but experiences a budget deficit of $40
billion in year 1, a budget deficit of $20 billion in year 2, a budget surplus of $10 billion in year
3, and a budget deficit of $2 billion in year 4. What is the absolute size of its public debt in year
4? If its real GDP in year 4 is $104 billion, what is this country’s public debt as a percentage of
real GDP in year 4? LO6
Feedback: Public debt is the sum of deficits and surpluses (negative deficits) over time.
13-9
Copyright © 2015 McGraw-Hill Education. All rights reserved. No reproduction or distribution without the prior written
consent of McGraw-Hill Education.
Chapter 13 – Fiscal Policy, Deficits, and Debt
7. Suppose that the investment demand curve in a certain economy is such that investment
declines by $100 billion for every 1 percentage point increase in the real interest rate. Also,
suppose that the investment demand curve shifts rightward by $150 billion at each real interest
rate for every 1 percentage point increase in the expected rate of return from investment. If
stimulus spending (an expansionary fiscal policy) by government increases the real interest rate
by 2 percentage points, but also raises the expected rate of return on investment by 1 percentage
point, how much investment, if any, will be crowded out? LO6
Feedback: If stimulus spending (an expansionary fiscal policy) by government increases
the real interest rate by 2 percentage points this will reduce investment by $200 billion.
on investment by 1 percentage point this increases investment by $150 billion
Combining these two effects results in $50 billion in investment spending being crowded
out by the expansionary fiscal policy (= $200 (decrease from interest rate movement) –