Chapter 12 – Aggregate Demand and Aggregate Supply
REVIEW QUESTIONS
1. Which of the following help to explain why the aggregate demand curve slopes downward?
LO1
a. When the domestic price level rises, our goods and services become more expensive to
foreigners.
b. When government spending rises, the price level falls.
c. There is an inverse relationship between consumer expectations and personal taxes.
d. When the price level rises, the real value of financial assets (like stocks, bonds, and savings
account balances) declines.
Answer: a. When the domestic price level rises, our goods and services become more
Feedback: Only two of the choices help to explain why the aggregate demand curve
slopes downward—and, consequently, why there is an inverse relationship between the
The second correct answer is when the price level rises, the real value of financial assets
(like stocks, bonds, and savings account balances) declines. This phrase gets across the
2. Which of the following will shift the aggregate demand curve to the left? LO2
a. The government reduces personal income taxes.
b. Interest rates rise.
c. The government raises corporate profit taxes.
d. There is an economic boom overseas that raises the incomes of foreign households.
Feedback: An increase in interest rates will cause aggregate demand to shift left by
raising borrowing costs and thereby reducing both investment spending and aggregate
Please note that the other two answers are incorrect because they would each shift the
12-1
Copyright © 2015 McGraw-Hill Education. All rights reserved. No reproduction or distribution without the prior written
consent of McGraw-Hill Education.
Chapter 12 – Aggregate Demand and Aggregate Supply
3. Label each of the following descriptions as being either an immediate-short-run aggregate
supply curve, a short-run aggregate supply curve, or a long-run aggregate supply curve. LO3
a. A vertical line.
b. The price level is fixed.
c. Output prices are flexible, but input prices are fixed.
d. A horizontal line.
e. An upsloping curve.
f. Output is fixed.
Feedback: A vertical line implies a long-run aggregate supply curve because only long-
run aggregate supply curves are vertical (due to the economy always returning to the full-
Output prices are flexible but input prices are fixed implies a short-run aggregate supply
curve because it is only during the short run that input prices are fixed while output prices
An upsloping curve implies a short-run aggregate supply curve because only short-run
aggregate supply curves are upsloping (due to the fact that in the short run input prices
Output is fixed implies a long-run aggregate supply curve because only long-run
4. Which of the following will shift the aggregate supply curve to the right? LO4
a. A new networking technology increases productivity all over the economy.
b. The price of oil rises substantially.
c. Business taxes fall.
d. The government passes a law doubling all manufacturing wages.
Answer: The two answers for which aggregate supply would actually shift right are: a. A
12-2
Copyright © 2015 McGraw-Hill Education. All rights reserved. No reproduction or distribution without the prior written
consent of McGraw-Hill Education.
Chapter 12 – Aggregate Demand and Aggregate Supply
Feedback: The scenario that a new networking technology increases productivity all
over the economy will cause the aggregate supply curve to shift right because the higher
The other two answers are incorrect because they both describe scenarios that would
cause the aggregate supply curve to shift to the left (rather than to the right). For instance,
a scenario in which the price of oil rises substantially is one in which many firms will
5. At the current price level, producers supply $375 billion of final goods and services while
consumers purchase $355 billion of final goods and services. The price level is: LO5
a. Above equilibrium.
b. At equilibrium.
c. Below equilibrium.
d. More information is needed.
Feedback: The price level is above equilibrium because there is currently an excess
supply of goods and services of $20 billion (= $375 billion produced by suppliers – $355
6. What effects would each of the following have on aggregate demand or aggregate supply, other
things equal? In each case use a diagram to show the expected effects on the equilibrium price
level and the level of real output, assuming that the price level is flexible both upward and
downward. LO3
a. A widespread fear by consumers of an impending economic depression.
b. A new national tax on producers based on the value-added between the costs of the inputs and
the revenue received from their output.
c. A reduction in interest rates at each price level.
d. A major increase in spending for health care by the Federal government.
e. The general expectation of coming rapid inflation.
f. The complete disintegration of OPEC, causing oil prices to fall by one-half.
g. A 10 percent across-the-board reduction in personal income tax rates.
h. A sizable increase in labor productivity (with no change in nominal wages).
12-3
Copyright © 2015 McGraw-Hill Education. All rights reserved. No reproduction or distribution without the prior written
consent of McGraw-Hill Education.
Chapter 12 – Aggregate Demand and Aggregate Supply
i. A 12 percent increase in nominal wages (with no change in productivity).
j. An increase in exports that exceeds an increase in imports (not due to tariffs).
Answer:
a. AD curve left, output down and price level down (assuming no ratchet effect).
b. AS curve left, output down and price level up.
c. AD curve right, output and price level up.
7. True or False: Decreases in AD normally lead to decreases in both output and the price level.
LO6
Feedback: This statement is false because decreases in AD normally lead to falls in
output but not the price level. That is the case because the price level in the real world is
8. Assume that (a) the price level is flexible upward but not downward and (b) the economy is
currently operating at its full-employment output. Other things equal, how will each of the
following affect the equilibrium price level and equilibrium level of real output in the short run?
LO3
a. An increase in aggregate demand.
b. A decrease in aggregate supply, with no change in aggregate demand.
c. Equal increases in aggregate demand and aggregate supply.
d. A decrease in aggregate demand.
e. An increase in aggregate demand that exceeds an increase in aggregate supply.
Answer:
a. Price level rises rapidly and little change in real output.
9. True or False: If the price of oil suddenly increases by a large amount, AS will shift left, but the
price level will not rise thanks to price inflexibility. LO6
12-4
Copyright © 2015 McGraw-Hill Education. All rights reserved. No reproduction or distribution without the prior written
consent of McGraw-Hill Education.
Chapter 12 – Aggregate Demand and Aggregate Supply
Feedback: This statement is false because price inflexibility only applies to falling
prices. By contrast, prices are quite flexible upward. As a result, a supply shock such as
PROBLEMS
1. Suppose that consumer spending initially rises by $5 billion for every 1 percent rise in
household wealth and that investment spending initially rises by $20 billion for every 1
percentage point fall in the real interest rate. Also assume that the economy’s multiplier is 4. If
household wealth falls by 5 percent because of declining house values, and the real interest rate
falls by two percentage points, in what direction and by how much will the aggregate demand
curve initially shift at each price level? In what direction and by how much will it eventually
shift? LO2
Feedback: Suppose that consumer spending initially rises by $5 billion for every 1
percent rise in household wealth. If household wealth falls by 5 percent because of
Also, suppose that investment spending initially rises by $20 billion for every 1
percentage point fall in the real interest rate. If the real interest rate falls by two
The combined initial effect is a shift to the right of the aggregate demand curve by $15
billion. There is a decrease of $25 billion from consumer expenditure and an increase of
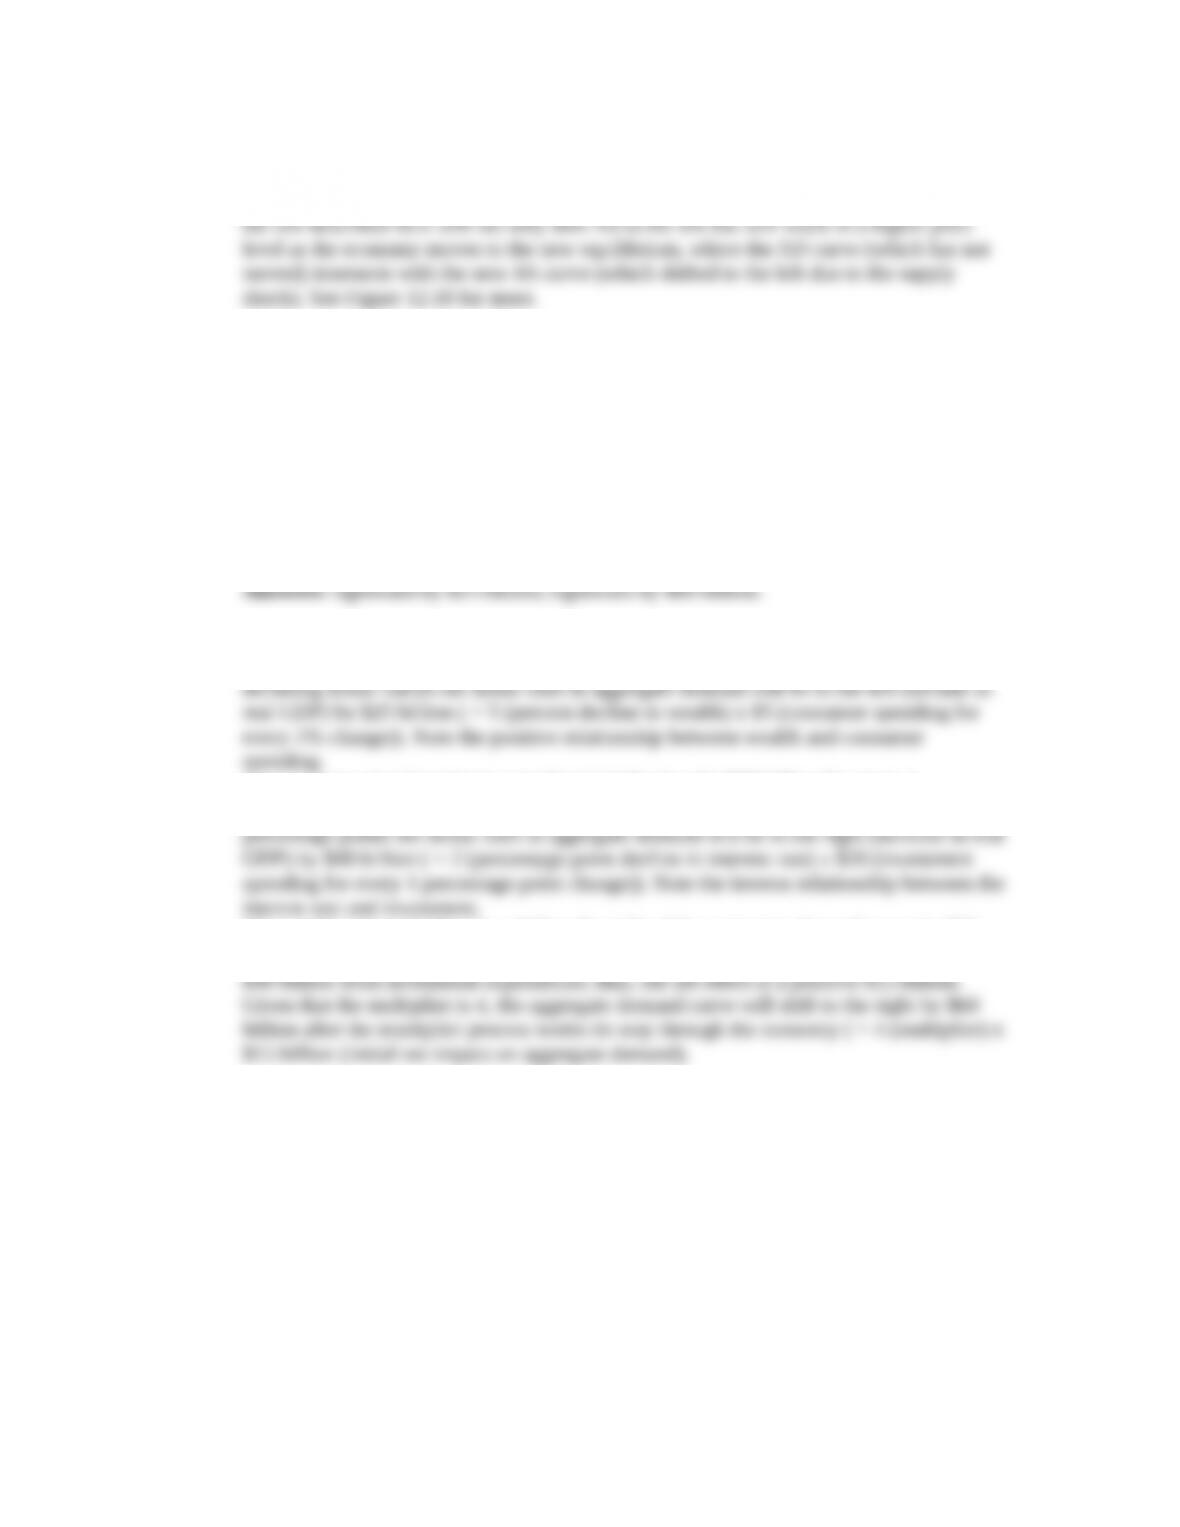
2. Answer the following questions on the basis of the three sets of data for the country of North
Vaudeville: LO4
12-5
Copyright © 2015 McGraw-Hill Education. All rights reserved. No reproduction or distribution without the prior written
consent of McGraw-Hill Education.
Chapter 12 – Aggregate Demand and Aggregate Supply
a. Which set of data illustrates aggregate supply in the immediate short run in North Vaudeville?
The short run? The long run?
b. Assuming no change in hours of work, if real output per hour of work increases by 10 percent,
what will be the new levels of real GDP in the right column of A? Does the new data reflect an
increase in aggregate supply or does it indicate a decrease in aggregate supply?
Feedback:
Part a:
The data in B illustrates aggregate supply in the immediate short-run in North Vaudeville.
The data in A illustrates aggregate supply in the short-run in North Vaudeville. The price
The data in C illustrates aggregate supply in the long-run in North Vaudeville. The price
Part b:
To find the new level of output at each price level multiply the original values by 1.1.
Price level 110: New output equals 302.5 (=1.1 x 275)
3. Suppose that the aggregate demand and aggregate supply schedules for a hypothetical economy
are as shown below: LO5
12-6
Copyright © 2015 McGraw-Hill Education. All rights reserved. No reproduction or distribution without the prior written
consent of McGraw-Hill Education.
Chapter 12 – Aggregate Demand and Aggregate Supply
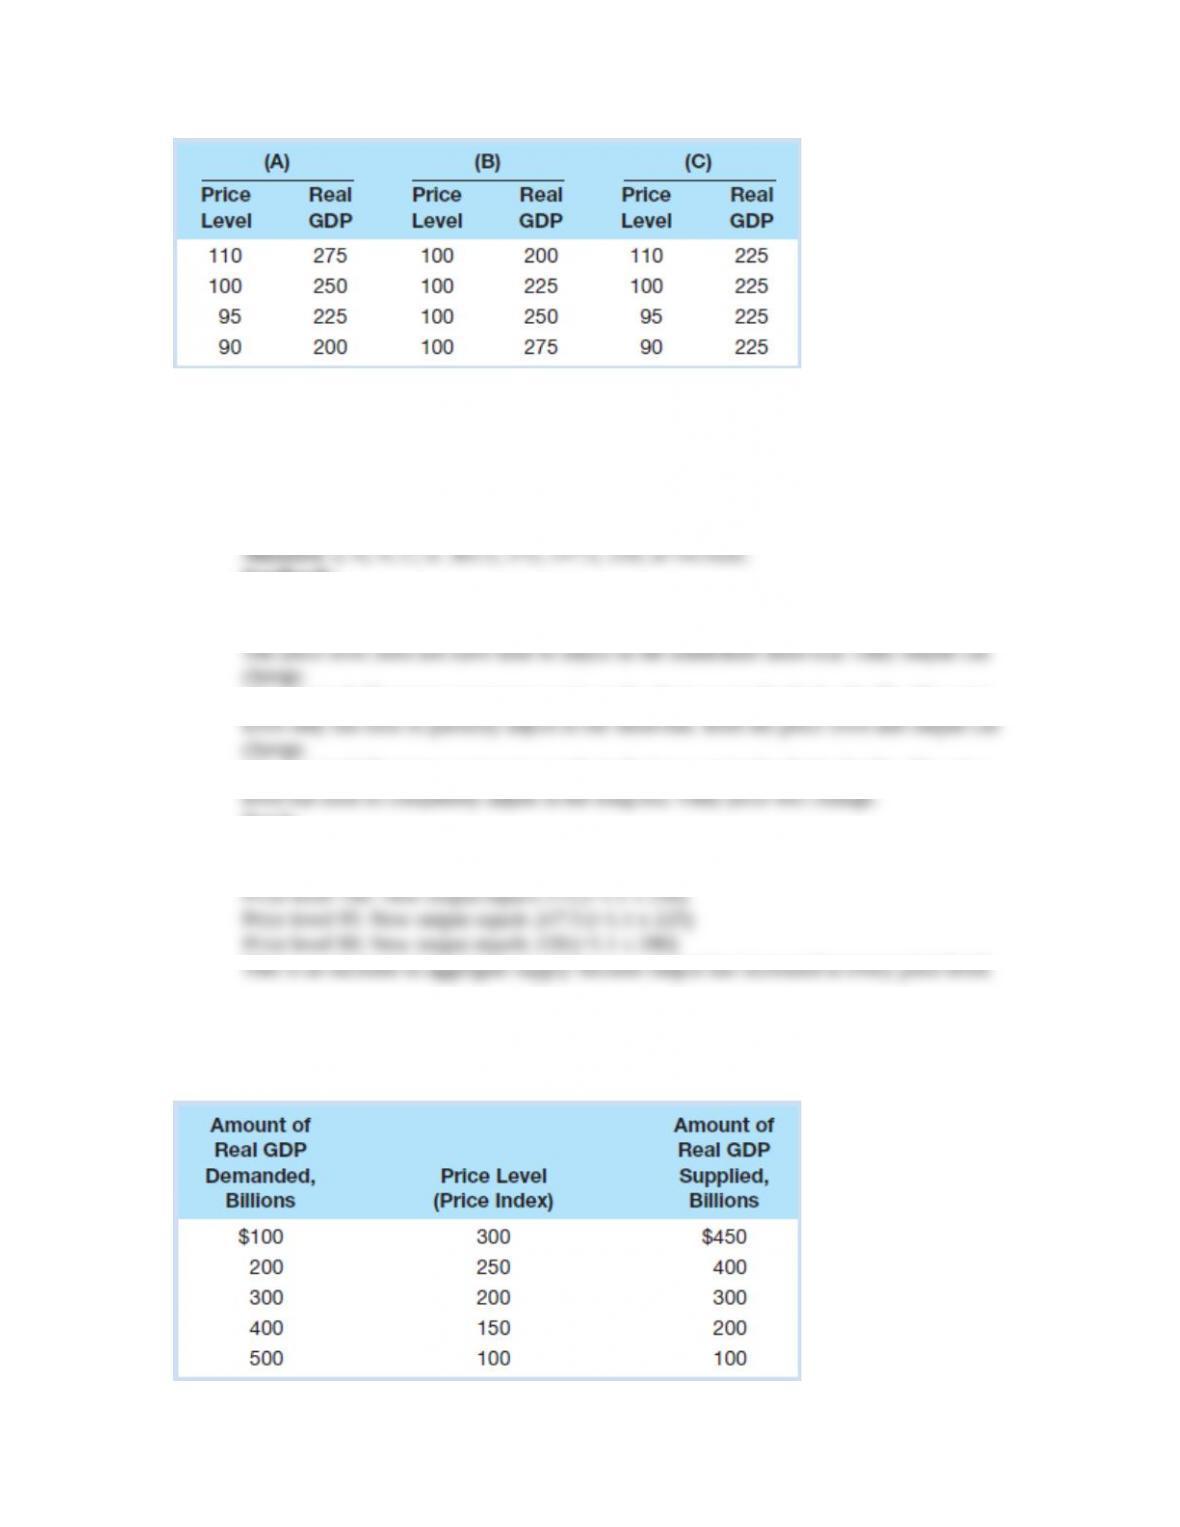
a. Use these sets of data to graph the aggregate demand and aggregate supply curves. What is the
equilibrium price level and the equilibrium level of real output in this hypothetical economy? Is
the equilibrium real output also necessarily the full-employment real output?
b. If the price level in this economy is 150, will quantity demanded equal, exceed, or fall short of
quantity supplied? By what amount? If the price level is 250, will quantity demanded equal,
exceed, or fall short of quantity supplied? By what amount?
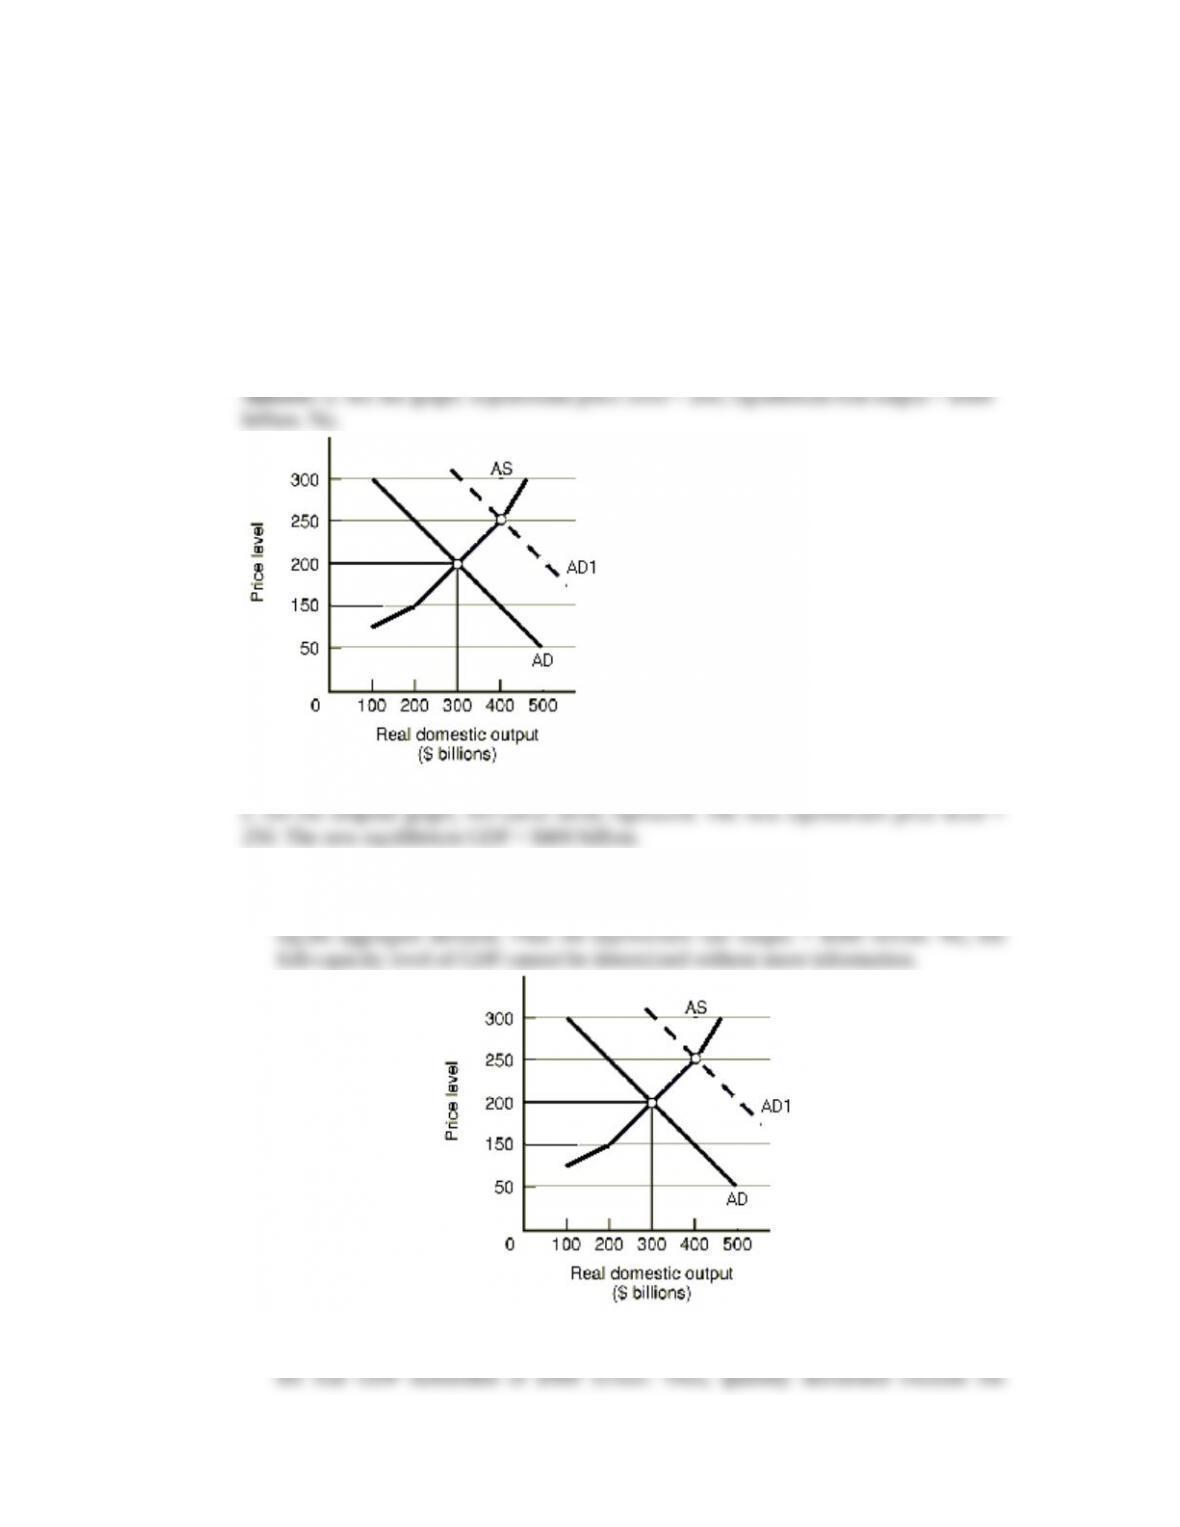
c. Suppose that buyers desire to purchase $200 billion of extra real output at each price level.
Sketch in the new aggregate demand curve as AD1. What is the new equilibrium price level and
level of real output?
b. Exceed by $200 billion; fall short by $200 billion.
Feedback:
a. See the graph. Equilibrium price level = 200, which occurs where aggregate supply
b. At a price level of 150, real GDP supplied is a maximum of $200 billion, less than
12-7
Copyright © 2015 McGraw-Hill Education. All rights reserved. No reproduction or distribution without the prior written
consent of McGraw-Hill Education.
Chapter 12 – Aggregate Demand and Aggregate Supply
c. See the graph from part a. Increases in consumer, investment, government, or net
Amount of Real GDP
Demanded, Billions
Price Level
(Price Index)
Amount of Real GDP
Supplied, Billions
$300 (=$100 + $200) 300 $450
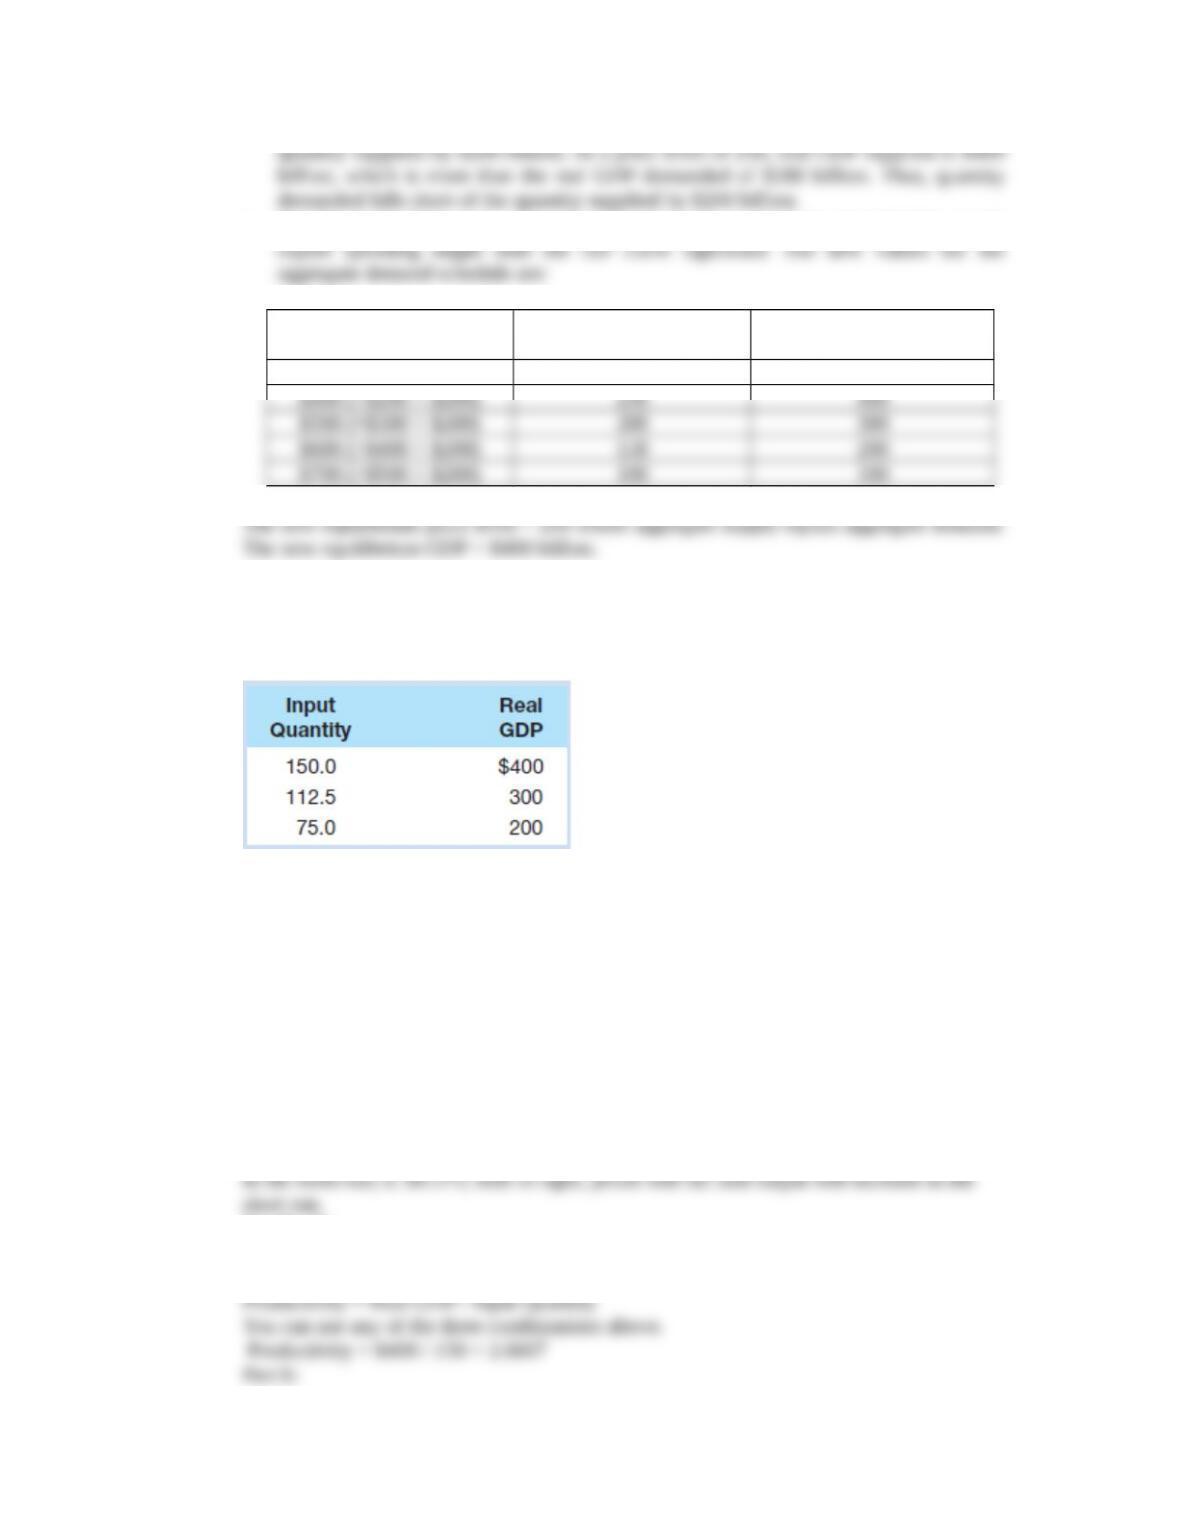
4. Suppose that the table below shows an economy’s relationship between real output and the
inputs needed to produce that output: LO4
a. What is productivity in this economy?
b. What is the per-unit cost of production if the price of each input unit is $2?
c. Assume that the input price increases from $2 to $3 with no accompanying change in
productivity. What is the new per-unit cost of production? In what direction would the $1 increase
in input price push the economy’s aggregate supply curve? What effect would this shift of
aggregate supply have on the price level and the level of real output?
d. Suppose that the increase in input price does not occur but, instead, that productivity increases
by 100 percent. What would be the new per-unit cost of production? What effect would this
change in per-unit production cost have on the economy’s aggregate supply curve? What effect
would this shift of aggregate supply have on the price level and the level of real output?
Answer: a. 2.6667; b. $0.75; c. $1.125; shift left; output will decrease and prices will rise
Feedback:
Part a:
Productivity is defined by how much output each unit of the input produces.
12-8
Copyright © 2015 McGraw-Hill Education. All rights reserved. No reproduction or distribution without the prior written
consent of McGraw-Hill Education.
Chapter 12 – Aggregate Demand and Aggregate Supply
The per unit cost is defined by how much each unit of output costs to produce. The total
Part c:
The new per unit cost = ($3 x 150) / $400 =$450 / $400 = $1.125.
Part d:
If productivity increases by 100%, this implies output will double at every input quantity.
5. Refer to the data in the table that accompanies Problem 2. Suppose that the present equilibrium
price level and level of real GDP are 100 and $225, and that data set B represents the relevant
aggregate supply schedule for the economy. LO6
a. What must be the current amount of real output demanded at the 100 price level?
b. If the amount of output demanded declined by $25 at the 100 price shown levels in B, what
would be the new equilibrium real GDP? In business cycle terminology, what would economists
call this change in real GDP?
Feedback:
Part a:
Part b:
If output demanded fell by $25, the new level of demand is $200. Since the price level
12-9
Copyright © 2015 McGraw-Hill Education. All rights reserved. No reproduction or distribution without the prior written
consent of McGraw-Hill Education.