Chapter 11 – The Aggregate Expenditures Model
Chapter 11 – The Aggregate Expenditures Model
McConnell Brue Flynn 20e
DISCUSSION QUESTIONS
1. What is an investment schedule and how does it differ from an investment demand curve? LO2
Answer: An investment schedule shows the level of investment spending for a
given level of GDP. An investment demand curve shows how expected rates of
2. Why does equilibrium real GDP occur where C + Ig = GDP in a private closed economy? What
happens to real GDP when C + Ig exceeds GDP? When C + Ig is less than GDP? What two
expenditure components of real GDP are purposely excluded in a private closed economy? LO3
Answer: The reason why equilibrium occurs when real GDP equals C + Ig in a private
closed economy is because it is at this level output where production creates total
3. Why is saving called a leakage? Why is planned investment called an injection? Why must
saving equal planned investment at equilibrium GDP in the private closed economy? Are
unplanned changes in inventories rising, falling, or constant at equilibrium GDP? Explain. LO4
Answer: Saving is like a leakage from the flow of aggregate consumption
expenditures because saving represents income not spent. Planned investment is
an injection because it is spending on capital goods that businesses plan to make
11-1
Copyright © 2015 McGraw-Hill Education. All rights reserved. No reproduction or distribution without the prior written
consent of McGraw-Hill Education.
Chapter 11 – The Aggregate Expenditures Model
4. Other things equal, what effect will each of the following changes independently have on the
equilibrium level of real GDP in the private closed economy? LO4
a. A decline in the real interest rate.
b. An overall decrease in the expected rate of return on investment.
c. A sizeable, sustained increase in stock prices.
Answer: a. This will increase interest-sensitive consumer purchases and
b. Investment will decrease because of the lower expected rate of return, causing
c. By increasing consumption (because households will feel—or be—more
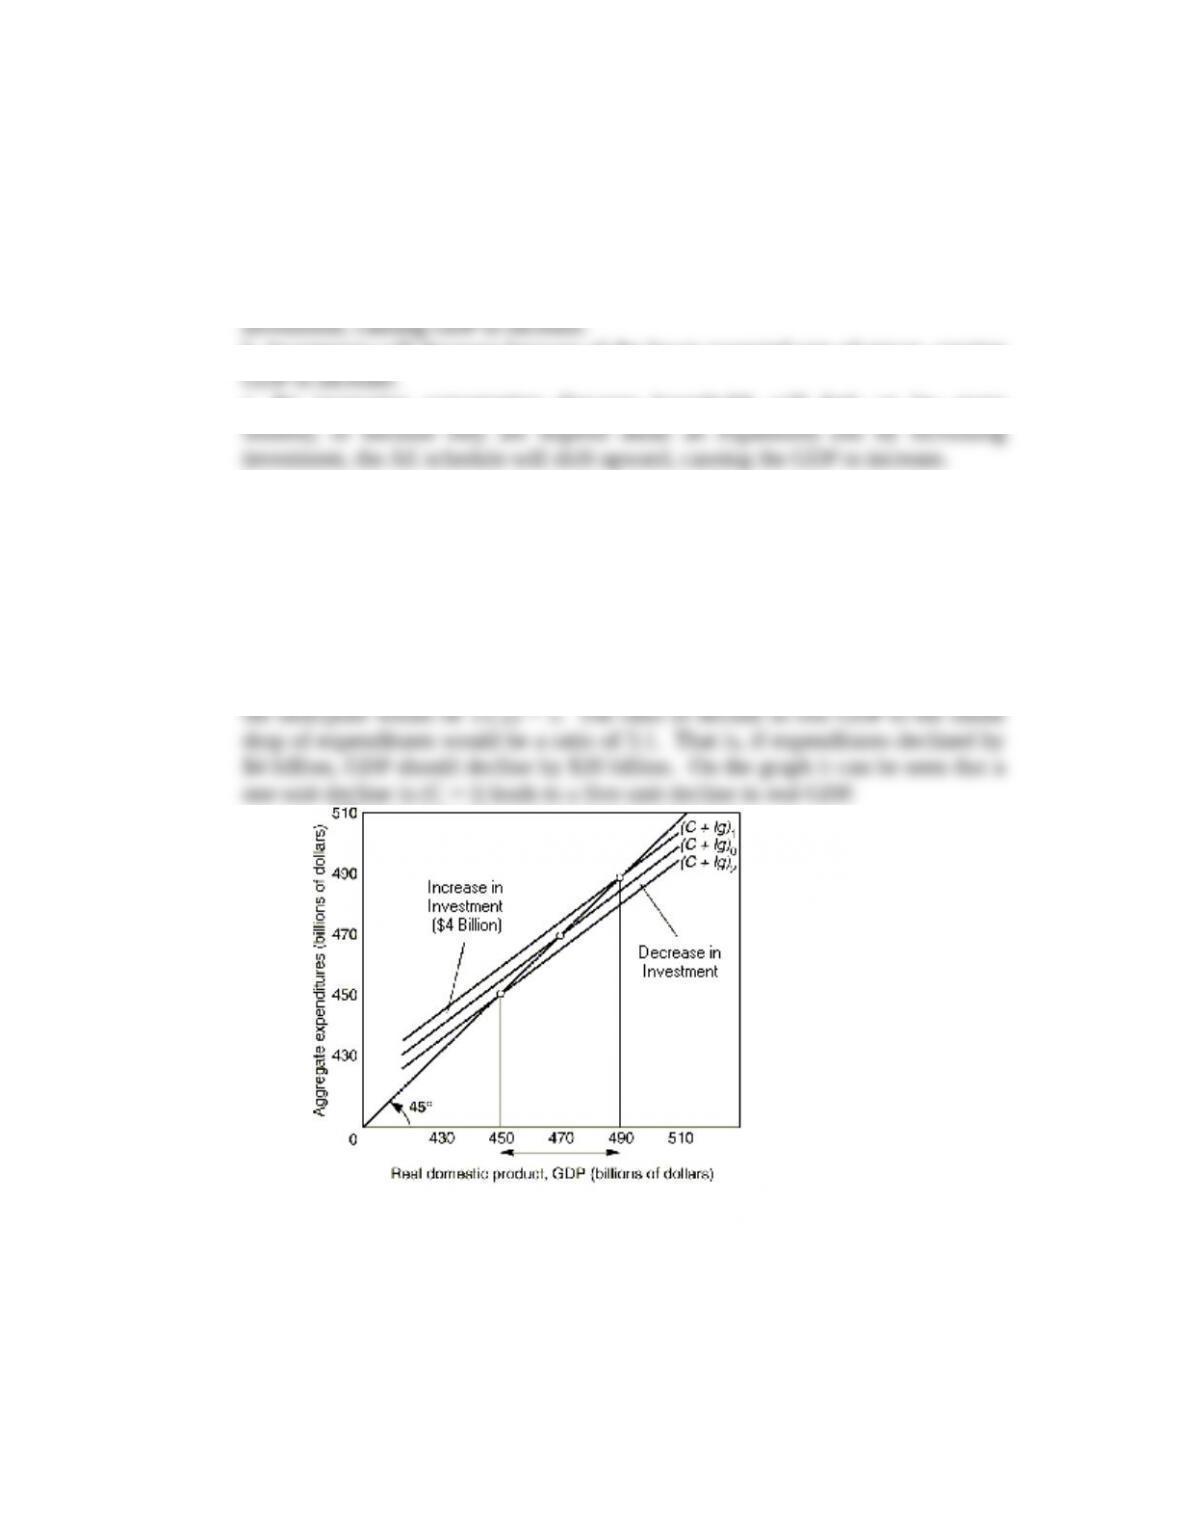
5. Depict graphically the aggregate expenditures model for a private closed economy. Now show
a decrease in the aggregate expenditures schedule and explain why the decline in real GDP in
your diagram is greater than the decline in the aggregate expenditures schedule. What is the term
used for the ratio of a decline in real GDP to the initial drop in aggregate expenditures? LO5
Answer: Consider the following numerical example. If the slope of the aggregate
expenditures schedule were .8, then the MPC = .8 and the MPS = .2. Therefore,
11-2
Copyright © 2015 McGraw-Hill Education. All rights reserved. No reproduction or distribution without the prior written
consent of McGraw-Hill Education.
Chapter 11 – The Aggregate Expenditures Model
6. Assuming the economy is operating below its potential output, what is the impact of an
increase in net exports on real GDP? Why is it difficult, if not impossible, for a country to boost
its net exports by increasing its tariffs during a global recession? LO6
Answer: Like consumption and investment, exports create domestic production, income,
and employment for a nation. Although U.S. goods and services produced for export are
7. What is a recessionary expenditure gap? An inflationary expenditure gap? Which is associated
with a positive GDP gap? A negative GDP gap? LO6
Answer: A recessionary expenditure gap is the amount by which aggregate expenditures
at the full employment GDP fall short of those required to achieve the full employment
8. LAST WORD What is Say’s Law? How does it relate to the view held by classical economists
that the economy generally will operate at a position on its production possibilities curve
(Chapter 1)? Use production possibilities analysis to demonstrate Keynes’ view on this matter.
Answer: Say’s law states “supply creates its own demand.” People work in order to
earn income to, and plan to, spend the income on output – why else would they
work? Basically, the classical economists would say that the economy will operate
REVIEW QUESTIONS
11-3
Copyright © 2015 McGraw-Hill Education. All rights reserved. No reproduction or distribution without the prior written
consent of McGraw-Hill Education.
Chapter 11 – The Aggregate Expenditures Model
1. True or False: The aggregate expenditures model assumes flexible prices. LO1
Answer: False: This statement is false because the aggregate expenditures model is in
fact a “stuck-price” model in which prices cannot change at all. John Maynard Keynes
2. If total spending is just sufficient to purchase an economy’s output, then the economy is: LO3
a. In equilibrium.
b. In recession.
c. In debt.
d. In expansion.
Feedback: If total spending is just sufficient to purchase an economy’s output, then the
economy is in equilibrium. This is true because equilibrium occurs whenever firms have
3. True or False: If spending exceeds output, real GDP will decline as firms cut back on
production. LO3
Feedback: This statement is false because if spending exceeds output, inventories will be
4. If inventories unexpectedly rise, then production ________ sales and firms will respond by
________ output. LO3
a. Trails; expanding.
b. Trails; reducing.
c. Exceeds; expanding.
d. Exceeds; reducing.
Feedback: If inventories unexpectedly rise, then production exceeds sales and firms will
respond by reducing output. This is true because if inventories rise unexpectedly, firms
11-4
Copyright © 2015 McGraw-Hill Education. All rights reserved. No reproduction or distribution without the prior written
consent of McGraw-Hill Education.
Chapter 11 – The Aggregate Expenditures Model
5. If the multiplier is 5 and investment increases by $3 billion, equilibrium real GDP will increase
by: LO5
a. $2 billion.
b. $3 billion.
c. $8 billion.
d. $15 billion.
e. None of the above.
Feedback: Equilibrium GDP will increase by $15 billion. We know this is true because
6. A depression abroad will tend to ________ our exports, which in turn will _________ net
exports, which in turn will ________ equilibrium real GDP. LO6
a. Reduce; reduce; reduce.
b. Increase; increase; increase.
c. Reduce; increase; increase.
d. Increase; reduce; reduce.
Feedback: The correct answer is that a depression abroad will tend to reduce our exports,
which in turn will reduce net exports, which in turn will reduce equilibrium real GDP. To
11-5
Copyright © 2015 McGraw-Hill Education. All rights reserved. No reproduction or distribution without the prior written
consent of McGraw-Hill Education.
Chapter 11 – The Aggregate Expenditures Model
7. Explain graphically the determination of equilibrium GDP for a private economy through the
aggregate expenditures model. Now add government purchases (any amount you choose) to your
graph, showing its impact on equilibrium GDP. Finally, add taxation (any amount of lump-sum
tax that you choose) to your graph and show its effect on equilibrium GDP. Looking at your
graph, determine whether equilibrium GDP has increased, decreased, or stayed the same given
the sizes of the government purchases and taxes that you selected. LO7
8. The economy’s current level of equilibrium GDP is $780 billion. The full employment level of
GDP is $800 billion. The multiplier is 4. Given those facts, we know that the economy faces
________ expenditure gap of ________. LO8
a. An inflationary; $5 billion.
b. An inflationary; $10 billion.
c. An inflationary; $20 billion.
d. A recessionary; $5 billion.
e. A recessionary; $10 billion.
f. A recessionary; $20 billion.
Feedback: The correct answer is that the economy faces a recessionary expenditure gap
of $5 billion. This is true because aggregate expenditures would have to be increased
(and the aggregate expenditures curve shifted up vertically) by $5 billion in order to get
9. If an economy has an inflationary expenditure gap, the government could attempt to bring the
economy back toward the full-employment level of GDP by ________ taxes or ________
government expenditures. LO8
a. Increasing; increasing.
b. Increasing; decreasing.
c. Decreasing; increasing.
d. Decreasing; decreasing.
Feedback: The correct answer is that the government could try to bring the economy
back toward the full-employment level of GDP by increasing taxes or decreasing
11-6
Copyright © 2015 McGraw-Hill Education. All rights reserved. No reproduction or distribution without the prior written
consent of McGraw-Hill Education.

Chapter 11 – The Aggregate Expenditures Model
11-7
Copyright © 2015 McGraw-Hill Education. All rights reserved. No reproduction or distribution without the prior written
consent of McGraw-Hill Education.