PROBLEMS
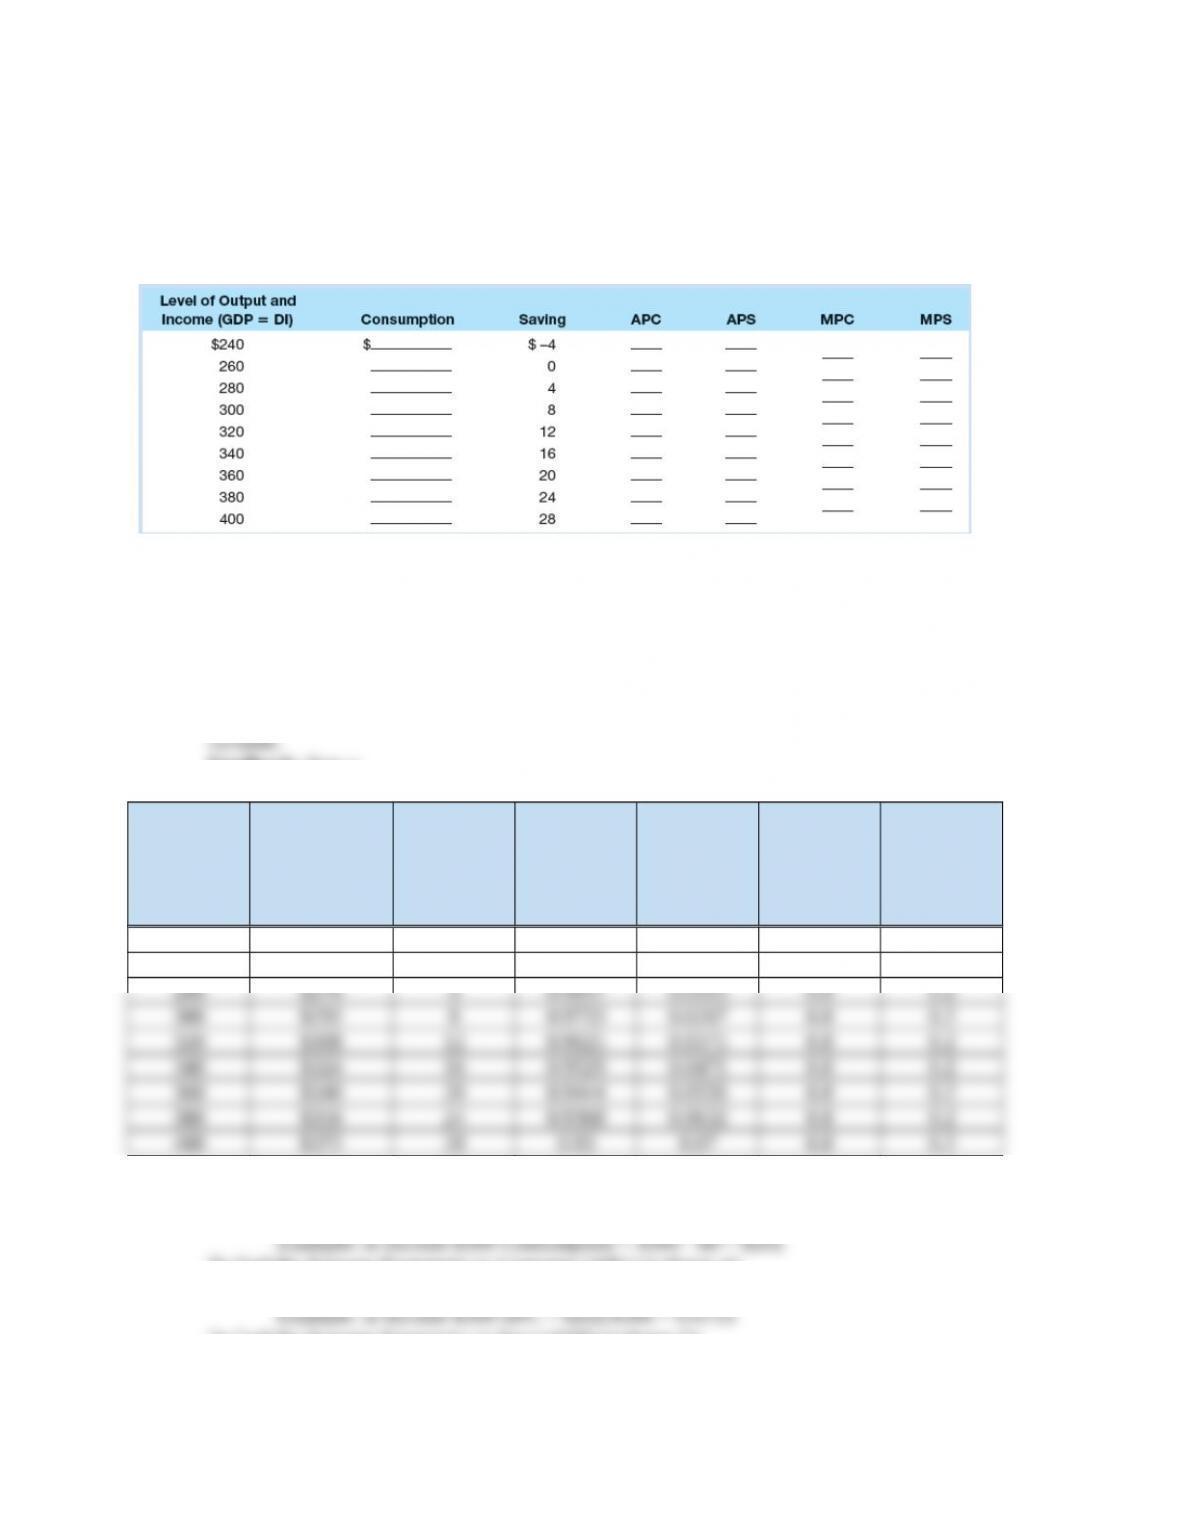
1. Refer to the incomplete table below. LO1
a. Fill in the missing numbers in the table.
b. What is the break-even level of income in the table? What is the term that economists use for the saving
situation shown at the $240 level of income?
c. For each of the following items indicate whether the value in the table is either constant or variable as
income changes: the MPS, the APC, the MPC, the APS.
Answers: (a) data in the completed table; (b) $260, dissaving; (c) constant, variable, constant,
Feedback: Part a:
Level of
Output
and
Income
(GDP=DI)
Consumptio
n
Saving APC APS MPC MPS
$240 $244 -$4 1.0167 -0.0167 0.8 0.2
260 $260 0 1 0 0.8 0.2
To find the level of consumption (column 2):
Consumption = Income – Saving
To find the Average Propensity to Consume (APC) (column 4):
APC = Consumption/Income
To find the Average Propensity to Save (APS) (column 5):
APS = Saving/Income

To find the Marginal Propensity to Consume (MPC) (column 6):
MPC = Δ Consumption/Δ Income
To find the Marginal Propensity to Save (MPS) (column 7):
MPS= Δ Saving/Δ Income
Part b:
Break-even level of income is where saving equals zero (consumption equals income). Thus, the
Part c:
MPS: Constant (does not change with income)
2. Suppose that disposable income, consumption, and saving in some country are $200 billion, $150
billion, and $50 billion, respectively. Next, assume that disposable income increases by $20 billion,
consumption rises by $18 billion and saving goes up by $2 billion. What is the economy’s MPC? Its
MPS? What was the APC before the increase in disposable income? After the increase? LO1
Answers: .9; .1; .75; .764.
Feedback:
To find the Marginal Propensity to Consume (MPC): MPC = Δ Consumption/Δ Income
To find the Marginal Propensity to Save (MPS): MPC = Δ Saving/Δ Income
To find the Average Propensity to Consume (APC): APC = Consumption/Income
increases by $18 given the increase in disposable income of $20.
3. ADVANCED ANALYSIS Suppose that the linear equation for consumption in a hypothetical economy
is C = 40 + .8Y. Also suppose that income (Y) is $400. Determine (a) the marginal propensity to consume,
(b) the marginal propensity to save, (c) the level of consumption, (d) the average propensity to consume,
(e) the level of saving, and (f) the average propensity to save. LO1
Feedback:
The marginal propensity to consume is the slope of the linear equation, which equals 0.8.
To find the level of consumption, substitute income into the linear equation. This results in a level
To find the average propensity to consume, divide consumption by income. This results in an
To find the level of saving, subtract consumption from income. This results in a level of saving of
To find the average propensity to save, divide saving by income. This results in an average
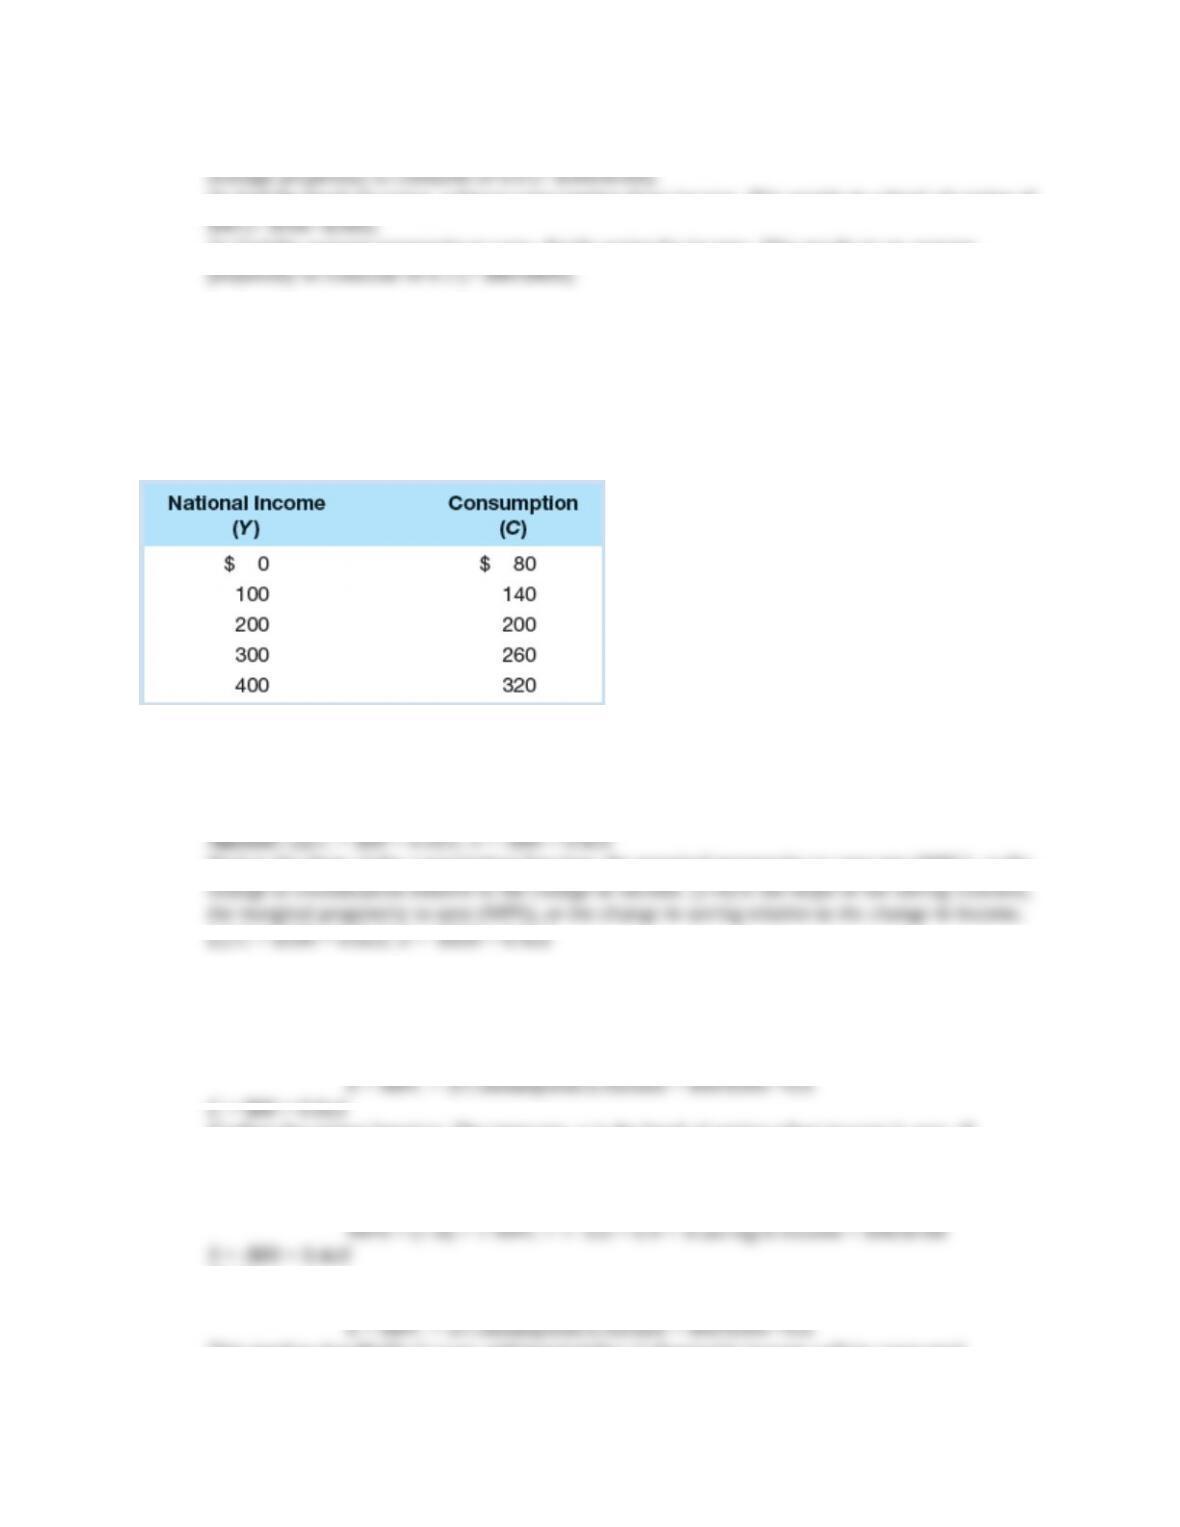
4. ADVANCED ANALYSIS Linear equations for the consumption and saving schedules take the general
form C = a + bY and S= -a + (1-b)Y where C, S, and Y are consumption, saving, and national income,
respectively. The constant a represents the vertical intercept, and b represents the slope of the
consumption schedule. LO1, LO2
a. Use the following data to substitute numerical values for a and b in the consumption and saving
equations.
b. What is the economic meaning of b? Of (1 – b)?
c. Suppose that the amount of saving that occurs at each level of national income falls by $20 but that the
values of b and (1 – b) remain unchanged. Restate the saving and consumption equations inserting the
new numerical values, and cite a factor that might have caused the change.
(b) b is the slope of the consumption function, the marginal propensity to consume (MPC), or the
Feedback: Finding the consumption function: The intercept a is the level of consumption when
income is zero. Thus, a = $80.
The slope of the consumption function b is found by looking at the change in consumption
relative to the change in income. This is the marginal propensity to consume (MPC).
Finding the saving function: The intercept –a is the level of saving when income is zero. If
consumption is positive when income is zero there must be dissaving. Thus –a =-$80.
The slope of the saving function (1-b) is found by looking at the change in saving relative to the
change in income. This is the marginal propensity to save (MPS).
Part b:
The slope of the consumption function b is the marginal propensity to consume (MPC).
This implies that $0.60 of every additional dollar of disposable income will be consumed.
The slope of the saving function (1-b) is the marginal propensity to save (MPS).
This implies that $0.40 of every additional dollar of disposable income will be saved.
Part c:
If saving falls by $20 at every level of national income this implies consumption increases by $20
at every level of income. Thus, the intercept of the consumption function a will increase by $20
and the intercept of the saving function –a will fall by $20.
5. Use your completed table for problem 1 to solve this problem. Suppose the wealth effect is such that
$10 changes in wealth produce $1 changes in consumption at each level of income. If real estate prices
tumble such that wealth declines by $80, what will be the new level of consumption at the $340 billion
level of disposable income? The new level of saving? LO2
Feedback:
If real estate prices tumble such that wealth declines by $80 and the wealth effect is such that a
$10 change in wealth produce a $1 change in consumption at each level of income, then
6. Suppose a handbill publisher can buy a new duplicating machine for $500 and the duplicator has a 1-
year life. The machine is expected to contribute $550 to the year’s net revenue. What is the expected rate
of return? If the real interest rate at which funds can be borrowed to purchase the machine is 8 percent,
will the publisher choose to invest in the machine? Will it invest in the machine if the real interest rate is 9
percent? If it is 11 percent? LO3
Feedback:
The expected rate of return equals the expected net revenue less cost divided by the cost of the
machine.
The firm will only make this purchase if the expected return is greater than or equal to interest
The logic is as follows. If you borrow a $100 at an interest rate of 10%, then at the end of the year
Now, if you can earn a rate of return of 20% on the borrowed $100, then you will have $120 from
However, if you can earn a rate of return of 5% on the borrowed $100, then you will have $105
Back to our problem: So, if the real interest rate at which funds can be borrowed to purchase the
Will it invest in the machine if the real interest rate is 9 percent? Yes, 10% is greater than 9%. If it
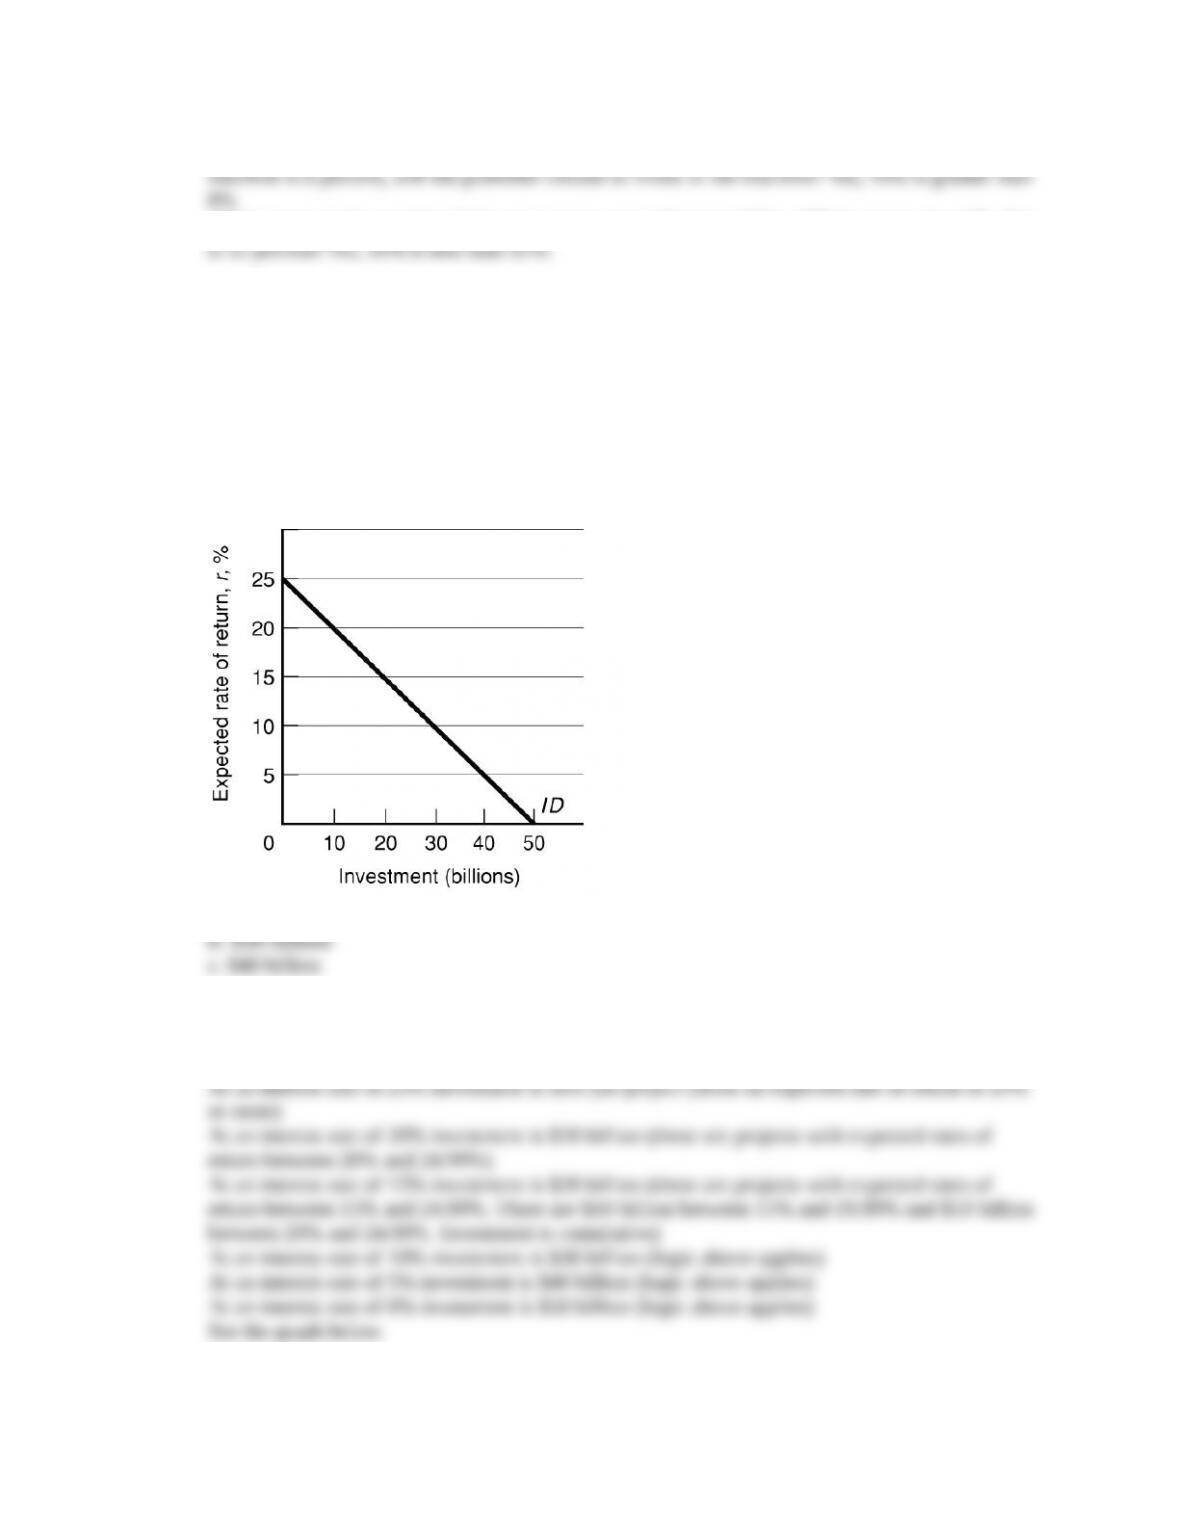
7. Assume there are no investment projects in the economy that yield an expected rate of return of 25
percent or more. But suppose there are $10 billion of investment projects yielding expected returns of
between 20 and 25 percent; another $10 billion yielding between 15 and 20 percent; another $10 billion
between 10 and 15 percent; and so forth. Cumulate these data and present them graphically, putting the
expected rate of return (and the real interest rate) on the vertical axis and the amount of investment on the
horizontal axis. What will be the equilibrium level of aggregate investment if the real interest rate is (a)
15 percent, (b) 10 percent, and (c) 5 percent? LO3
Answer:
a. $20 billion
Feedback:
The firm will only make an investment if the expected return is greater than or equal to interest
rate at which it can borrow.
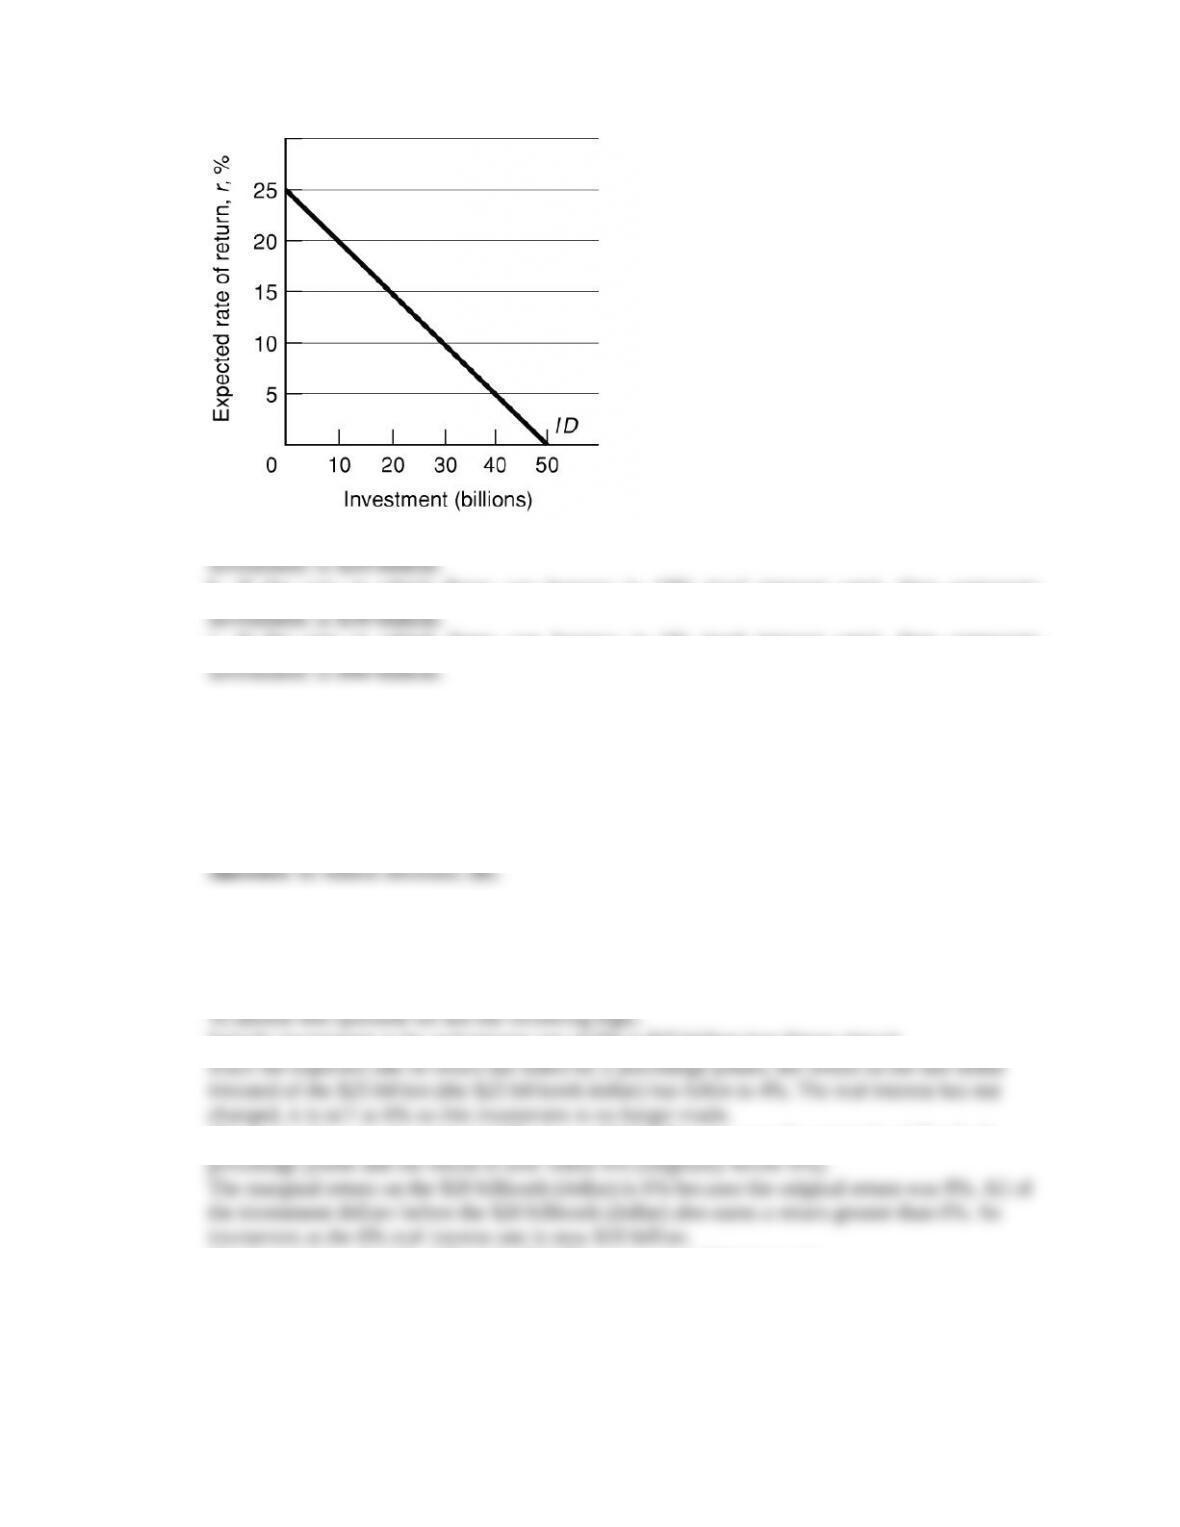
a. If the rate at which firms can borrow is 15% (real interest rate), then aggregate
b. If the rate at which firms can borrow is 10% (real interest rate), then aggregate
c. If the rate at which firms can borrow is 5% (real interest rate), then aggregate
8. Refer to the table in Figure 10.5 in the book and suppose that the real interest rate is 6 percent. Next,
assume that some factor changes such that that the expected rate of return declines by 2 percentage points
at each prospective level of investment. Assuming no change in the real interest rate, by how much and in
what direction will investment change? Which of the following might cause this change: (a) a decision to
increase inventories; (b) an increase in excess production capacity? LO4
Feedback:
Since the expected rate of return has fallen by 2 percentage points investment at each real interest
rate will decrease. The investment schedule will shift to the left.
The next question is by how much?
Initially investment at the real interest rate of 6% is $25 billion (see figure above).
This is true for every investment dollar beyond $20 billion because the return has fallen by 2
The investment schedule shifts in by $5 billion at every real interest rate.
Which of the following might cause this change: (a) a decision to increase inventories; (b) an
increase in excess production capacity?

The answer is (a). An increase in excess production capacity will reduce investment demand
9. What will the multiplier be when the MPS is 0, .4, .6, and 1? What will it be when the MPC is 1, .90, .
67, .50, and 0? How much of a change in GDP will result if firms increase their level of investment by $8
billion and the MPC is .80? If the MPC instead is .67? LO5
Answer: Multiplier when the MPS is 0: infinity or undefined; when the MPS is 0.4: 2.5; when
the MPS is 0.6: 1.6667; when the MPS is 1: 1; when the MPC is 1: infinity or undefined; when
Feedback: The multiplier = 1/MPS = 1/(1-MPC)
What will the multiplier be when the MPS is 0? infinity or undefined
What will the multiplier be when the MPS is 0.4? 2.5 (= 1/0.4)
10. Suppose that an initial $10 billion increase in investment spending expands GDP by $10 billion in the
first round of the multiplier process. If GDP and consumption both rise by $6 billion in the second round
of the process, what is the MPC in this economy? What is the size of the multiplier? If, instead, GDP and
consumption both rose by $8 billion in the second round, what would have been the size of the multiplier?
LO5
Feedback: The initial $10 billion increase in investment spending expands GDP by $10 billion
and income by $10 billion. Since consumption increases by $6 billion after the $10 billion
increase in income the marginal propensity to consume equals 0.6.
MPC = Δ Consumption/Δ Income = $6 billion/$10 billion =0.6
Given the MPC we can find the multiplier, which equals 2.5.
If instead, GDP and consumption rose by $8 billion after the $10 billion increase, the MPC would
have been 0.8.

Given the MPC we can find the multiplier, which equals 5.