Chapter 01 Appendix
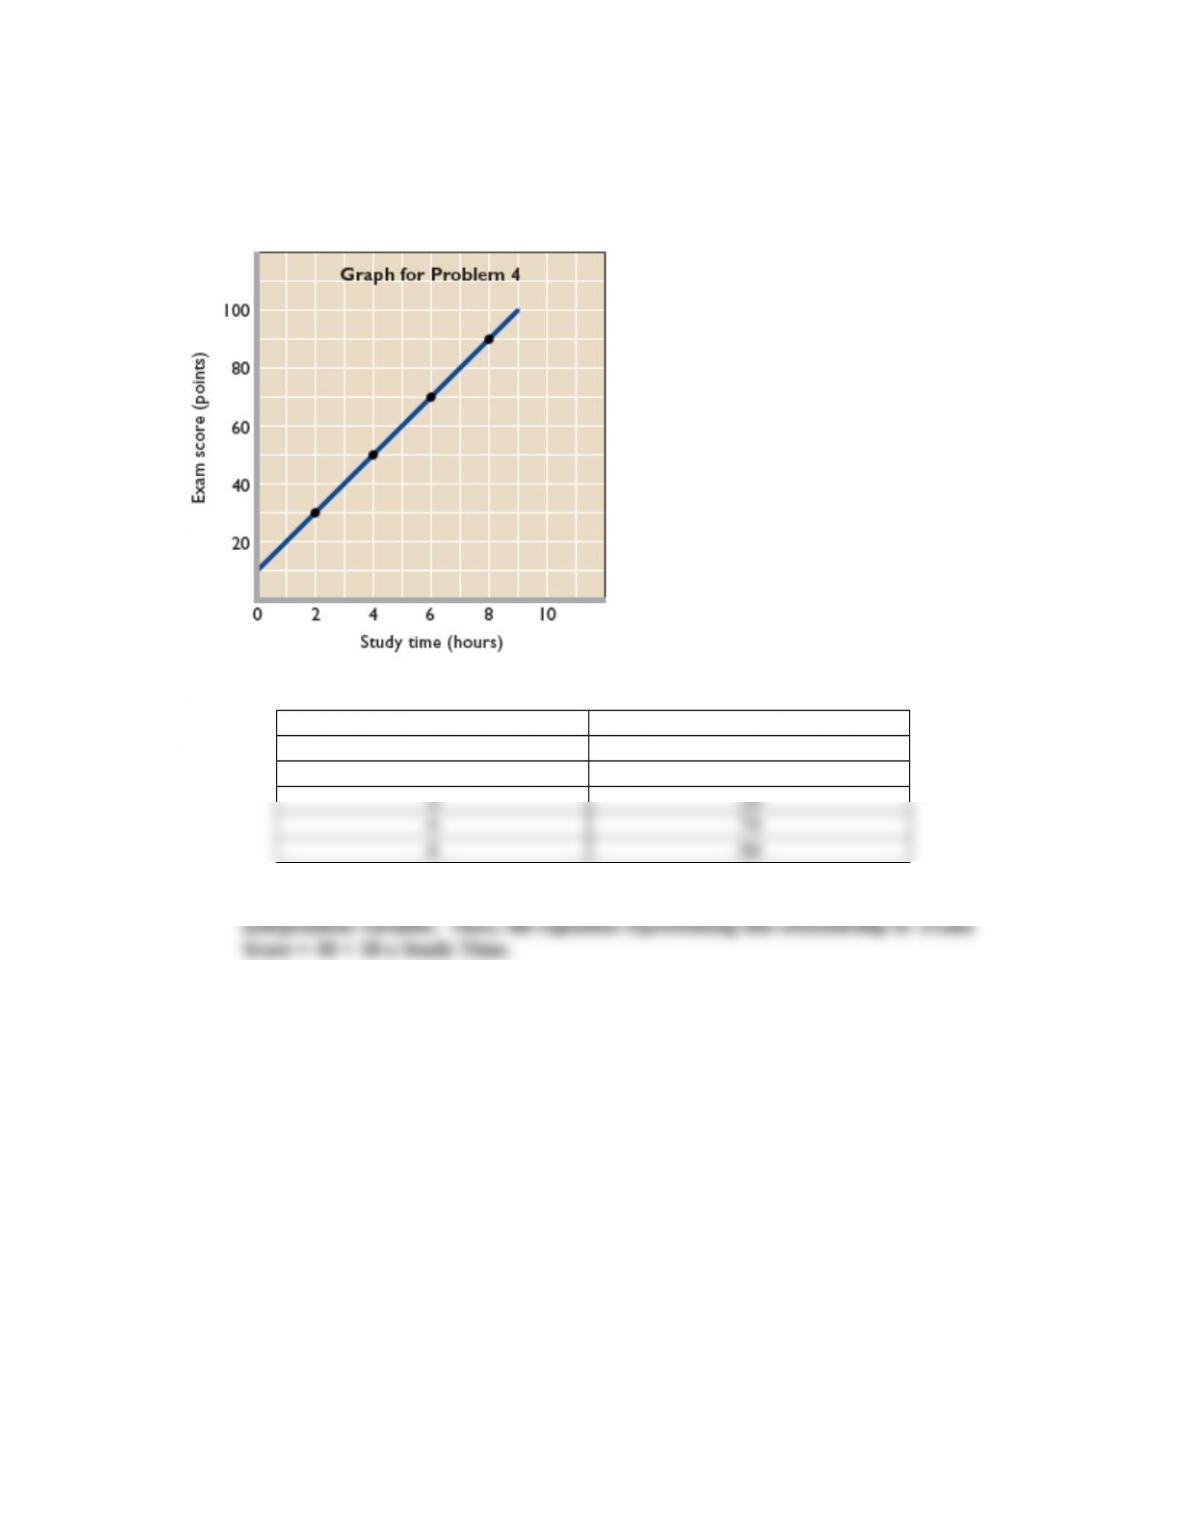
4. Construct a table from the data shown on the graph below. Which is the dependent variable
and which the independent variable? Summarize the data in equation form. LO8
Answer:
Study Time (hours) Exam Score (points)
0 10
2 30
The dependent variable is Exam Score (points); Study Time (hours) is the
Feedback: Consider the following figure:
1A-1
Copyright © 2015 McGraw-Hill Education. All rights reserved. No reproduction or distribution without the prior written
consent of McGraw-Hill Education.
Chapter 01 Appendix
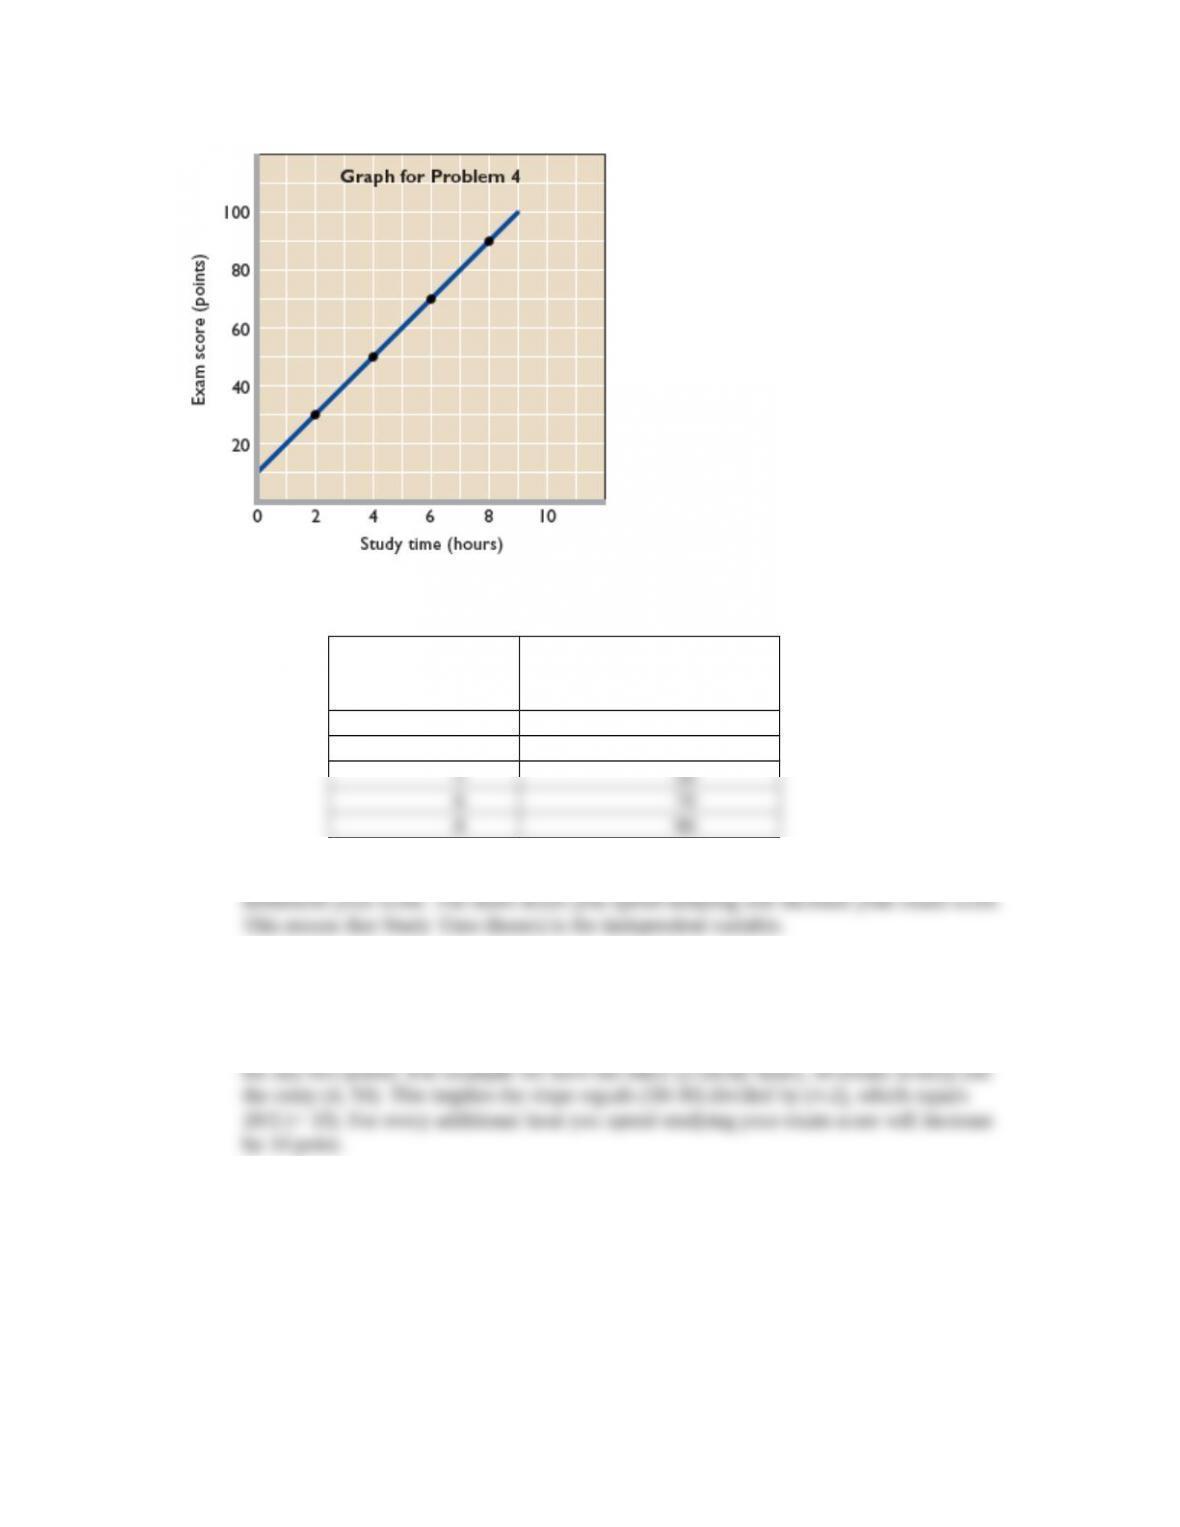
The table for this data is as follows:
Study
Time
(hours)
Exam Score
(points)
0 10
2 30
The dependent variable is Exam Score (points) because we assume Study Time (hours)
The vertical intercept for this relationship is your exam score if you choose not to study
(zero hours). From the table above this value is 10.
To find the slope we divide the change in your Exam Score by the change in Study Time
Thus, the equation representing this relationship is: Exam Score = 10 + 10 x
Study Time
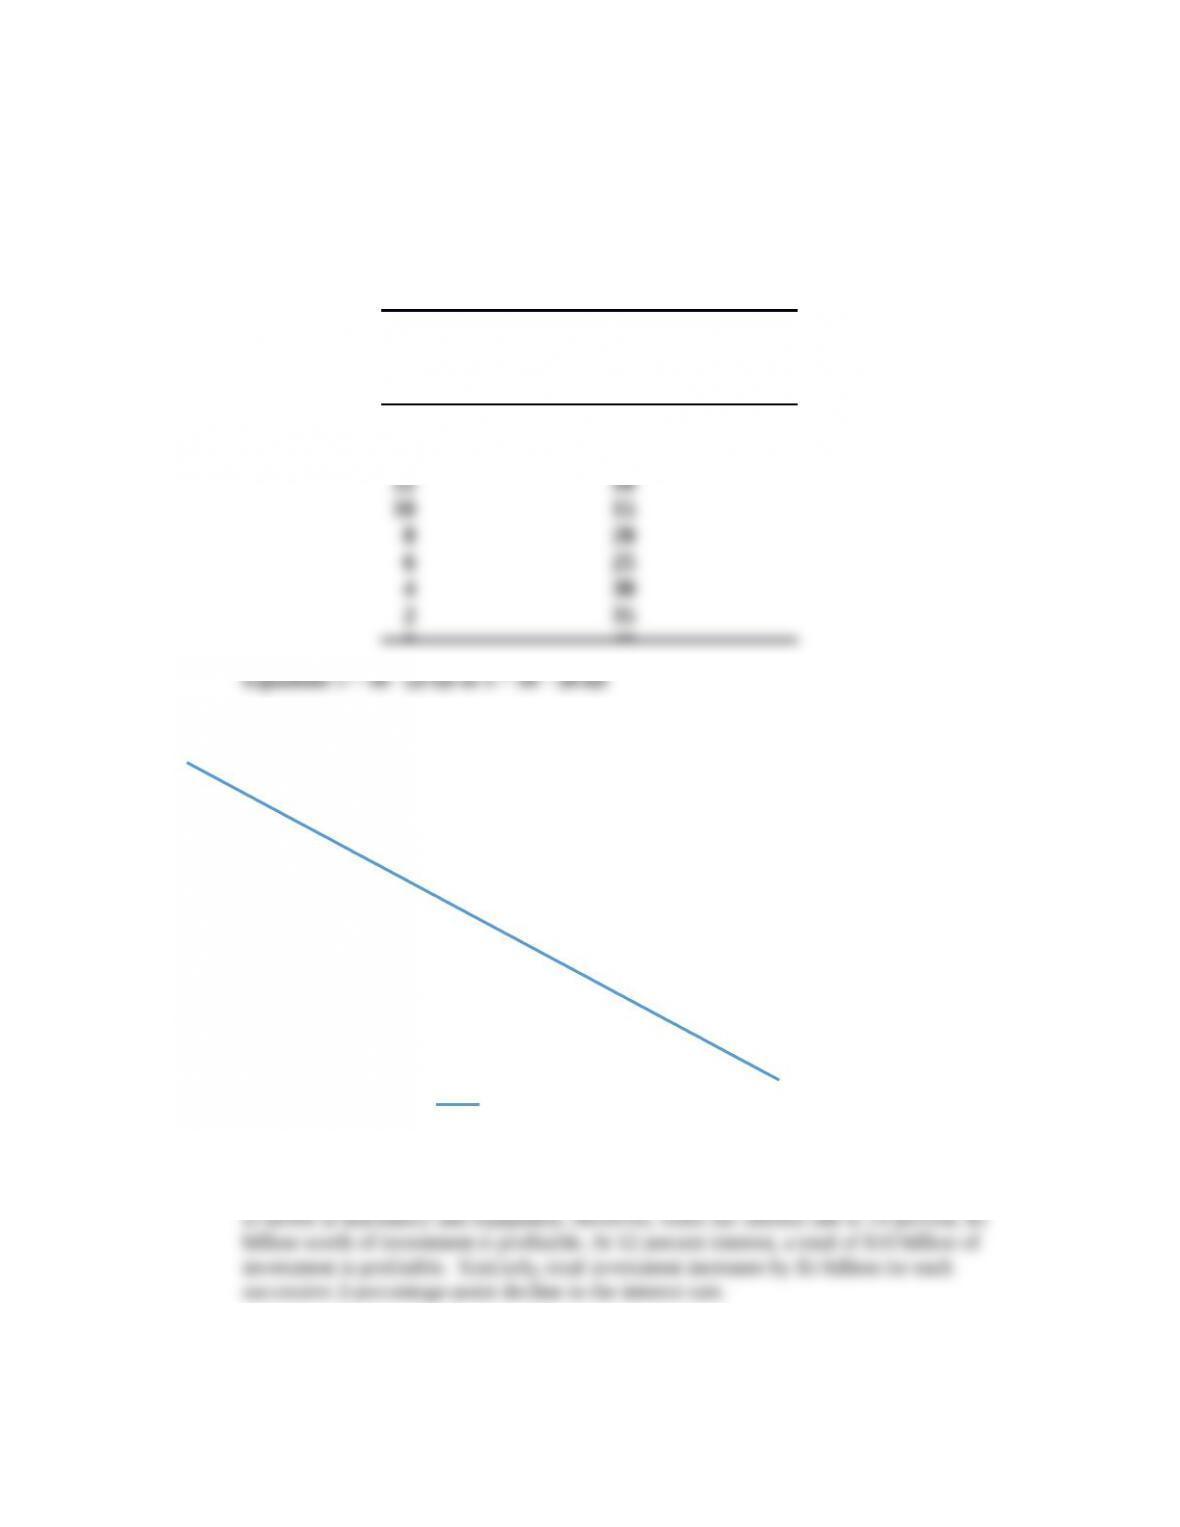
5. Suppose that when the interest rate on loans is 16 percent, businesses find it unprofitable to
invest in machinery and equipment. However, when the interest rate is 14 percent, $5 billion
worth of investment is profitable. At 12 percent interest, a total of $10 billion of investment is
profitable. Similarly, total investment increases by $5 billion for each successive 2-percentage-
1A-2
Copyright © 2015 McGraw-Hill Education. All rights reserved. No reproduction or distribution without the prior written
consent of McGraw-Hill Education.
Chapter 01 Appendix
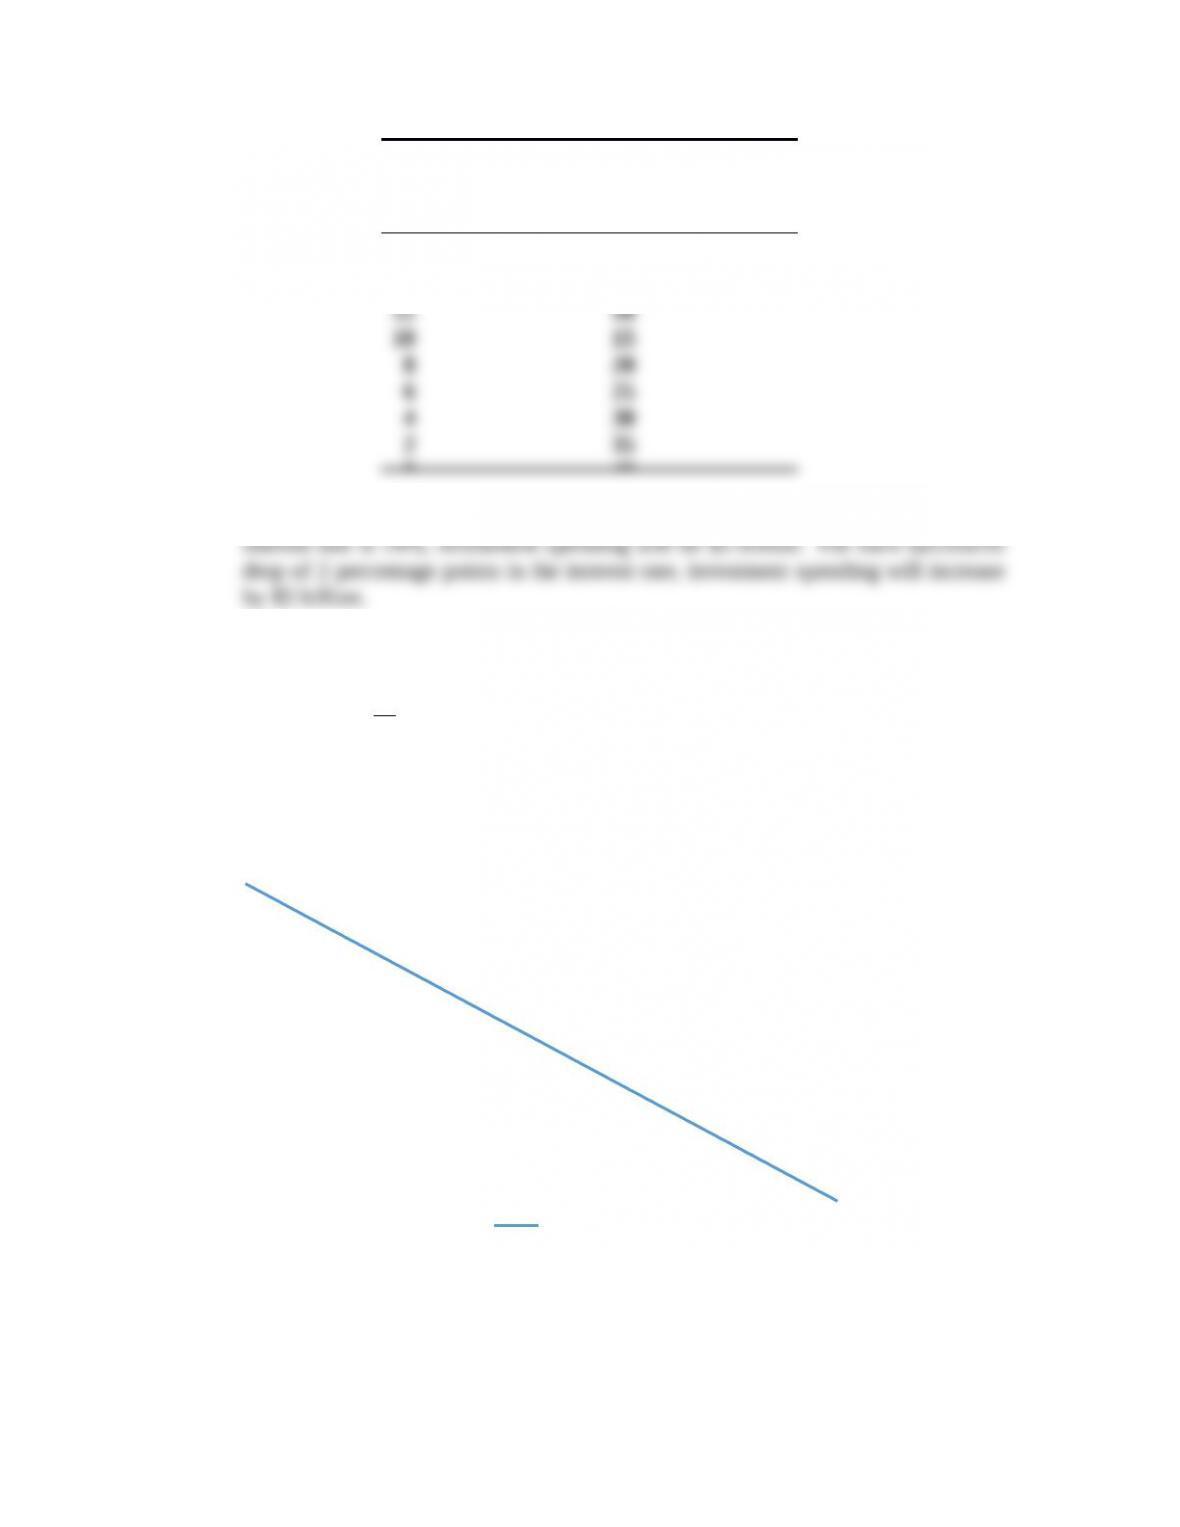
point decline in the interest rate. Describe the relevant relationship between the interest rate and
investment in a table, on a graph, and as an equation. Put the interest rate on the vertical axis and
investment on the horizontal axis. In your equation use the form i = a + bI , where i is the interest
rate, a is the vertical intercept, b is the slope of the line (which is negative), and I is the level of
investment. LO8
Answer:
Interest
rate
(in percent)
Amount of
investment
(billions of dollars)
16
14
$ 0
5
Interest Rate
Feedback: Consider the following data as an example:
Suppose that when the interest rate on loans is 16 percent, businesses find it unprofitable
1A-3
Copyright © 2015 McGraw-Hill Education. All rights reserved. No reproduction or distribution without the prior written
consent of McGraw-Hill Education.
Chapter 01 Appendix
Interest
rate
(in percent)
Amount of
investment
(billions of dollars)
16
14
$ 0
5
Chapter 01 Appendix
a. Are C and Y positively related or are they negatively related?
b. If graphed, would the curve for this equation slope upward or slope downward?
c. Are the variables C and Y inversely related or directly related?
d. What is the value of C if a = 10, b = .50, and Y = 200?
e. What is the value of Y if C = 100, a = 10, and b = .25?
Feedback:
(a) C and Y are positively related because the slope, b, is positive by assumption.
(b) The curve would slope upward because the slope is positive.
(c) C and Y are directly related because C and Y are positively related (move in
(d) Consider the following values: If a = 10, b = .50, and Y = 200, then C = 110. If
(e) Consider the following values: Y if C = 100, a = 10, and b = .25, then Y = 360.
If a = 10 and b = .25, then the consumption function takes the following form C =
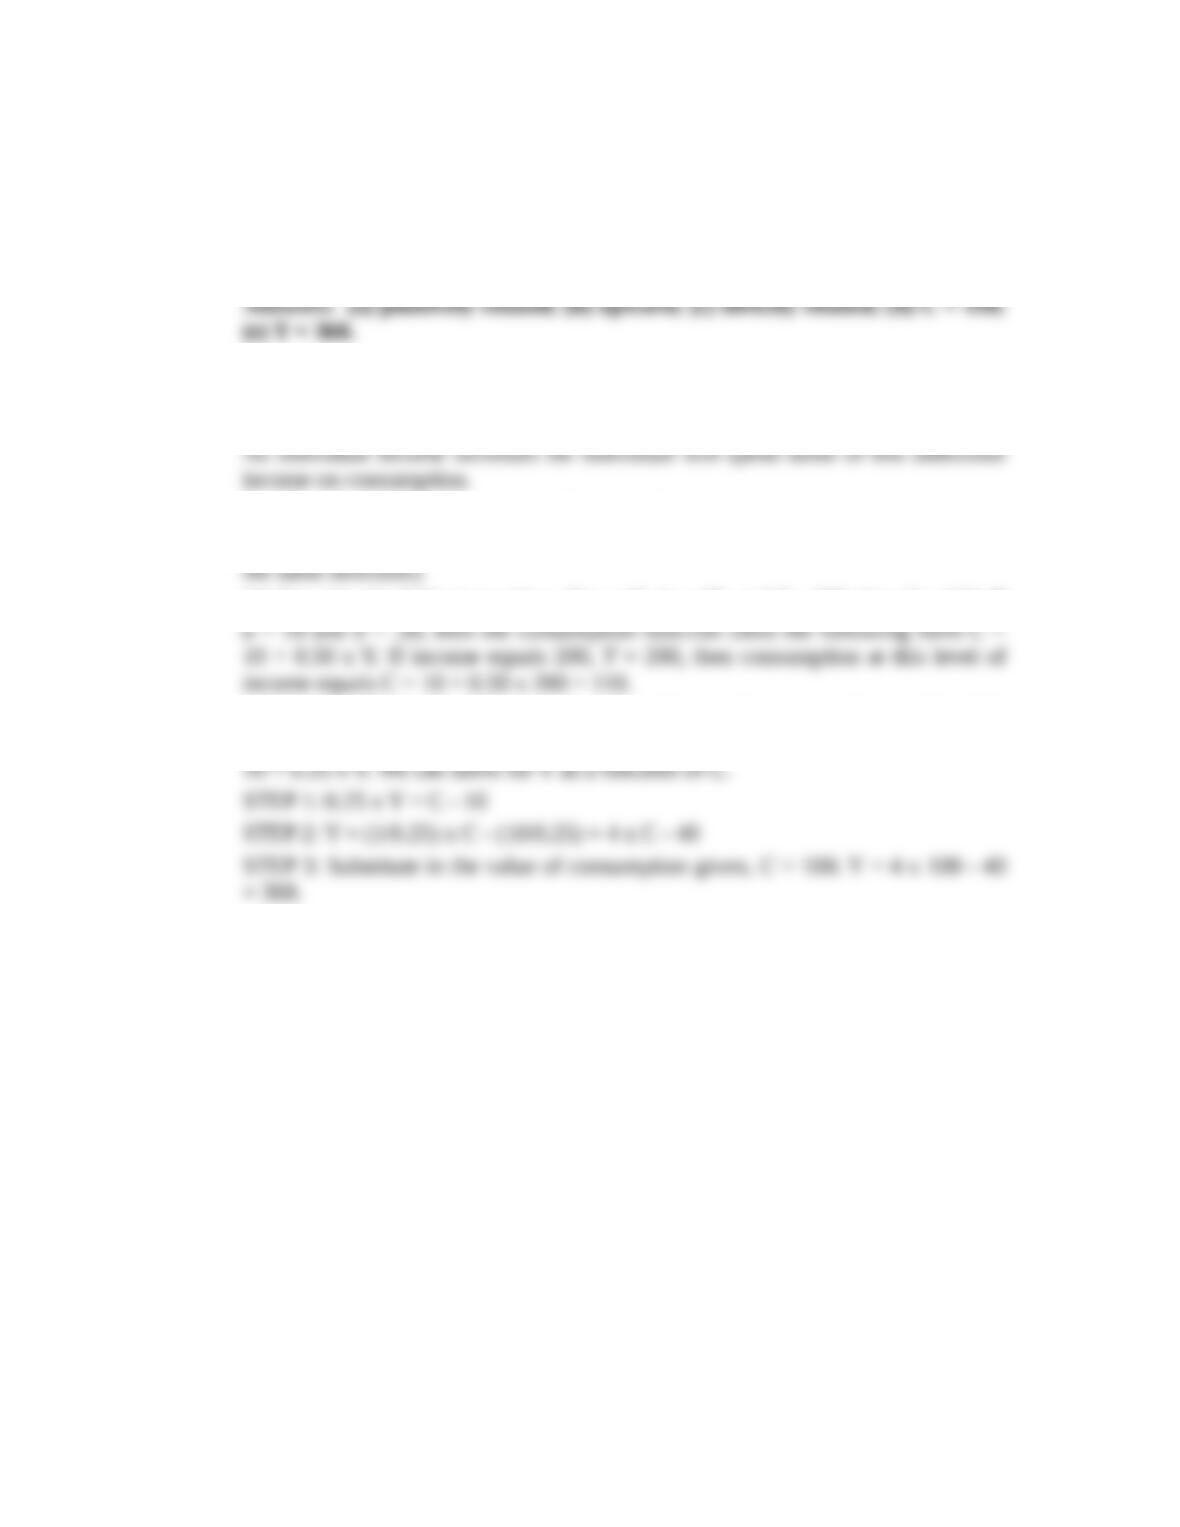
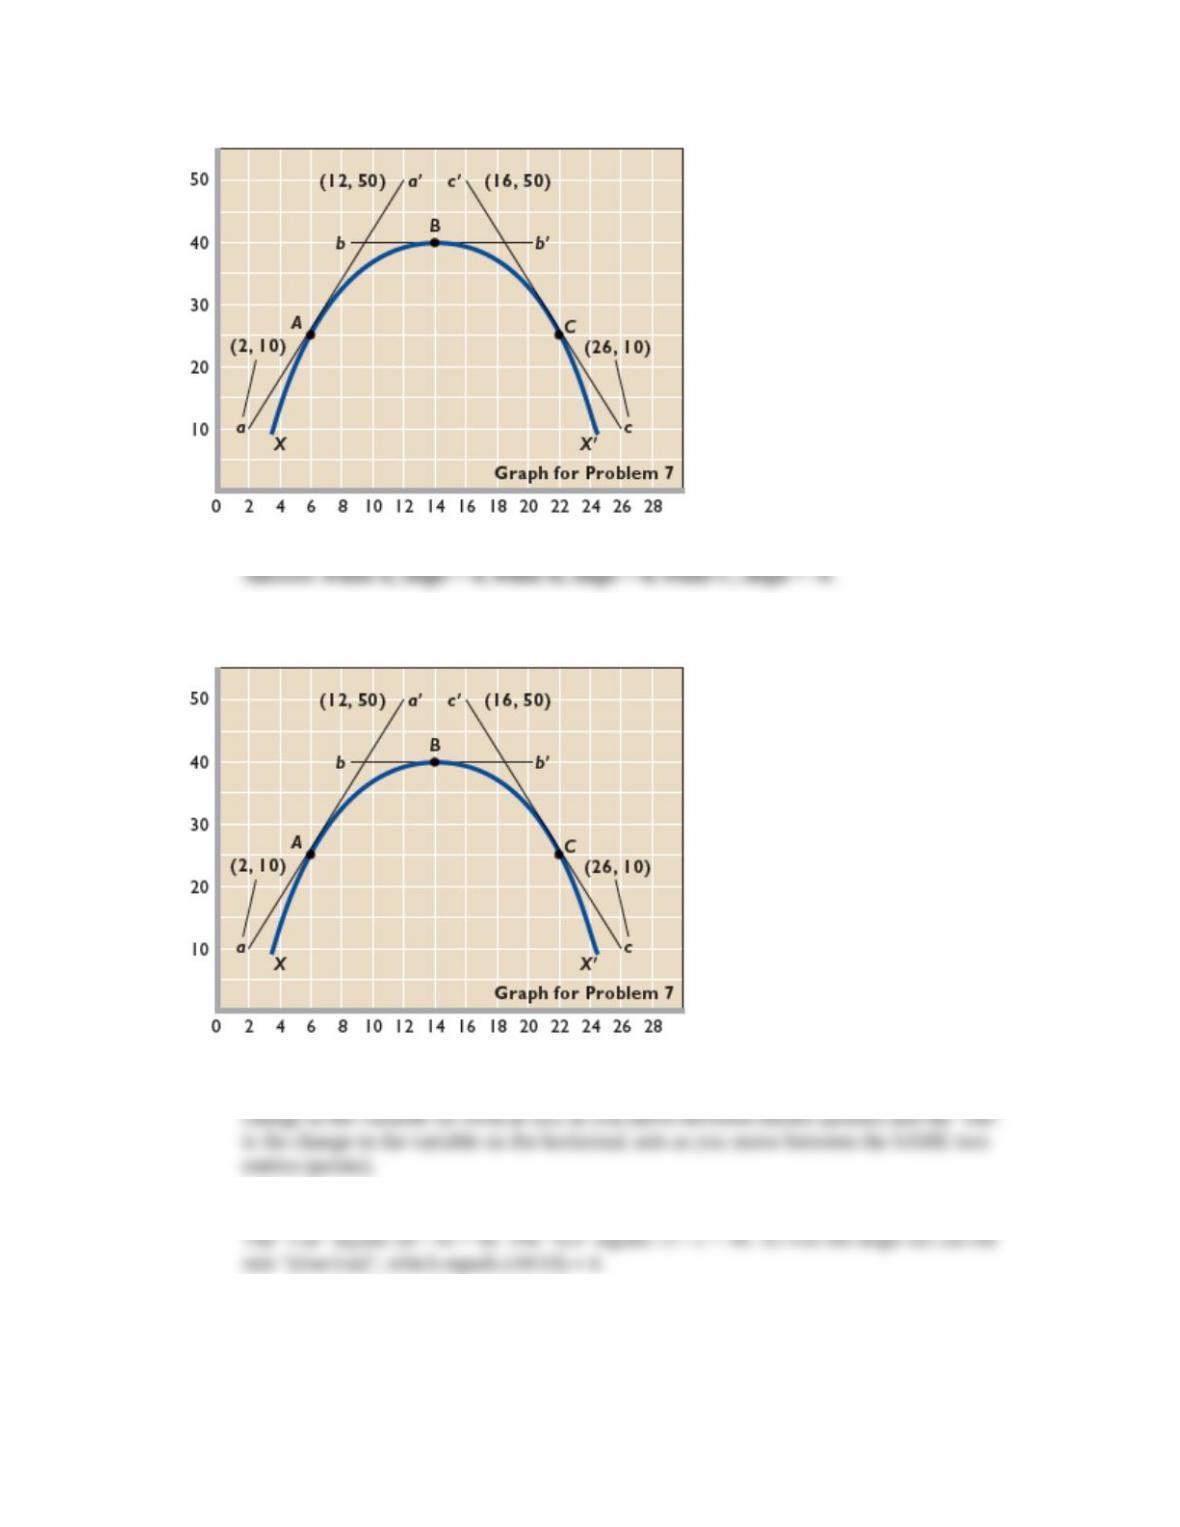
7. The accompanying graph shows curve XX’ and tangents at points A, B, and C . Calculate the
slope of the curve at these three points. LO8
1A-5
Copyright © 2015 McGraw-Hill Education. All rights reserved. No reproduction or distribution without the prior written
consent of McGraw-Hill Education.
Chapter 01 Appendix
Feedback: Consider the following figure as an example:
To calculate the slope of the function use the “rise-over-run” approach. The “rise” is the
Point A has a slope that equals 4. To see this we use the two entries (2,10) and (12,50).
Point B has a slope equal to zero. There is no “rise” here, so we do not need coordinates
to calculate this value.
1A-6
Copyright © 2015 McGraw-Hill Education. All rights reserved. No reproduction or distribution without the prior written
consent of McGraw-Hill Education.
Chapter 01 Appendix
Point C has a slope that equals -4. To see this we use the two entries (16,50) and (26,10).
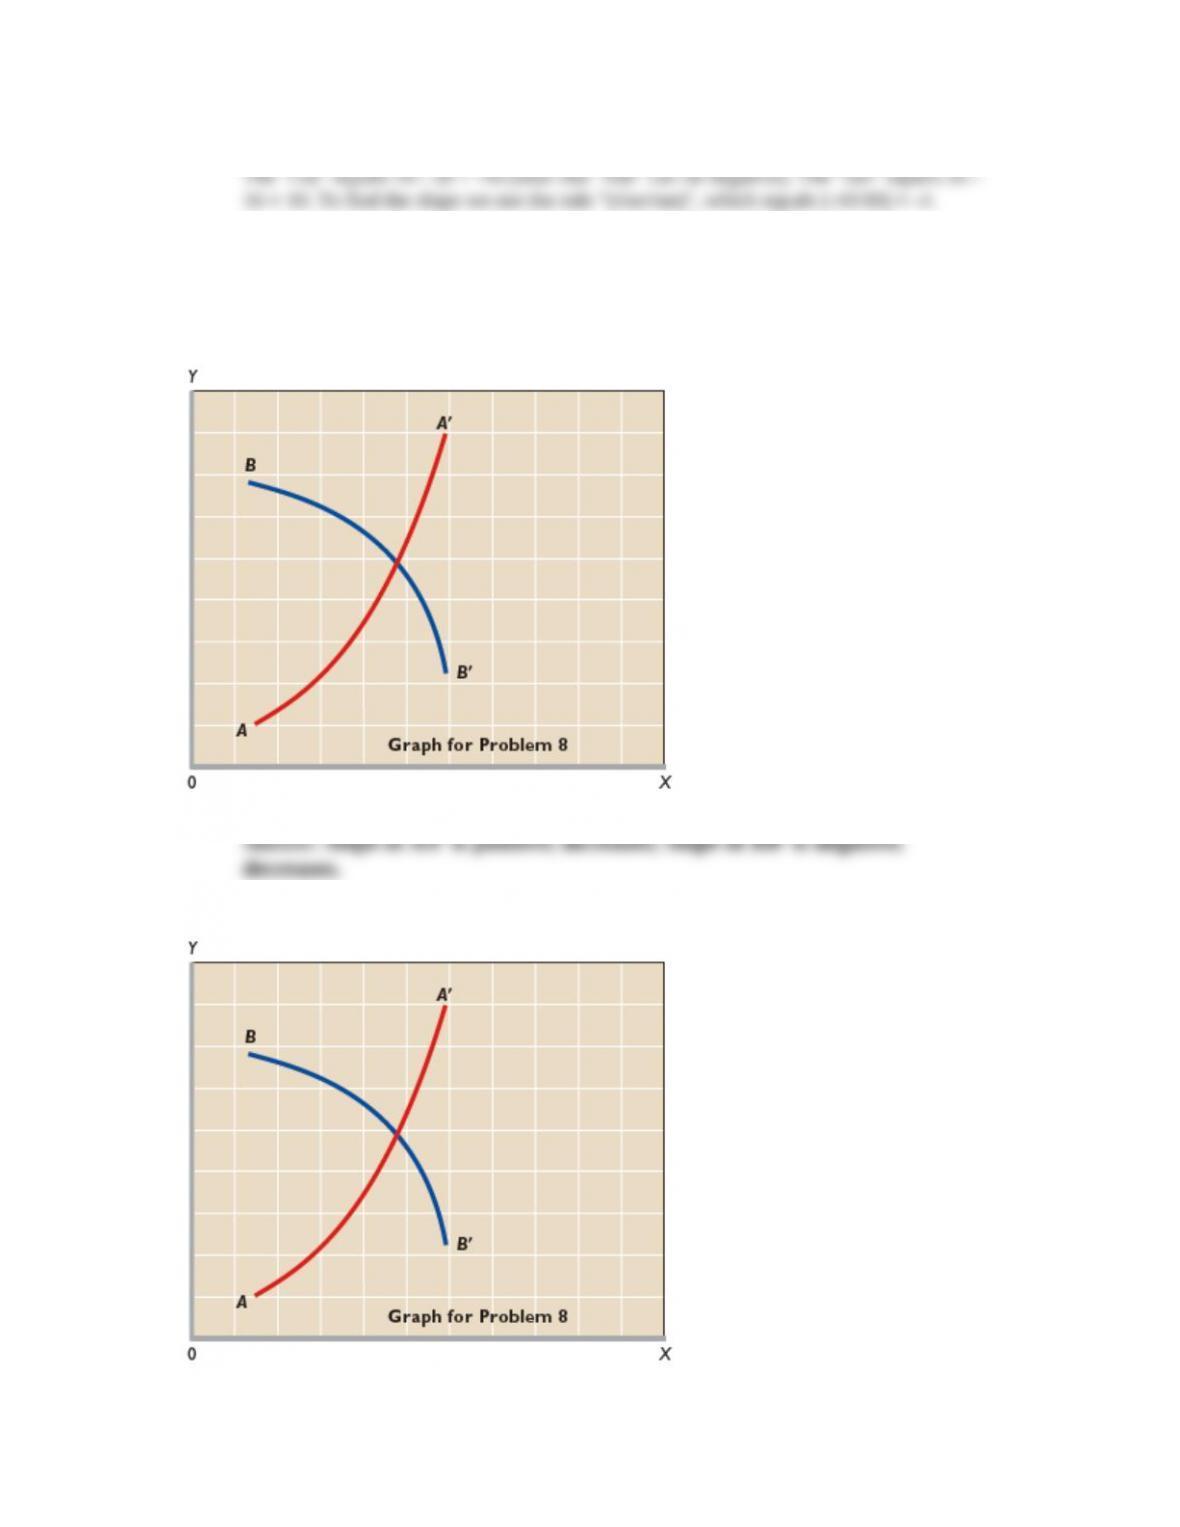
8. In the accompanying graph, is the slope of curve AA’ positive or negative? Does the slope
increase or decrease as we move along the curve from A to A’? Answer the same two questions
for curve BB’.
Feedback: Consider the following figure:
1A-7
Copyright © 2015 McGraw-Hill Education. All rights reserved. No reproduction or distribution without the prior written
consent of McGraw-Hill Education.

Chapter 01 Appendix
Slope of AA’ is positive (rising from left to right). The slope increases as we
Slope of BB’ is negative (dropping from left to right). The slope becomes more
1A-8
Copyright © 2015 McGraw-Hill Education. All rights reserved. No reproduction or distribution without the prior written
consent of McGraw-Hill Education.