Unlock document.
This document is partially blurred.
Unlock all pages and 1 million more documents.
Get Access
Chapter 07 - Capital Asset Pricing and Arbitrage Pricing Theory
1. The required rate of return on a stock is related to the required rate of return on the
2. An example of this scenario would be an investment in the SMB and HML. As of yet,
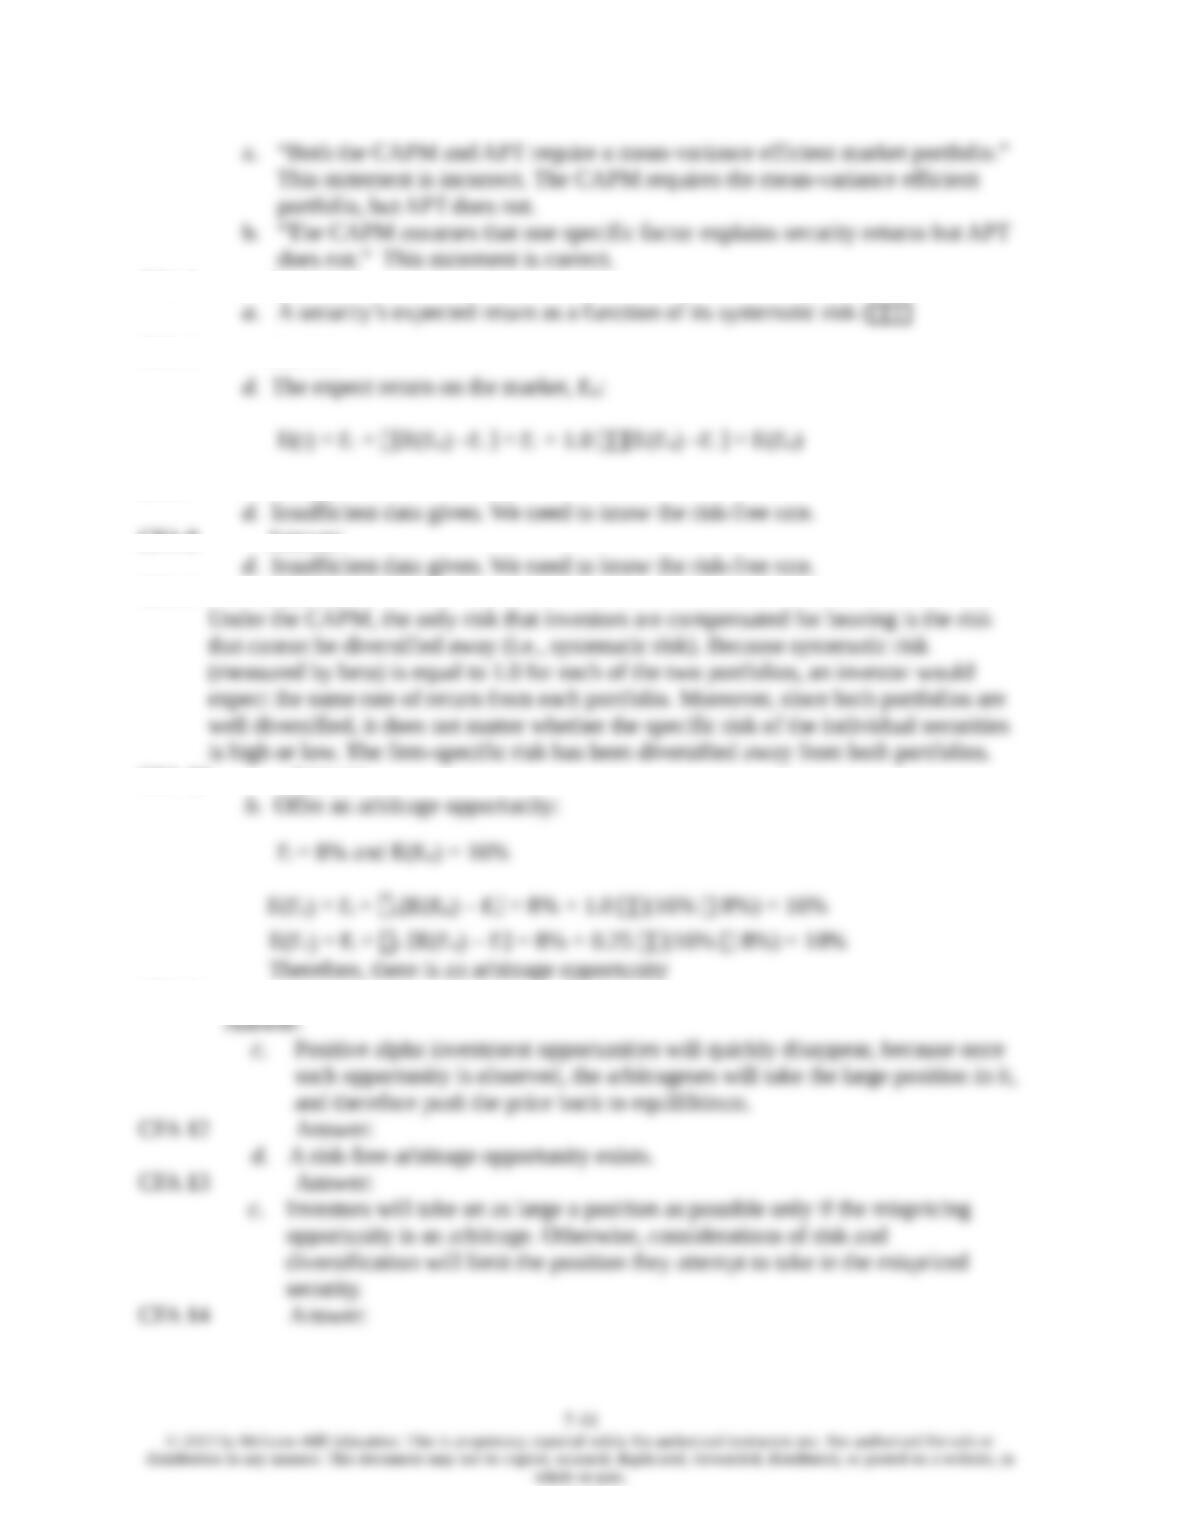
3. a. False. According to CAPM, when beta is zero, the “excess” return should be zero.
b. False. CAPM implies that the investor will only require risk premium for systematic
4. E(r) = rf + β [E(rM) – rf ] , rf = 4%, rM = 6%
5. $1 Discount Store is overpriced; Everything $5 is underpriced.
6. a. 15%. Its expected return is exactly the same as the market return when beta is 1.0.
7. Statement a is most accurate.
The flaw in statement b is that beta represents only the systematic risk. If the firm-
8. The APT may exist without the CAPM, but not the other way. Thus, statement a is
9. E(rp) = rf + β [E(rM) – rf ] Given rf = 5% and E(rM)= 15%, we can calculate
20% = 5% + (15% – 5%) = 1.5
10. If the beta of the security doubles, then so will its risk premium. The current risk
premium for the stock is: (13% – 7%) = 6%, so the new risk premium would be 12%,
and the new discount rate for the security would be: 12% + 7% = 19%
If the stock pays a constant dividend in perpetuity, then we know from the original data
11. The cash flows for the project comprise a 10-year annuity of $10 million per year plus an
additional payment in the tenth year of $10 million (so that the total payment in the tenth
year is $20 million). The appropriate discount rate for the project is:
12.
a. The beta is the sensitivity of the stock's return to the market return, or, the
change in the stock return per unit change in the market return. We denote the
5 - 20
D =
3.5 - 14
5 - 20
= 0.70
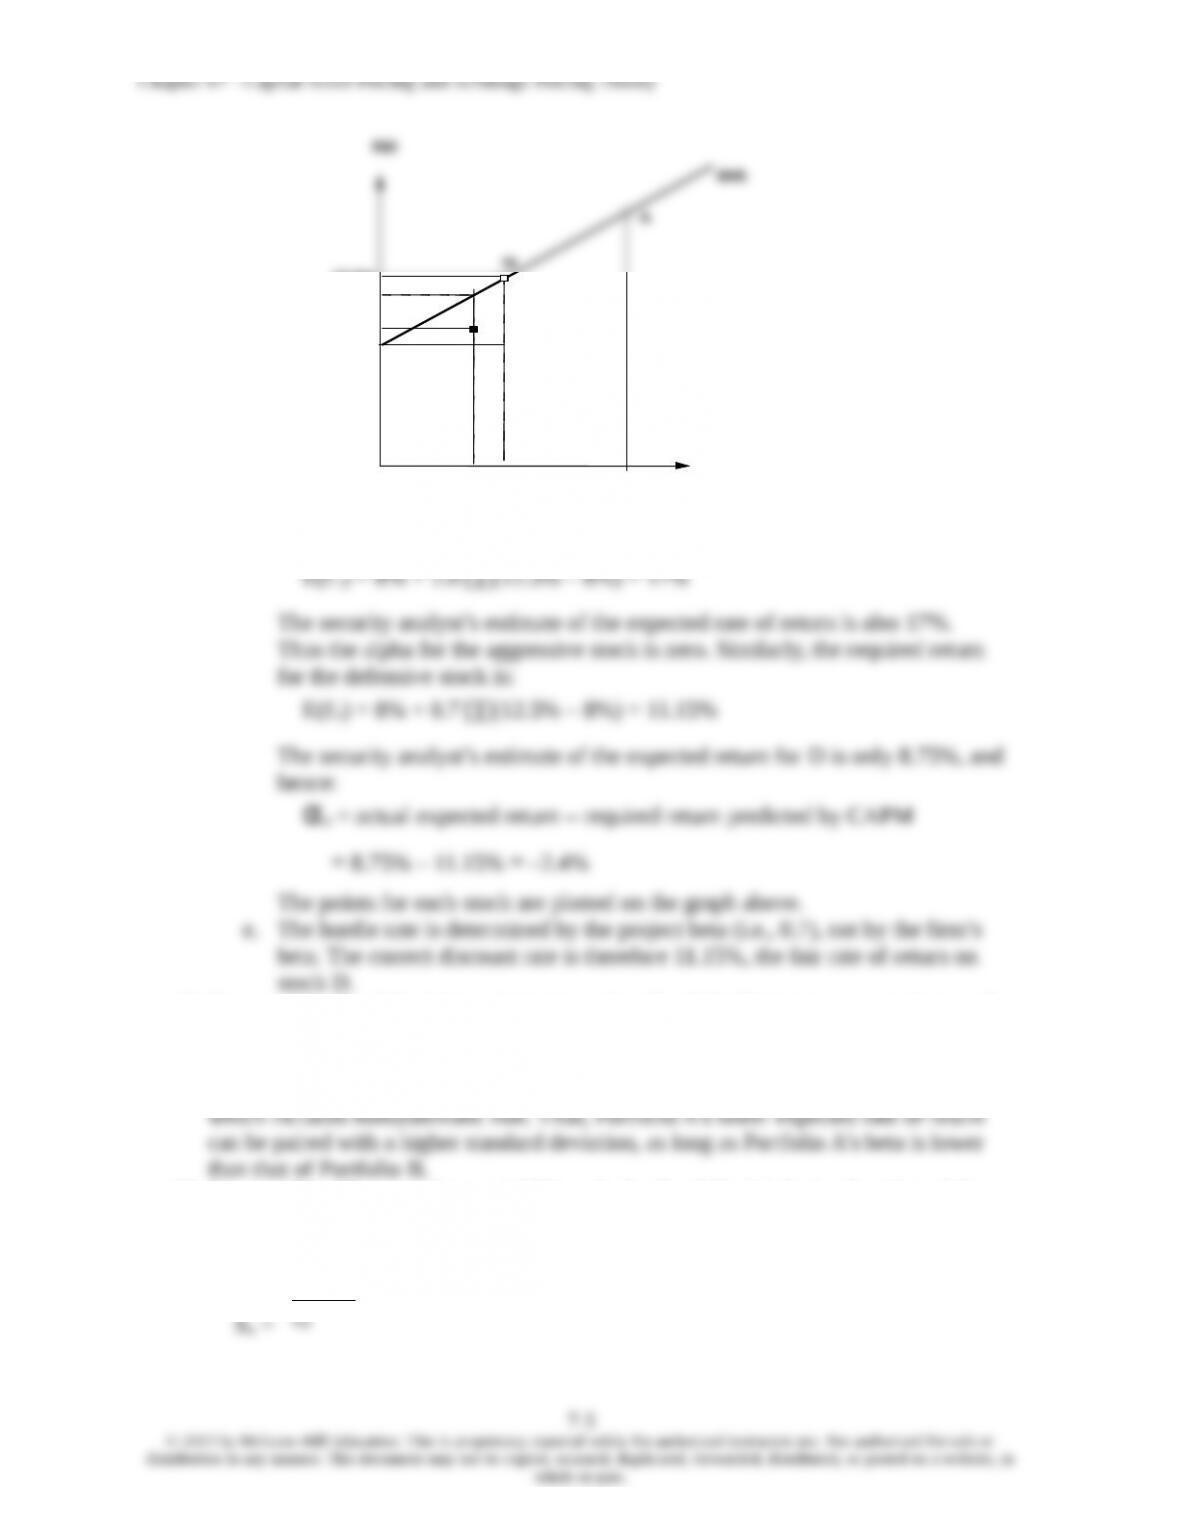
0.5 (20% + 5%) = 12.5% Thus, we graph the SML as following:
7-2
15. Not possible. The reward-to-variability ratio for Portfolio A is better than that of the
market, which is not possible according to the CAPM, since the CAPM predicts that the
market portfolio is the most efficient portfolio. Using the numbers supplied:
16−10
12 =0 . 5
7-3
© 2013 by McGraw-Hill Education. This is proprietary material solely for authorized instructor use. Not authorized for sale or
distribution in any manner. This document may not be copied, scanned, duplicated, forwarded, distributed, or posted on a website, in
whole or part.
16. Not possible. Portfolio A clearly dominates the market portfolio. It has a lower standard
deviation with a higher expected return.
17. Not possible. Given these data, the SML is: E(r) = 10% + β(18% – 10%)
A portfolio with beta of 1.5 should have an expected return of:
18. Not possible. The SML is the same as in Problem 18. Here, the required expected return
19. Possible. Portfolio A's ratio of risk premium to standard deviation is less attractive
20.
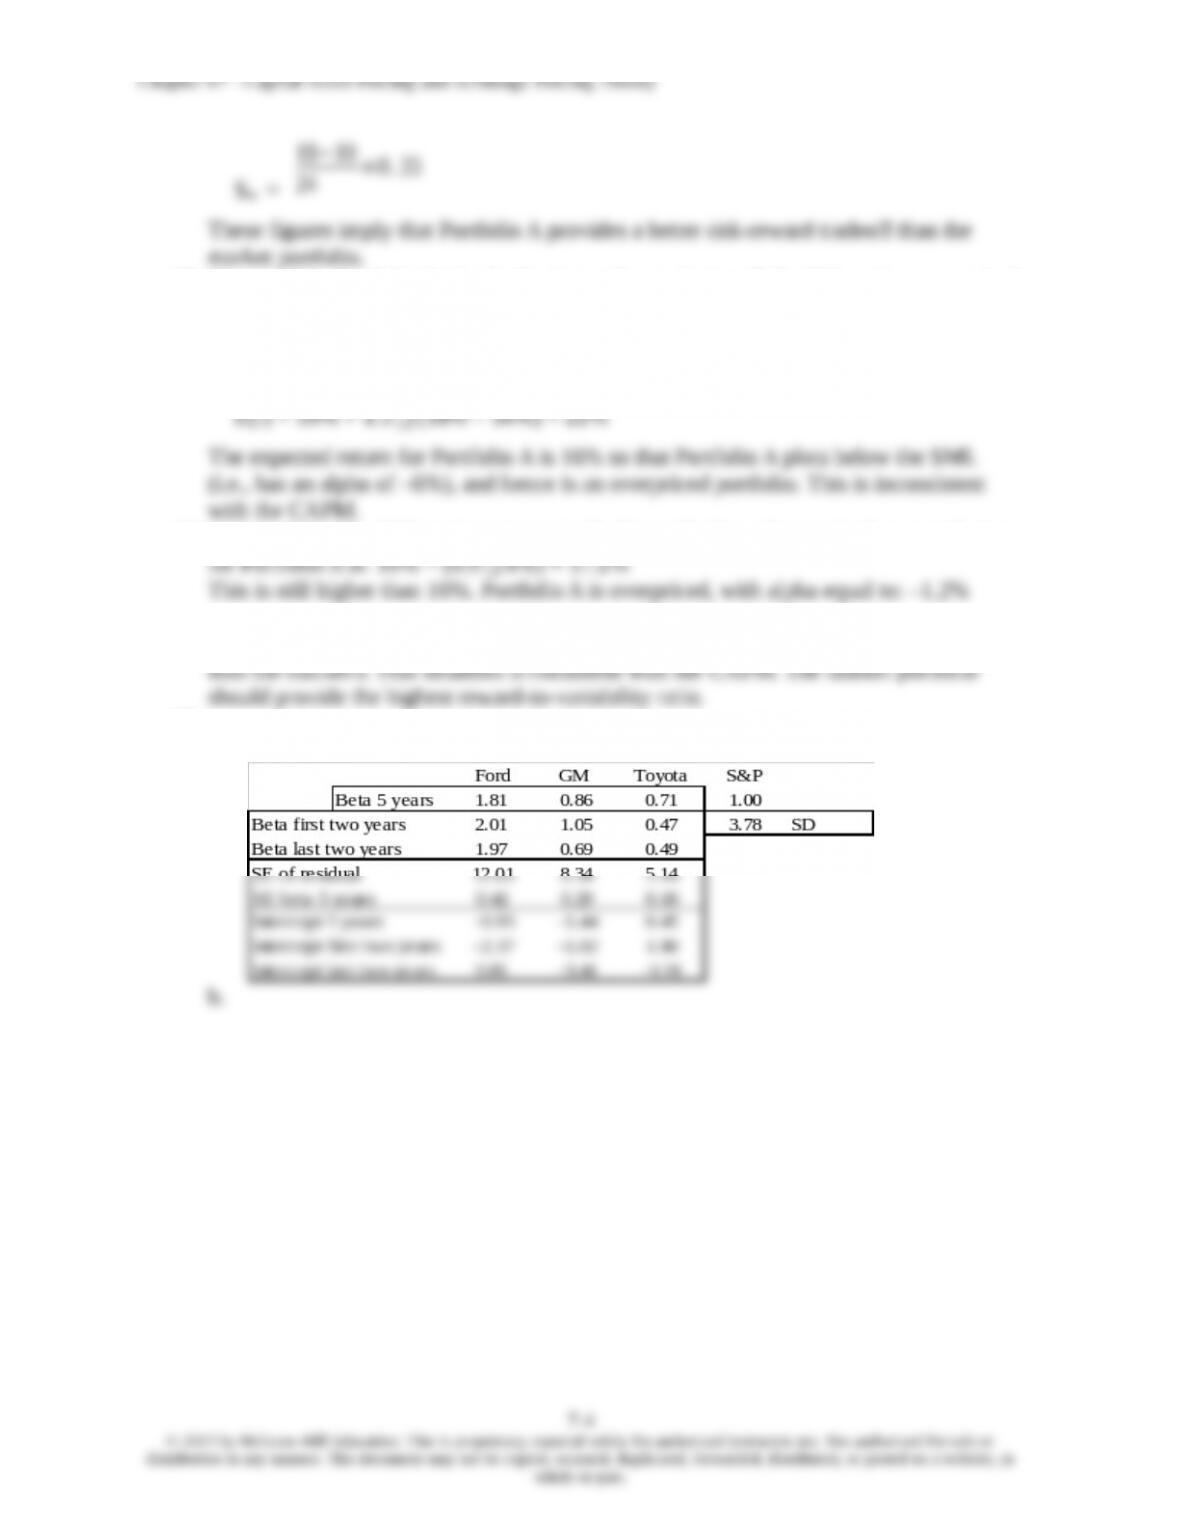
a.
observations for both quadrants will be steeper. The same logic explains part of the
behavior of subperiod betas for Ford and GM.
21. Since the stock's beta is equal to 1.0, its expected rate of return should be equal to that
of the market, that is, 18%.
D+P1
−¿P0
P0
22. If beta is zero, the cash flow should be discounted at the risk-free rate, 8%:
PV = $1,000/0.08 = $12,500
23. Using the SML: 6% = 8% + β(18% – 8%) β= –2/10 = –0.2
24. We denote the first investment advisor 1, who has r1 = 19% and 1 = 1.5, and the
second investment advisor 2, as r2 = 16% and 2 = 1.0. In order to determine which
investor was a better selector of individual stocks, we look at the abnormal return,
which is the ex-post alpha; that is, the abnormal return is the difference between the
α1 =19% – [3% + 1.5 (15% – 3%)] = 19% – 21% = –2%
α2 = 16% – [3%+ 1.0 (15% – 3%)] = 16% – 15% = 1%
Here, not only does the second investment adviser appear to be a better stock
selector, but the first adviser's selections appear valueless (or worse).
25.
a. Since the market portfolio, by definition, has a beta of 1.0, its expected rate of
return is 12%.
b. β= 0 means the stock has no systematic risk. Hence, the portfolio's expected
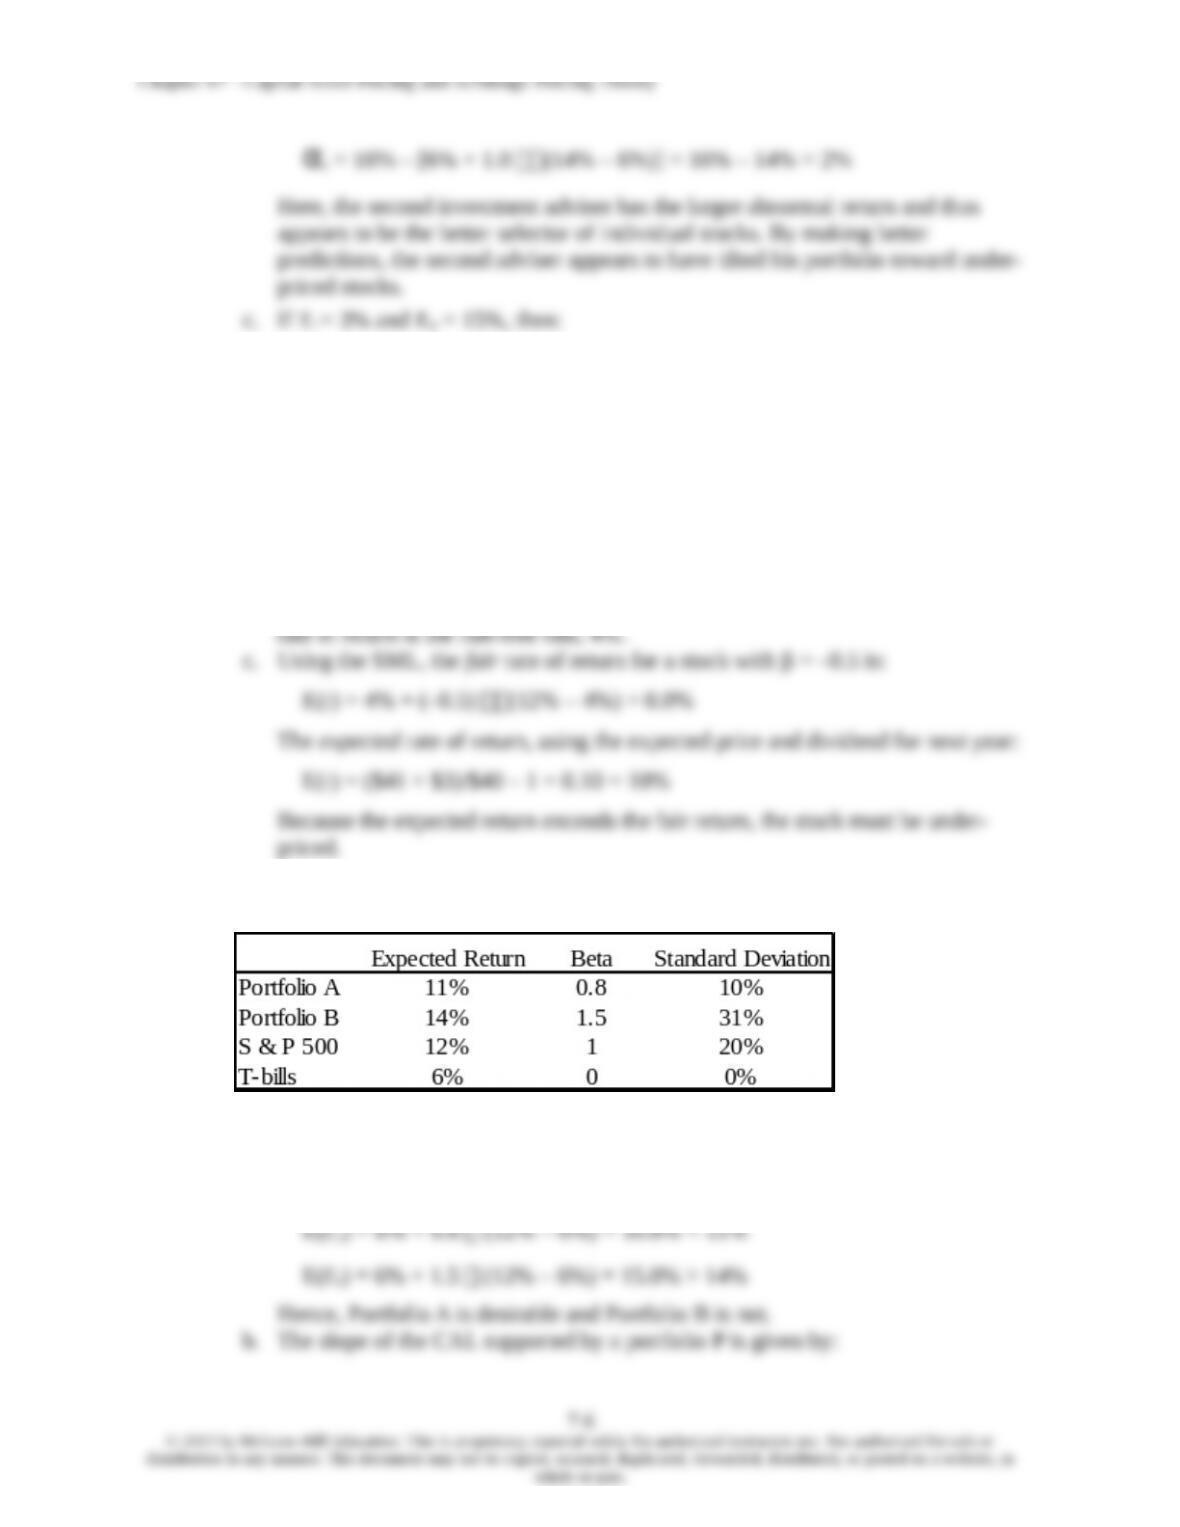
26. The data can be summarized as follows:
a. Using the SML, the expected rate of return for any portfolio P is:
E(rP) = rf + [E(rM) –rf ]
Substituting for portfolios A and B:
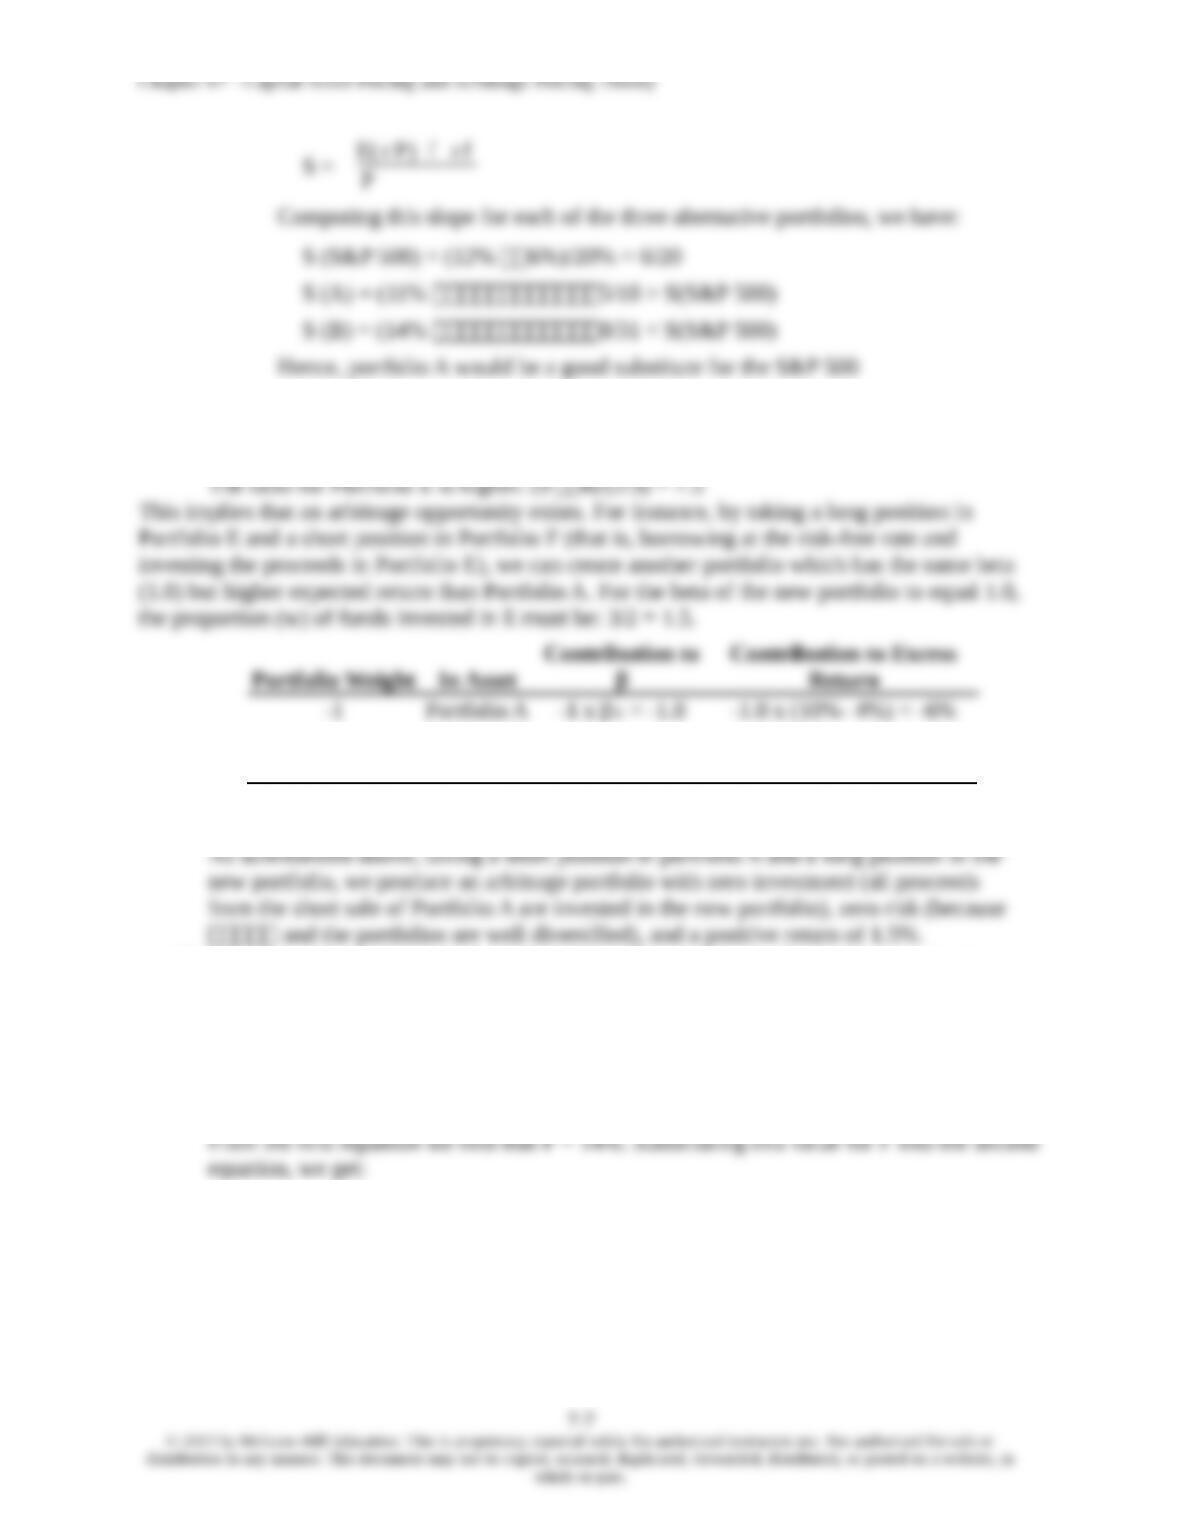
27. Since the beta for Portfolio F is zero, the expected return for Portfolio F equals the
risk-free rate.
For Portfolio A, the ratio of risk premium to beta is: (10 4)/1 = 6
1.5 Portfolio E 1.5 x βE = 1.0 1.5 x (9% - 4%) = 7.5%
-0.5 Portfolio F -0.5 x 0 = 0 0
Investment = 0 βArbitrage = 0 α = 1.5%
28. Substituting the portfolio returns and betas in the mean-beta relationship, we obtain two
equations in the unknowns, the risk-free rate (rf) and the factor return (F):
14.0% = rf + 1 (F – rf )
14.8% = rf + 1.1 (F – rf )
14.8% = rf + 1.1 (14% – rf ) rf = 6%
29.
Chapter 07 - Capital Asset Pricing and Arbitrage Pricing Theory
a. Shorting equal amounts of the 10 negative-alpha stocks and investing the proceeds
= $1,000,000 0.06 = $60,000
The sensitivity of the payoff of this portfolio to the market factor is zero because the
exposures of the positive alpha and negative alpha stocks cancel out. (Notice that
the terms involving RM sum to zero.) Thus, the systematic component of total risk
also is zero. The variance of the analyst's profit is not zero, however, since this
20 [(100,000 0.30)2] = 18,000,000,000
The standard deviation of dollar returns is $134,164.
b. If n = 50 stocks (i.e., 25 long and 25 short), $40,000 is placed in each position,
and the variance of dollar returns is:
50 [(40,000 0.30)2] = 7,200,000,000
Notice that when the number of stocks increases by a factor of 5 (from 20 to 100),
standard deviation falls by a factor of
¿
= 2.236, from $134,164 to $60,000.
30. Any pattern of returns can be "explained" if we are free to choose an indefinitely large
31. The APT factors must correlate with major sources of uncertainty, i.e., sources of
uncertainty that are of concern to many investors. Researchers should investigate
factors that correlate with uncertainty in consumption and investment opportunities.
Chapter 07 - Capital Asset Pricing and Arbitrage Pricing Theory
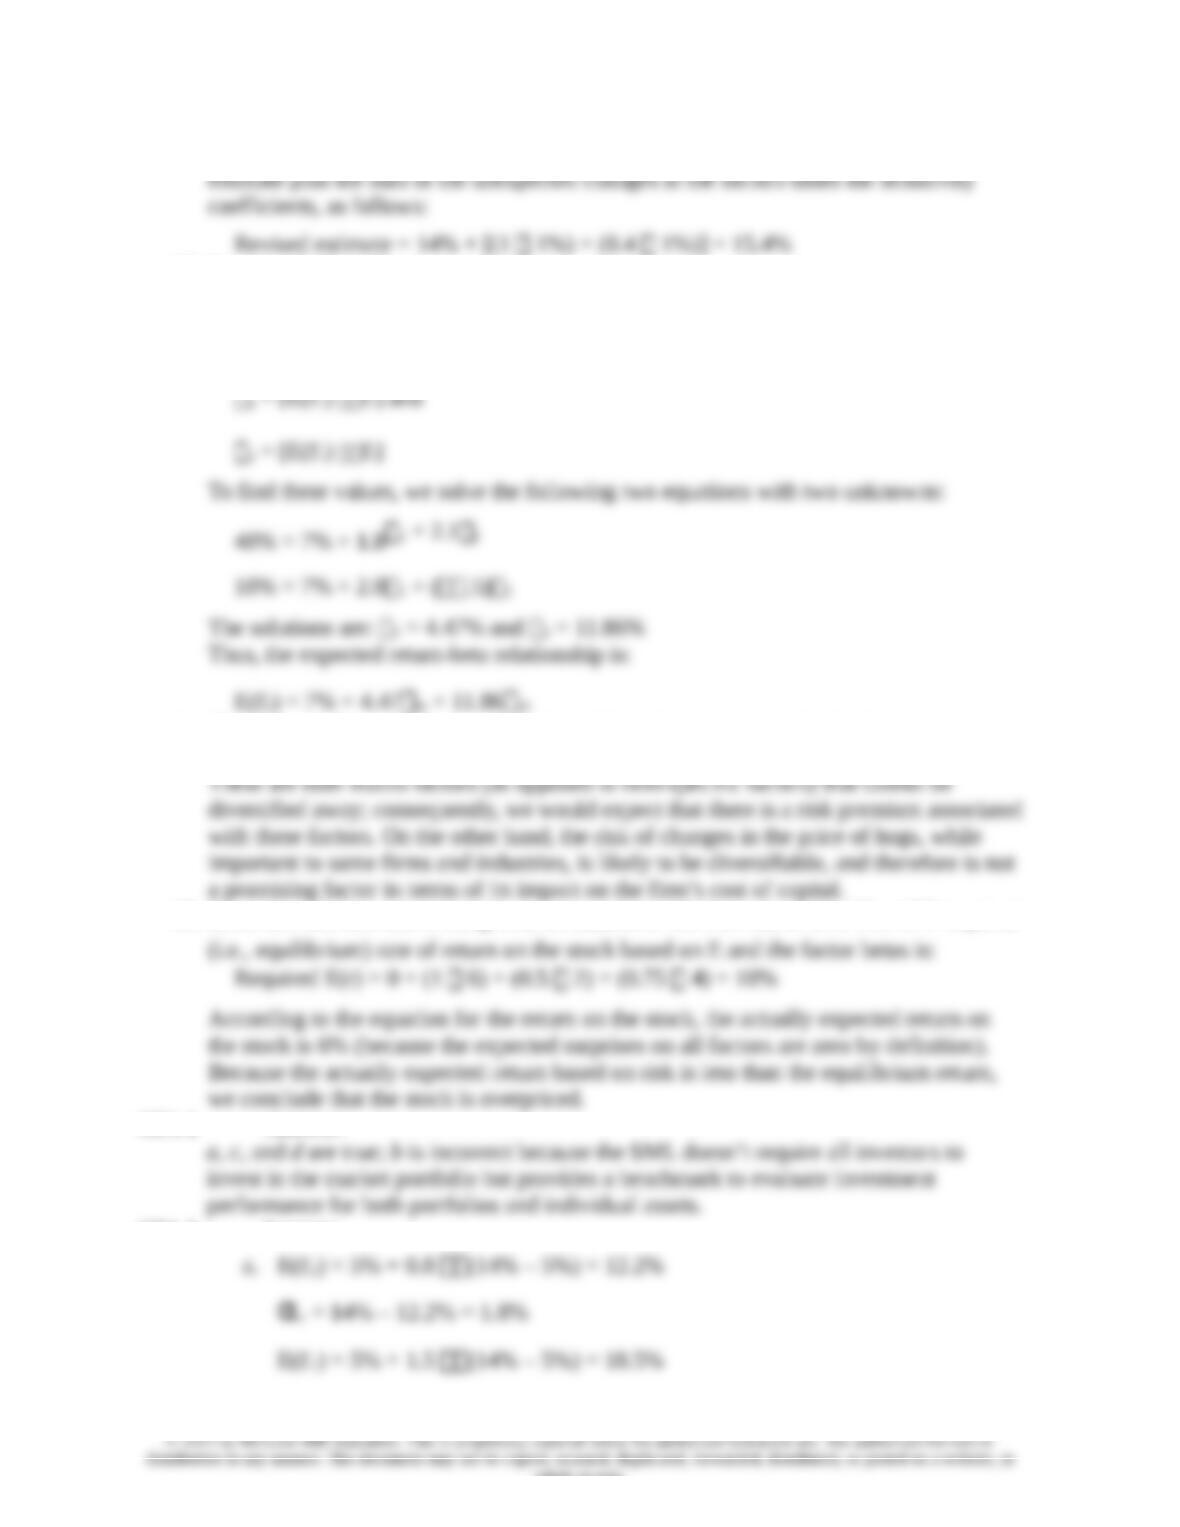
32. The revised estimate of the expected rate of return of the stock would be the old
33. Equation 7.11 applies here:
E(rP) = rf + P1 [E(r1) rf] + P2 [E(r2) – rf]
We need to find the risk premium for these two factors:
34. The first two factors (the return on a broad-based index and the level of interest rates)
are most promising with respect to the likely impact on Jennifer’s firm’s cost of capital.
35. Since the risk free rate is not given, we assume a risk free rate of 0%. The APT required
CFA 2 Answer:
7-9
whole or part.
Chapter 07 - Capital Asset Pricing and Arbitrage Pricing Theory
αY = 17% – 18.5% = –1.5%
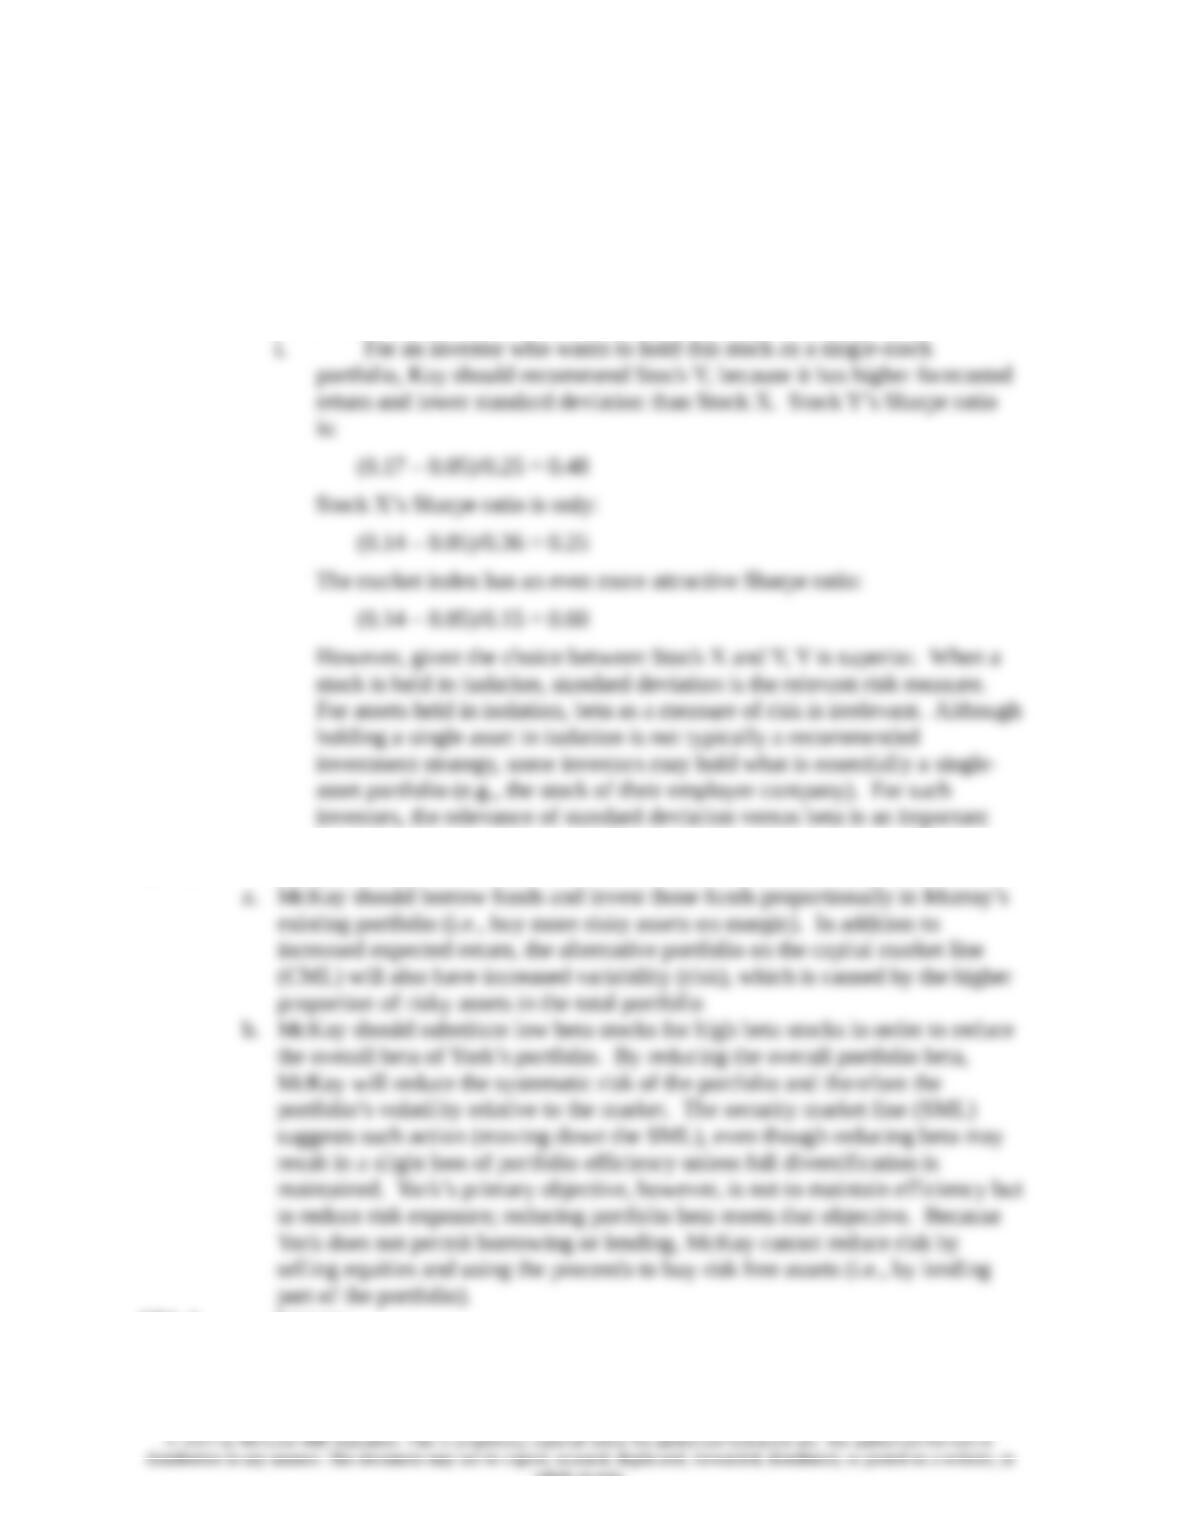
b. For an investor who wants to add this stock to a well-diversified equity
portfolio, Kay should recommend Stock X because of its positive alpha, while
Stock Y has a negative alpha. In graphical terms, Stock X’s expected return/risk
profile plots above the SML, while Stock Y’s profile plots below the SML.
Also, depending on the individual risk preferences of Kay’s clients, Stock X’s
lower beta may have a beneficial impact on overall portfolio risk.
issue.
CFA 3 Answer:
CFA 4 Answer:
7-10
whole or part.
Chapter 07 - Capital Asset Pricing and Arbitrage Pricing Theory
CFA 5 Answer:
CFA 6 Answer:
CFA 7 Answer:
CFA 8 Answer:
CFA 9 Answer:
CFA 10 Answer:
CFA 11