Teaching Notes
chapter, general concepts of control such as the design of quality control systems, process quality
tools of quality control for continuous improvement are discussed next. Two techniques for
Then Six Sigma is described along with Six Sigma and Lean. The chapter is completed with a
4. Pros:
– Workers may produce fewer defects when they know an inspector will not be
inspecting their work because of a greater sense of responsibility.
– Workers may gain more job satisfaction (and perhaps less absenteeism and
turnover) when they inspect their own work.
– It may be less costly to have workers inspect their own work.
5. Most production processes are not in statistical control when first sampled for control chart
purposes because unnecessary variability is occurring beyond the level of unavoidable,
natural process variability. This undue variation must be traced back to its sources such as
lax procedures, untrained operators, and improper machine maintenance. By isolating
these sources, the process can be brought under statistical control where the remaining
variation is due to random combinations of unknown factors.
6. The sample size and frequency of a sampling procedure must both be evaluated. For
variable control charts, a sample size in the range of 3 to 10 is frequently acceptable since
variable measurement provides considerable information in each measurement. In this
case, a suggested n = 6 may well be adequate.
An attribute control chart, on the other hand, requires fairly large samples, frequently in
7. The purpose of continuous improvement of quality is to reduce the variability of the
product or process by solving problems or changing the design of the product or process
itself. Through continuous improvement more consistent products are produced and less
waste is incurred.
8. A Pareto chart identifies the many modes of failure and their relative frequency of
occurrence, allowing the problem solver to prioritize problem solving based on the
importance of the problem or the ease or cost of implementing a solution.
9. a. Pareto Chart d. R chart
b. Cause-Effect Diagram e. All of the techniques
c. X-Bar and R chart or p chart f. All of the techniques
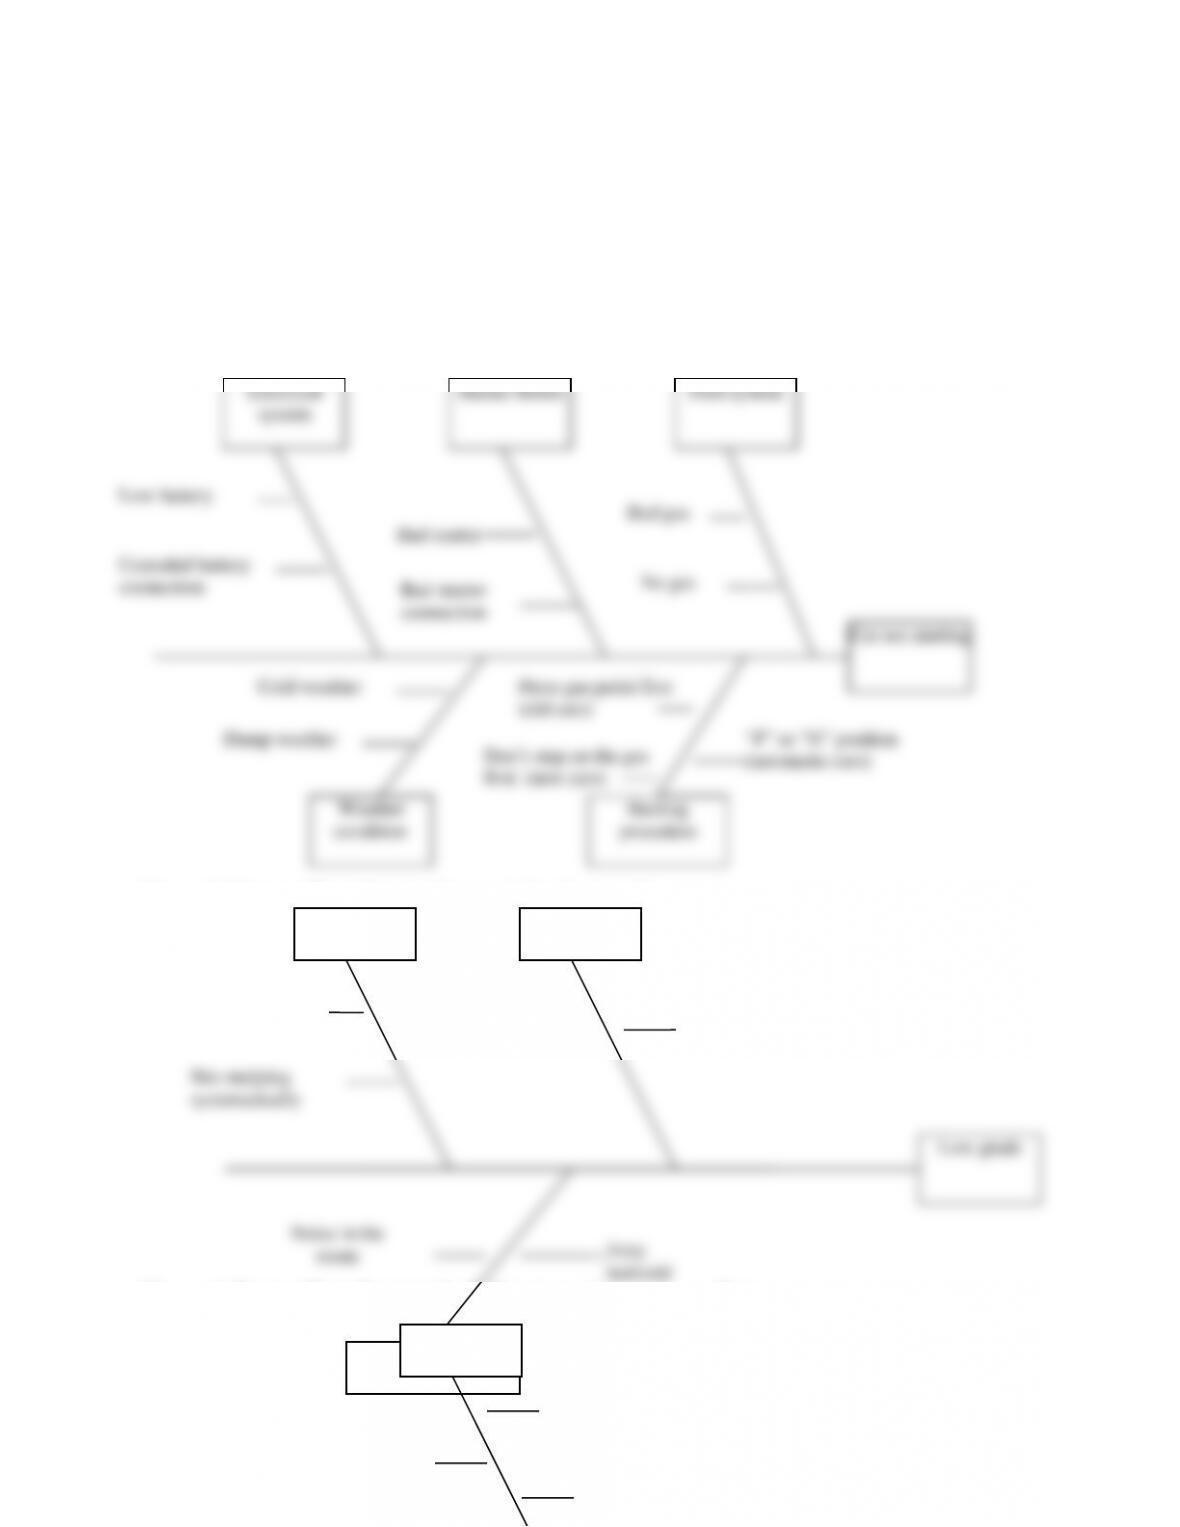
10. a) Cause-effect diagram for car not starting in the morning
10. b) Cause-effect diagram for receiving low grade
10. c) Cause-effect diagram for failing to graduate from college.
Electrical
system
Fuel system
Starter Motor
Low battery
Bad gas
Bad formulation of
the problem/test
Student
Environment
Teacher
Fatigue
Student
Not enough
effort
Personal
problems
11. First, Six Sigma is a metric because it is based on measuring quality variables that are
critical to the customer. Specific metrics include process sigma, x-times improvement, and
process yield. Second, it is a process improvement tool because it prescribes specific steps
to improve the measures. For example, DMAIC are the steps used by many Six Sigma
organizations. Third, it is a philosophy because the implementation requires a change in
the organizational culture and top management leadership. The philosophy includes how
12. Define – Specify the project including the process to be improved, the improvement team,
time schedule, etc.
Measure — Measuring quality variables (for illustration assume the following measures
are important to the customer):
a. Average time to order
13. Six Sigma implementation improves quality and products/services and processes and also
increases profits for the organization. There are, however, possible problems in the process
of implementation such as lack of senior management leadership, not enough training on
Six Sigma, and the specialists involved in the implementation are not devoted full-time.
14. Lean and Six Sigma can work together in making process improvement by attacking both
complex and simple problems. Six Sigma is useful in attacking complex problems that
might require sophisticated statistical tools, a full-time black-belt trained project leader,
and up to six months of work aimed at reducing process variance. On the other hand, lean
can be used to quickly attack less complex problems in a week or less using Kaizen, with
less sophisticated tools aimed at improving process flow and eliminating waste (non-value
15. If an organization were using neither lean or Six Sigma, you could decide on which
approach to use first depending on the type of problems that you have. If the problems are
very complex and are related to variance reduction, then Six Sigma is the preferred
approach. On the other hand, if quality is already high but there is substantial waste in the
system then lean should be used to improve the flow and reduce waste, provided the
problems are not too complex. It would probably be best to implement either one of these
1. a. The sample size used to determine the historical proportion defect rate over 100 days
was 1,000. The number 100 is irrelevant for calculations; 100 days were simply used to
observe the process. In the future, 500 is the appropriate sample size each day that should
used to calculate control limits as shown below.
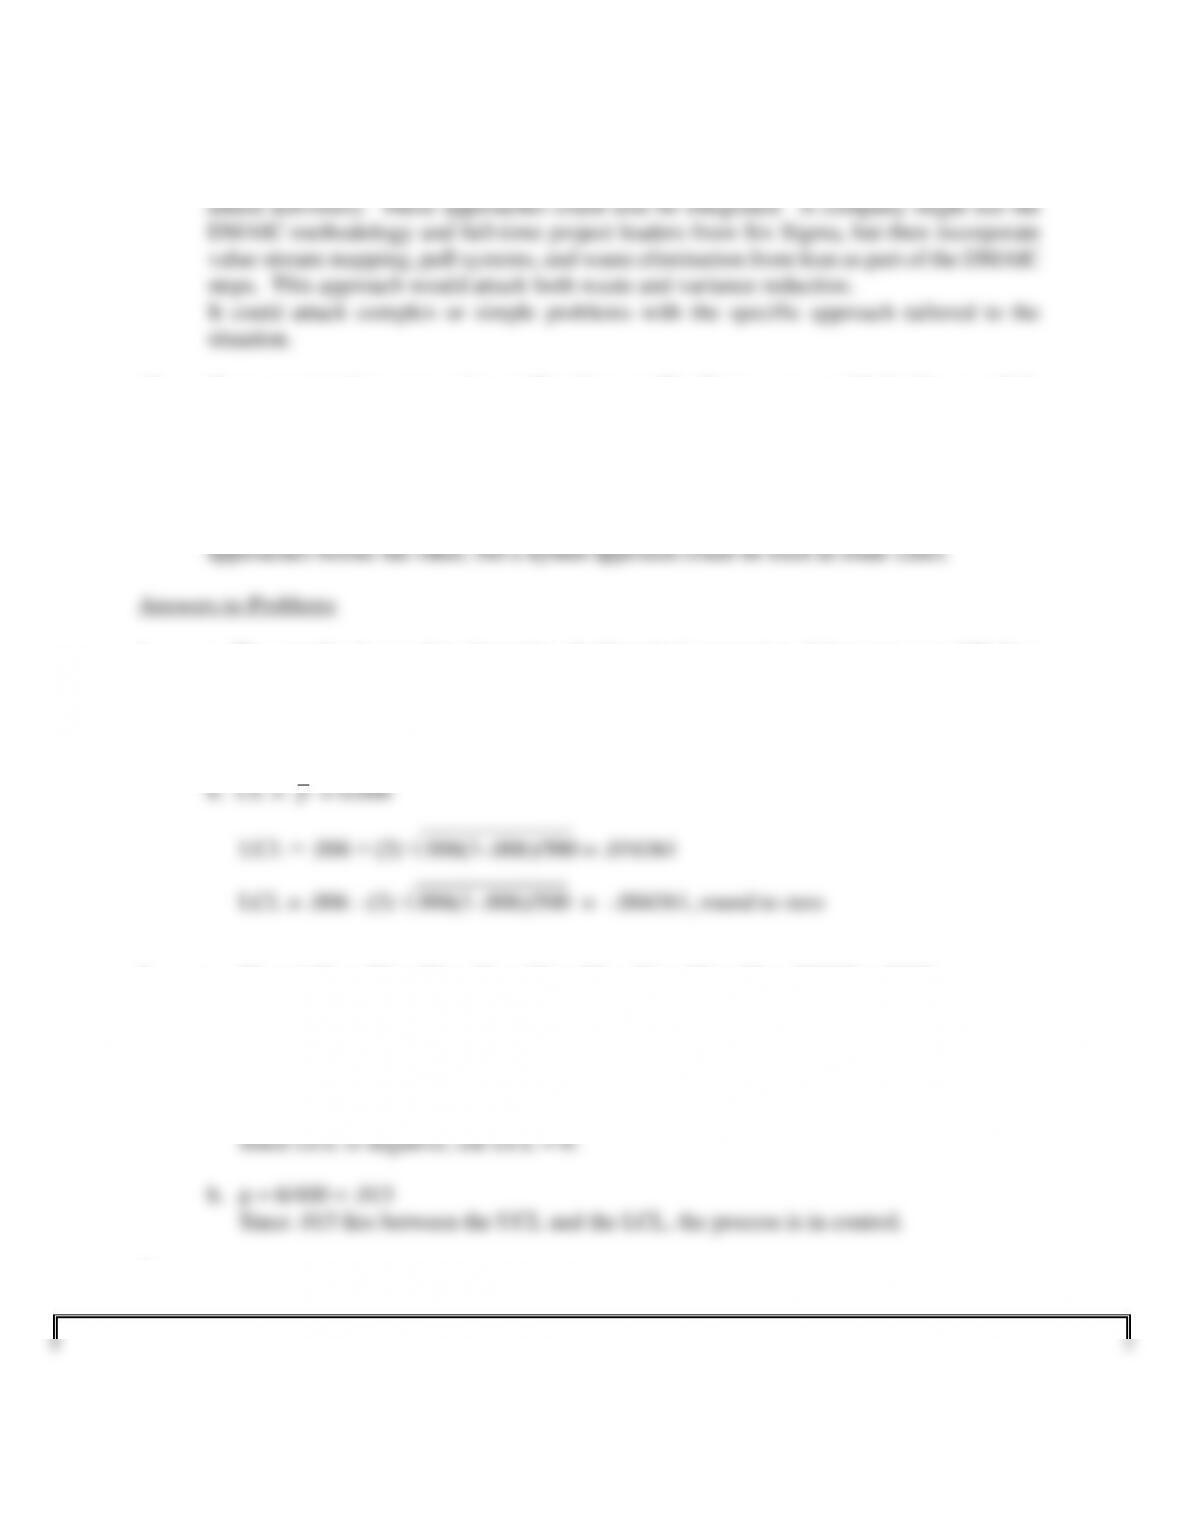
2. a. CL = [.01 + .02 + .02 + .01 + .03 + .02 + .01 + .04 + .03 + .02]/12 = .0175
_______________
UCL = .0175 + (3) √.0175(1-.0175)/400 = .0372
_______________
LCL = .0175 – (3) √.0175(1-.0175)/400 = -.0022
3. a
NAME:
Answer
key
CHAPTER 9,
PROBLEM 3
SECTION:
********
26-Apr-10
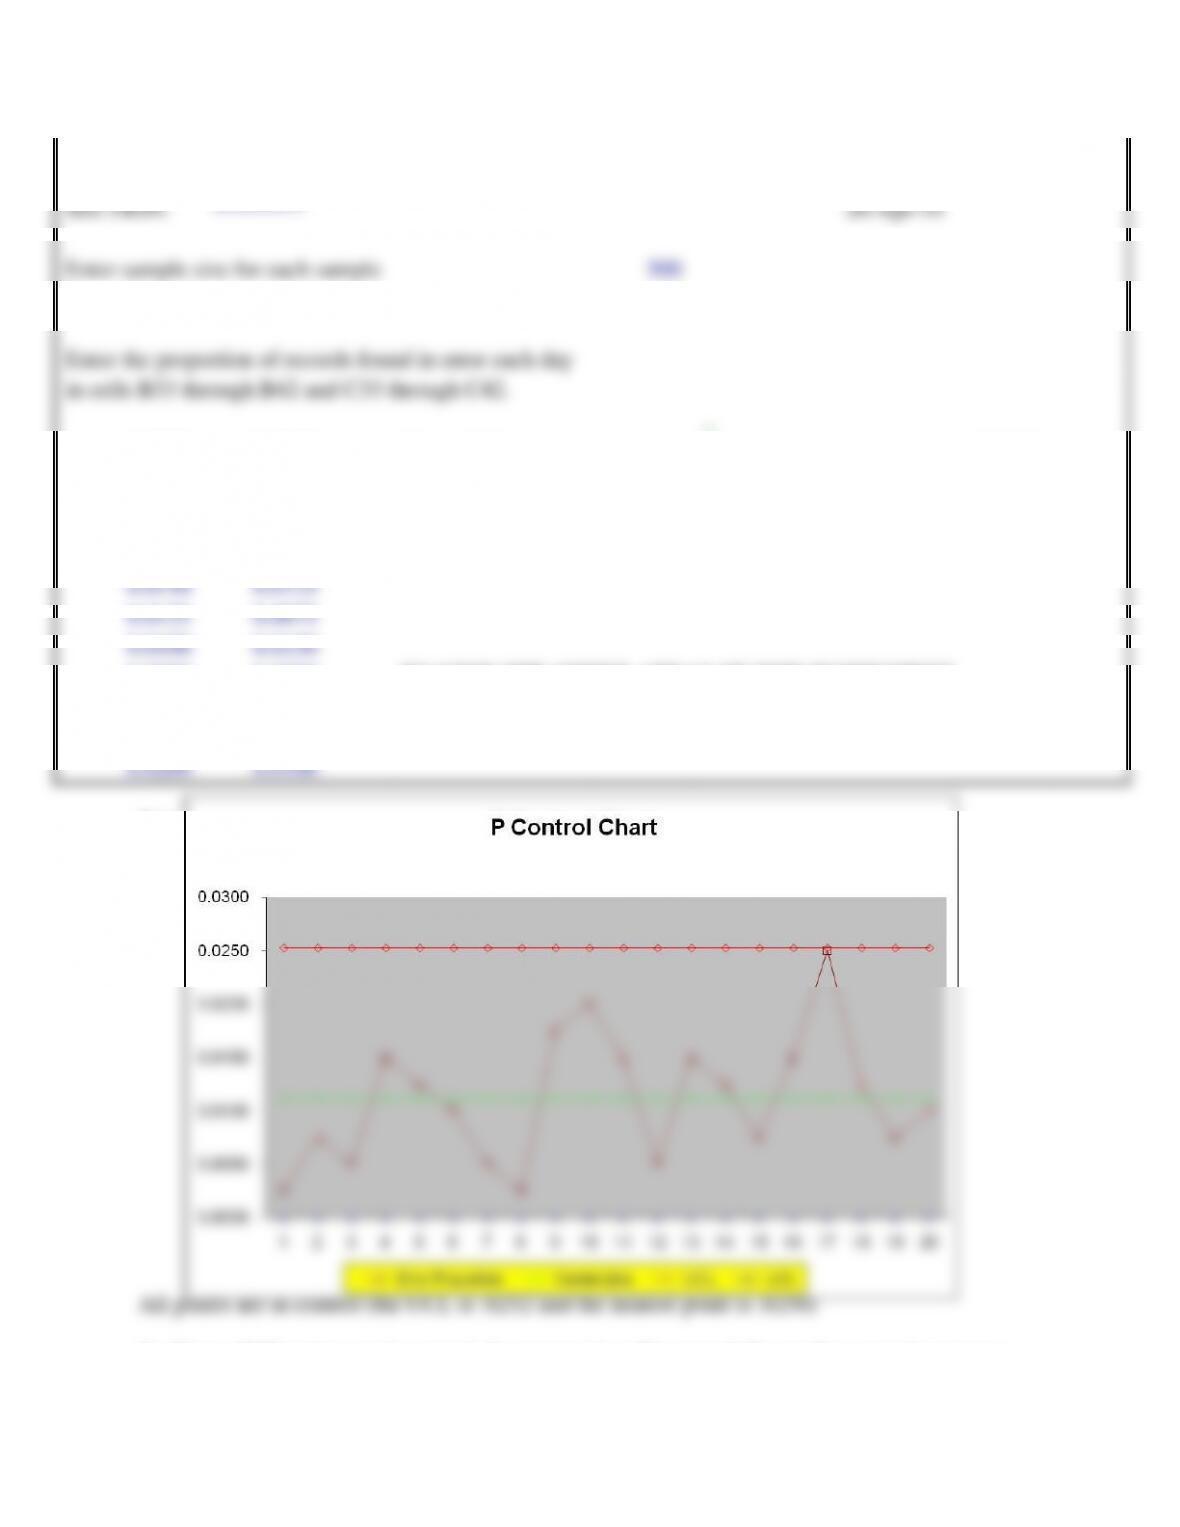
Enter sample size for each sample
500
Enter the number of samples taken
20
Enter the proportion of records found in error each day
in cells B33 through B42 and C33 through C42.
_
0.0025
0.0150
Center Line
P
0.0111
0.0075
0.0050
Upper Control
Limit
UCL
0.0252
0.0050
0.0150
Lower Control
Limit
LCL
0.0000
0.0150
0.0125
0.0125
0.0075
0.0100
0.0150
0.0050
0.0250
TO VIEW THE OTHER AREAS OF THIS WORKSHEET,
0.0025
0.0125
PRESS THE “PAGE DOWN” AND “PAGE UP” KEYS OR
0.0175
0.0075
USE THE VERTICAL SCROLL BAR.
0.0200
0.0100
3.b
3c. Since all 20 points are in control, the process is stable enough for quality control purposes.
4. a. CL =
p
= 8/1,000,000 = .000008
__________________
UCL = .000008 + (3) √.000008(.999992)/100 = .000857
__________________
5. a. We could construct a control chart for the first shift by calculating the process centerline
and the upper and lower control limits. Then samples could be taken from the second shift
to see if those samples are within the control chart limits that were computed from the first
shift data. If the samples from the second shift were within the control limits we could
conclude that no change in the mean has occurred.
c. Since none of the 6 sample points from the second shift (.04, .06, .10, .02, .05, .03) fall
outside the control limits, we conclude that the process mean of .06 has not shifted upward
or downward on the second shift.
6. a. X-Bar chart R Chart
_
CL =
x
= 30 CL R = 5
4. Pros:
– Workers may produce fewer defects when they know an inspector will not be
inspecting their work because of a greater sense of responsibility.
– Workers may gain more job satisfaction (and perhaps less absenteeism and
turnover) when they inspect their own work.
– It may be less costly to have workers inspect their own work.
5. Most production processes are not in statistical control when first sampled for control chart
purposes because unnecessary variability is occurring beyond the level of unavoidable,
natural process variability. This undue variation must be traced back to its sources such as
lax procedures, untrained operators, and improper machine maintenance. By isolating
these sources, the process can be brought under statistical control where the remaining
variation is due to random combinations of unknown factors.
6. The sample size and frequency of a sampling procedure must both be evaluated. For
variable control charts, a sample size in the range of 3 to 10 is frequently acceptable since
variable measurement provides considerable information in each measurement. In this
case, a suggested n = 6 may well be adequate.
An attribute control chart, on the other hand, requires fairly large samples, frequently in
7. The purpose of continuous improvement of quality is to reduce the variability of the
product or process by solving problems or changing the design of the product or process
itself. Through continuous improvement more consistent products are produced and less
waste is incurred.
8. A Pareto chart identifies the many modes of failure and their relative frequency of
occurrence, allowing the problem solver to prioritize problem solving based on the
importance of the problem or the ease or cost of implementing a solution.
9. a. Pareto Chart d. R chart
b. Cause-Effect Diagram e. All of the techniques
c. X-Bar and R chart or p chart f. All of the techniques
10. a) Cause-effect diagram for car not starting in the morning
10. b) Cause-effect diagram for receiving low grade
10. c) Cause-effect diagram for failing to graduate from college.
Electrical
system
Fuel system
Starter Motor
Low battery
Bad gas
Bad formulation of
the problem/test
Student
Environment
Teacher
Fatigue
Student
Not enough
effort
Personal
problems
11. First, Six Sigma is a metric because it is based on measuring quality variables that are
critical to the customer. Specific metrics include process sigma, x-times improvement, and
process yield. Second, it is a process improvement tool because it prescribes specific steps
to improve the measures. For example, DMAIC are the steps used by many Six Sigma
organizations. Third, it is a philosophy because the implementation requires a change in
the organizational culture and top management leadership. The philosophy includes how
12. Define – Specify the project including the process to be improved, the improvement team,
time schedule, etc.
Measure — Measuring quality variables (for illustration assume the following measures
are important to the customer):
a. Average time to order
13. Six Sigma implementation improves quality and products/services and processes and also
increases profits for the organization. There are, however, possible problems in the process
of implementation such as lack of senior management leadership, not enough training on
Six Sigma, and the specialists involved in the implementation are not devoted full-time.
14. Lean and Six Sigma can work together in making process improvement by attacking both
complex and simple problems. Six Sigma is useful in attacking complex problems that
might require sophisticated statistical tools, a full-time black-belt trained project leader,
and up to six months of work aimed at reducing process variance. On the other hand, lean
can be used to quickly attack less complex problems in a week or less using Kaizen, with
less sophisticated tools aimed at improving process flow and eliminating waste (non-value
15. If an organization were using neither lean or Six Sigma, you could decide on which
approach to use first depending on the type of problems that you have. If the problems are
very complex and are related to variance reduction, then Six Sigma is the preferred
approach. On the other hand, if quality is already high but there is substantial waste in the
system then lean should be used to improve the flow and reduce waste, provided the
problems are not too complex. It would probably be best to implement either one of these
1. a. The sample size used to determine the historical proportion defect rate over 100 days
was 1,000. The number 100 is irrelevant for calculations; 100 days were simply used to
observe the process. In the future, 500 is the appropriate sample size each day that should
used to calculate control limits as shown below.
2. a. CL = [.01 + .02 + .02 + .01 + .03 + .02 + .01 + .04 + .03 + .02]/12 = .0175
_______________
UCL = .0175 + (3) √.0175(1-.0175)/400 = .0372
_______________
LCL = .0175 – (3) √.0175(1-.0175)/400 = -.0022
3. a
NAME:
Answer
key
CHAPTER 9,
PROBLEM 3
SECTION:
********
26-Apr-10
Enter sample size for each sample
500
Enter the number of samples taken
20
Enter the proportion of records found in error each day
in cells B33 through B42 and C33 through C42.
_
0.0025
0.0150
Center Line
P
0.0111
0.0075
0.0050
Upper Control
Limit
UCL
0.0252
0.0050
0.0150
Lower Control
Limit
LCL
0.0000
0.0150
0.0125
0.0125
0.0075
0.0100
0.0150
0.0050
0.0250
TO VIEW THE OTHER AREAS OF THIS WORKSHEET,
0.0025
0.0125
PRESS THE “PAGE DOWN” AND “PAGE UP” KEYS OR
0.0175
0.0075
USE THE VERTICAL SCROLL BAR.
0.0200
0.0100
3.b
3c. Since all 20 points are in control, the process is stable enough for quality control purposes.
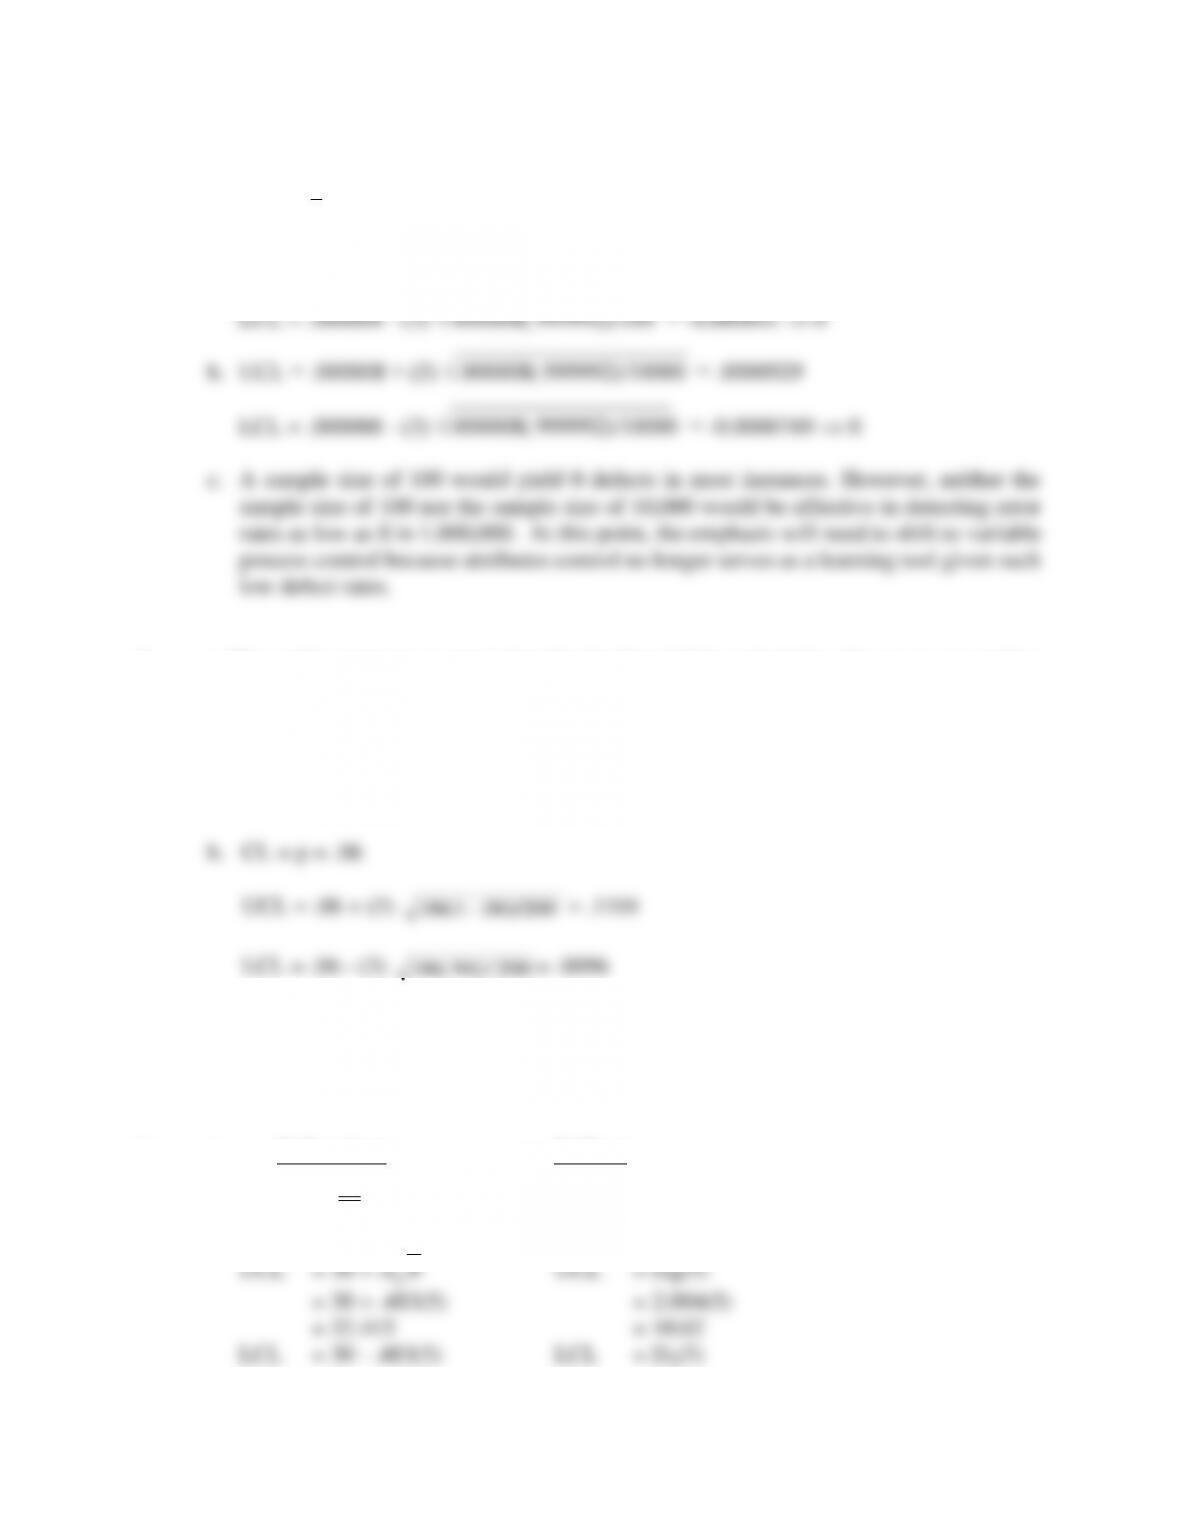
4. a. CL =
p
= 8/1,000,000 = .000008
__________________
UCL = .000008 + (3) √.000008(.999992)/100 = .000857
__________________
5. a. We could construct a control chart for the first shift by calculating the process centerline
and the upper and lower control limits. Then samples could be taken from the second shift
to see if those samples are within the control chart limits that were computed from the first
shift data. If the samples from the second shift were within the control limits we could
conclude that no change in the mean has occurred.
c. Since none of the 6 sample points from the second shift (.04, .06, .10, .02, .05, .03) fall
outside the control limits, we conclude that the process mean of .06 has not shifted upward
or downward on the second shift.
6. a. X-Bar chart R Chart
_
CL =
x
= 30 CL R = 5