somewhat unique in operations textbooks, since process flow analysis is often mentioned but not
given extensive treatment. Nevertheless, process flow analysis is one of the most fundamental
Teaching Notes
This chapter deals with analyzing and improving process flows including the flows of
customers in service operations, materials in manufacturing, and information. This chapter is
ways to improve the efficiency and effectiveness of most operations.
In teaching this chapter, I emphasize the basic ideas of systems thinking and tracing
process flows through the use of flow-process charts. This is supplemented by process
in most operations. Presentation of Service Blueprinting is included, and applications of the
principles of process-flow analysis in process redesign (Business Process Reengineering, BPR)
are discussed. The Godfrey and Bandy (2005) article on Little’s Law and the Theory of
Constraints is useful. Some applications of the ideas in this chapter can be found in Andrews
(2007), McNary (2006), Bliemel and Hassanein (2004), and Sarkar and Singh (2006).
Answers to Questions
1. a. A college provides a multitude of services. The primary service of a college is
3. Little’s Law says the average number of items in a system is the multiplication product of
b. A fast food restaurant provides food quickly and in pleasant surroundings.
2. The process view allows an organization to analyze the sequence of processes or steps
the average flow rate into the system and the average length of time an item spends in the
system.
Little’s Law applies when the system is in steady state where the average input rate
equals the average output rate. It only applies to average values of the variables. It does
not provide an estimate of the variance that might be found in the three variables.
4. A bottleneck is a resource that limits the capacity of the entire system. The bottleneck is
found by finding the minimum of the capacity of all the resources required in the process.
supply. Increasing capacity will improve the flow rate only if there is sufficient demand
and supply. Likewise, increasing demand will only result in a higher flow rate if there is
sufficient capacity. These three quantities are interrelated.
process output.
7. The primarily problem is convincing people to change or abandon their current
procedures. This can include changing the current procedures used by management,
production workers, service providers, or customers.
9. Answers will vary depending upon the student’s sources.
10. Answers will vary depending upon the student’s sources.
11. Service blueprinting is one form of process flowcharting (or process mapping). It is
Answers to Problems
1. a. I = T x R = 6 X 10 = 60 claims in the system on average
b. Flow rate = min (demand, capacity) = min (7, 8) = 7 per hour
b. Using Little’s Law solve for T: T = I/R = 200/600 = .333 hours = 20 minutes.
c. The throughput time can be decreased by either decreasing I, the number of checks in
the system, or increasing R, the flow rate.
3. The capacity of the receptionist is 4 minutes per customer or 15 customers per hour.
c. If the input to the system is random, as the flow rate approaches the capacity of the
system, the number of customers waiting will approach a very large number (infinity).
This occurs because capacity is wasted whenever the number of customers arriving in a
given time interval is less than capacity and when the arrivals later exceed capacity the
Each oven takes 30 minutes per order and can handle 2 orders per hour. There are 3
ovens so the total oven capacity is 6 cakes per hour.
The capacity of the process is 6 cakes per hour and the bottleneck is the ovens.
b. Throughput time = 2 + 8 + 30 + 60 + 2 + 3 = 105 minutes
The service manager takes 2 minutes per order and can handle 30 orders per hour.
Each chef takes 16 minutes per order and can handle 60/16 = 3.75 orders per hour. There
are 4 chefs so the kitchen can handle 4 X 3.75 = 15 orders per hour.
The bartender takes 3 minutes and can handle 20 orders per hour.
Each waiter takes 20 minutes and can handle 3 orders per hour. There are 6 waiters so
considering that only 80% of the orders require bar service. So, the bar is not a
constraint.
b. Throughput time = 2 + 16 + 20 = 38 minutes.
Note, the bartender time is not added, since bar service is provide in parallel.
Bartender 1 x 7 = 7
Manager 1 x 12 = 12
Total Labor 95
The overhead is added 95 + 95 X .60 = 152
orders per hour).
The labor cost per order is 152/15 = 10.13. Adding the food cost ($6) the total cost is
$16.13 average cost per order.
6. a. The capacity of the system is the minimum of the capacities of the resources, since
Batch Size 100 50
Wood Cutting 30 + 500 30 + 250
Make Four Legs 60 + 1000 60 + 500
Make Tops 60 + 1200 60 + 600
Finish the Wood 20 + 800 20 + 400
c. I = T X R = 4330/60 x 6 = 433 tables in the system.
7.
max
max
Note: Examples (a), (b) and (c) will vary from one situation to the next and are,
therefore, not included in the answers for problems 7 through 9.
8. Check symbols used in question 7 against those in Chapter 6.
9. Address the following questions for each process map: What? (Could payment be
automated?) Who? (Can someone else pay your bills? Probably best to do it yourself!) Where?
(Do you have secure Internet access for paying bills online?) When? (How can you be certain
all bills are paid on time?) How? (Is there a better way to pay your bills?)
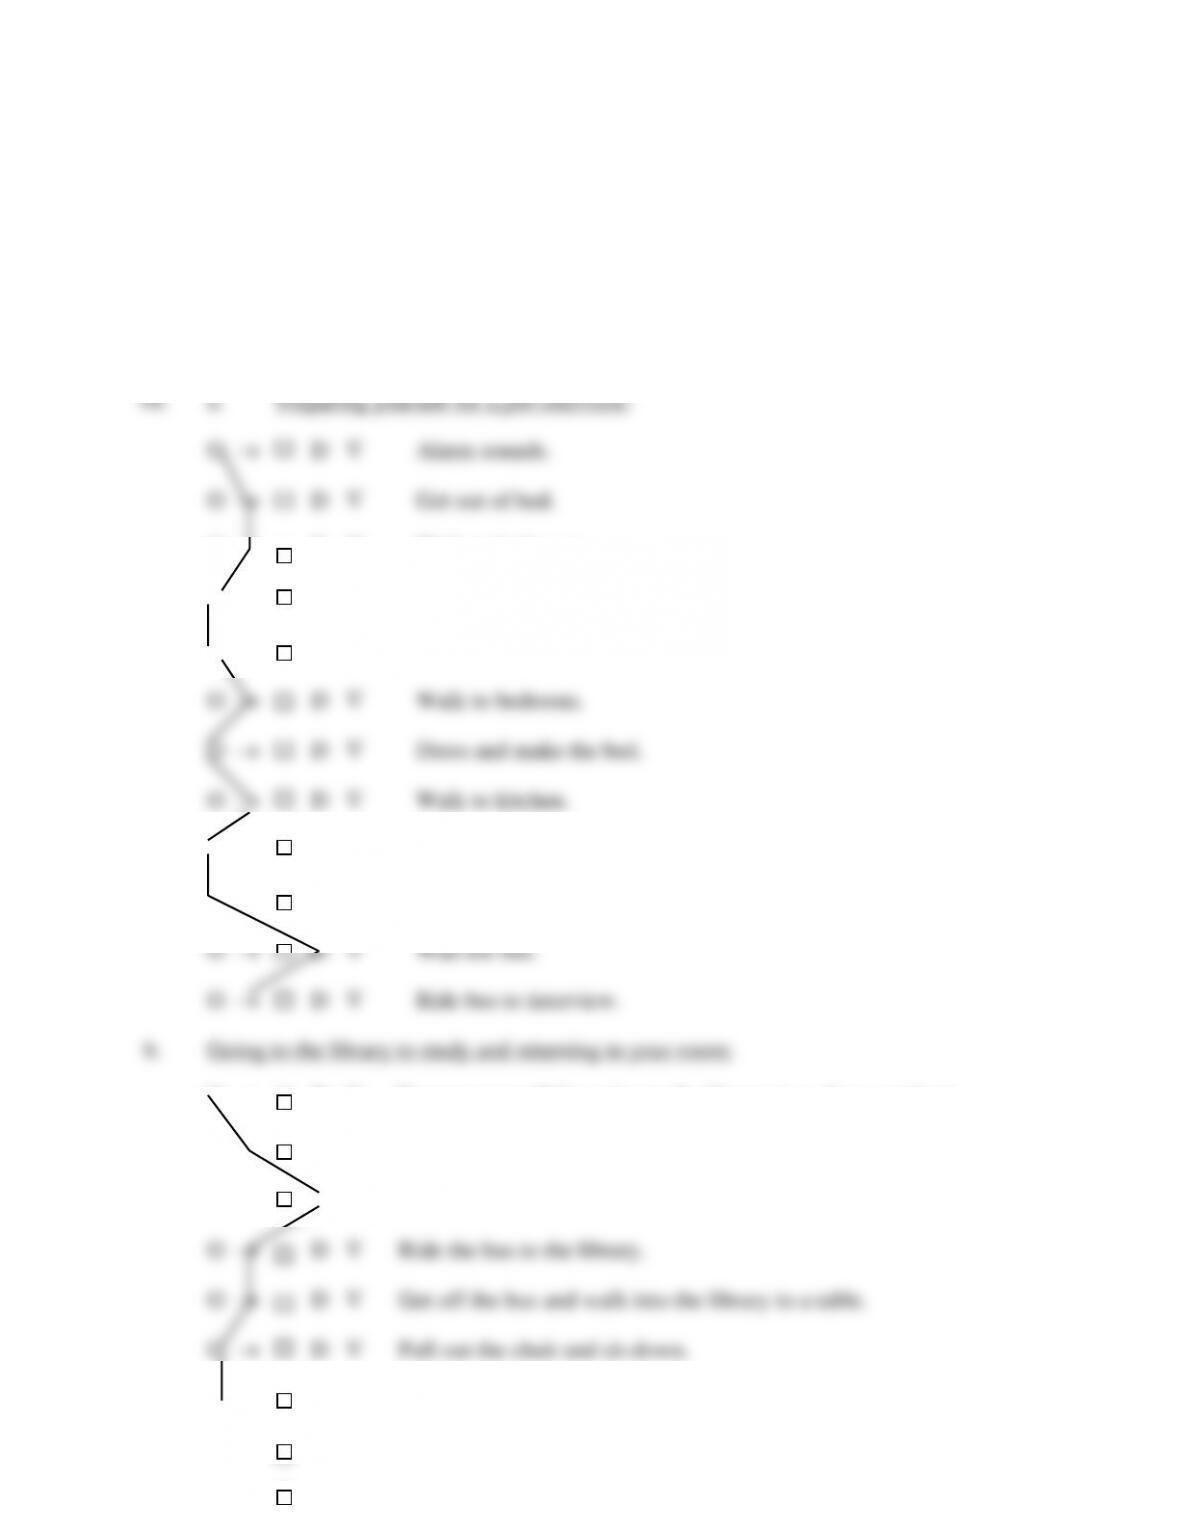
O → D Walk to bathroom.
O → D Clean up; Brush teeth, etc.
O → D Shave or fix hair.
O → D Eat breakfast.
O → D Gather brief case.
O → D Prepare yourself for going to the library (e.g. dress, get bag).
O → D Walk from the room (out of the house/dorm) to the bus stop.
O → D Wait for the bus.
O → D Bring out the materials for studying from the bag.
O → D Study.
O → D Ride the bus back to the house/dorm and walk to the room.
11. Preparing yourself for a job interview:
Going to the library to study and returning to your room:
What: To study at the library.
Who: Myself.
When: To reach the library at the shortest possible time and be able to finish
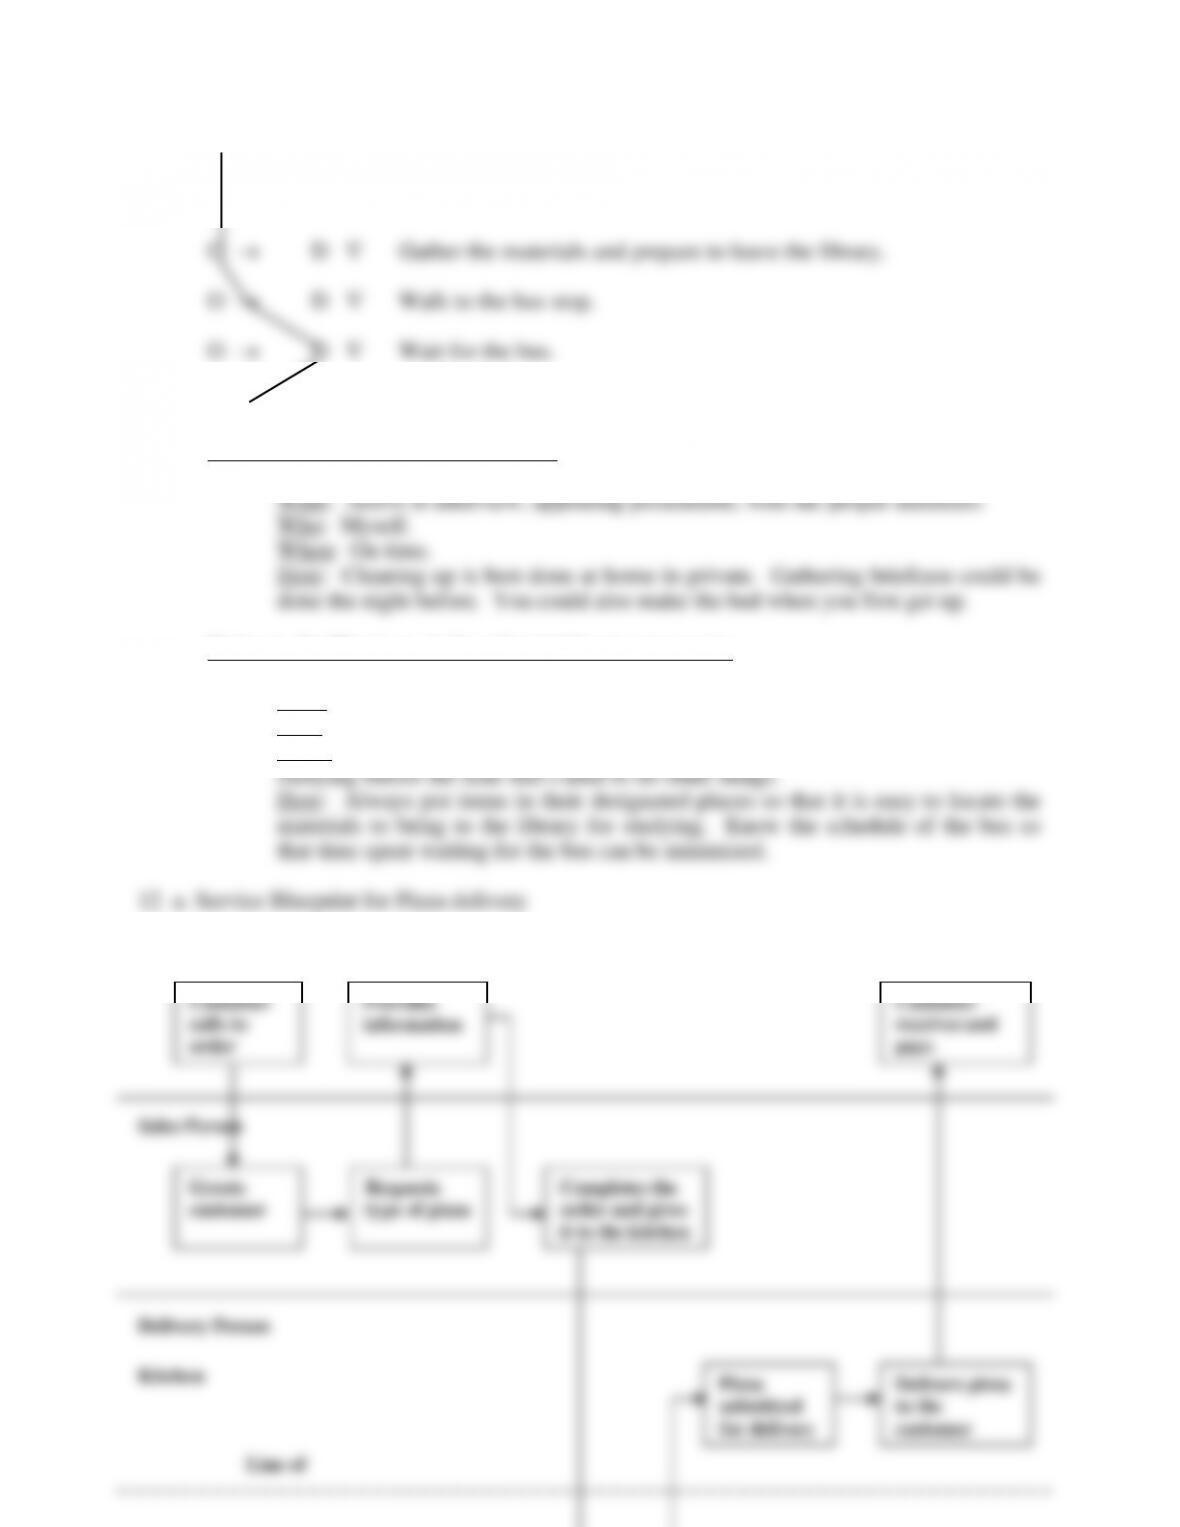
Customer
Customer
calls to
Customer
receives and
Greets
customer
Requests
type of pizza
Completes the
order and gives
it to the kitchen
Pizza
submitted
for delivery
Delivers pizza
to the
customer
Provides
information
Line of
vivisiVisibility
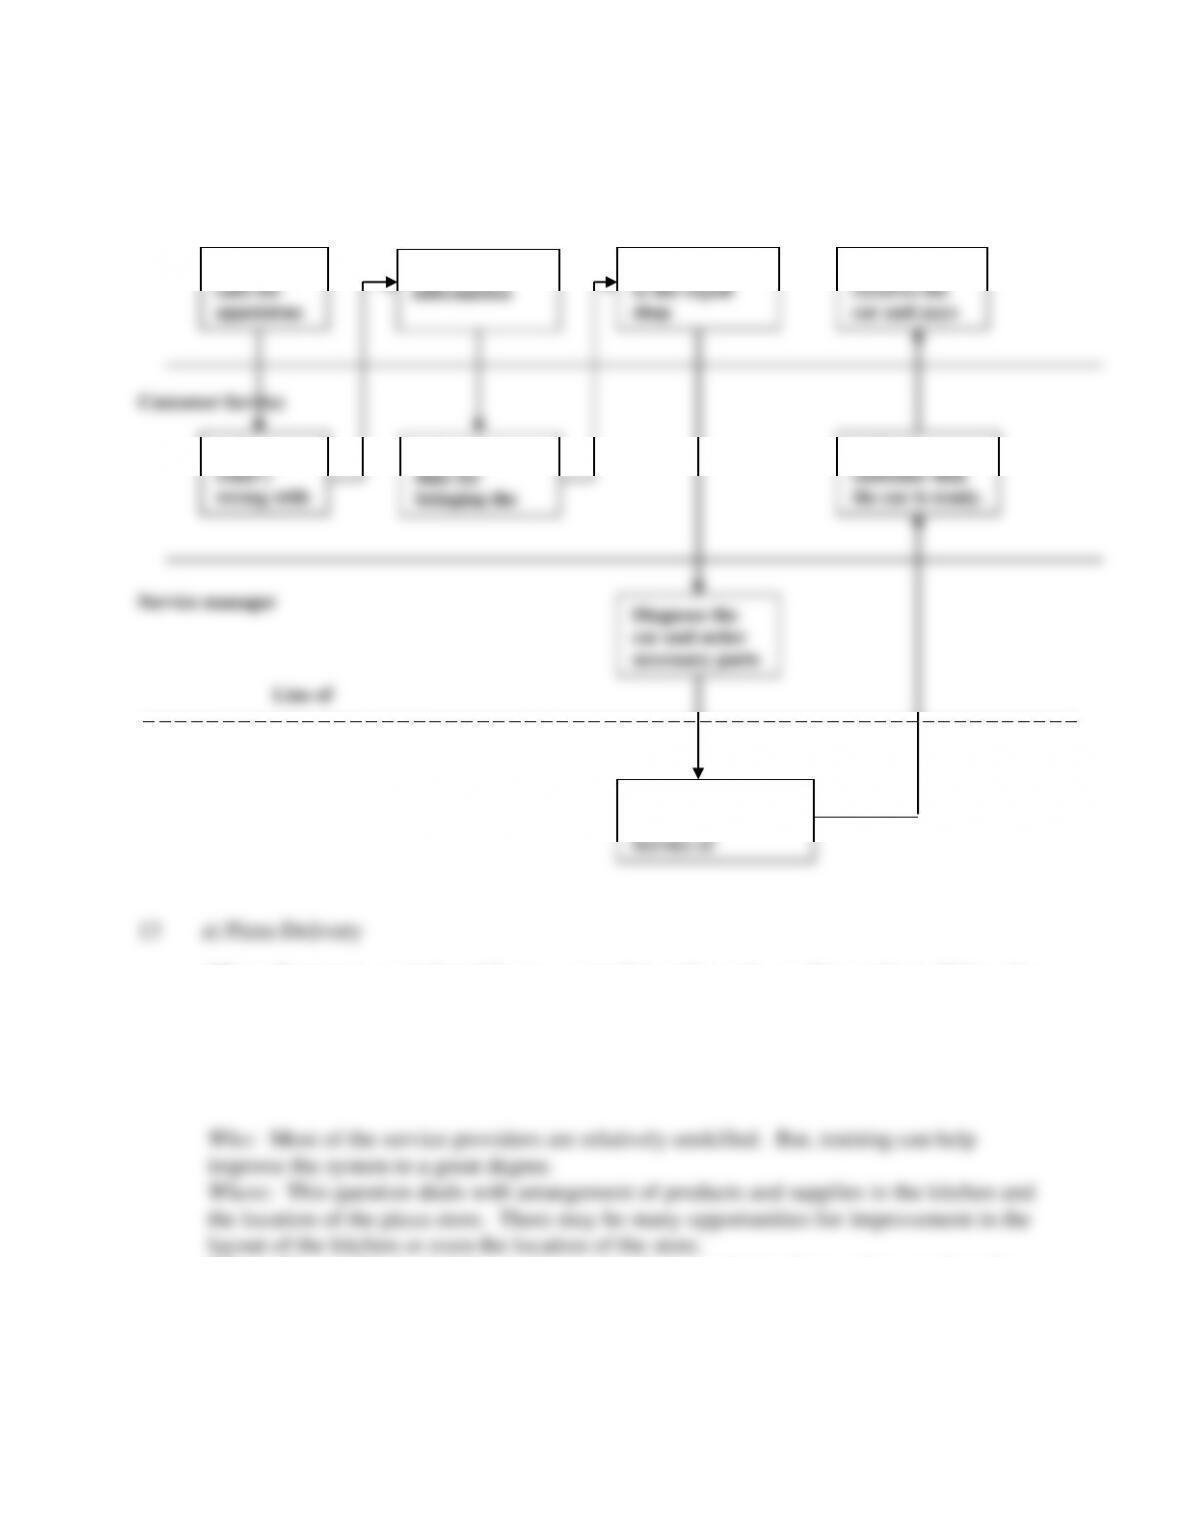
12 ……. b. Service Blueprint for Automobile repair
Customer
Diagnose the
car and order
necessary parts
Diagnose the
car and order
necessary parts
Mechanic
Service of
Service of
What: Customers want fast delivery, a complete order, and a quality product. If the sales
person is trained to be a better listener to customer’s orders, this might improve service
and quality. Also if the delivery person has more experience in driving that will improve
timeliness of the delivery. The product itself might be improved by changing ingredients
or the training of the kitchen employees.
When: Reconsider the existing processes in order to optimize them and to speed up the
pizza preparation and delivery.
How: If possible the Pizza Delivery Company might think of including online order
taking for its customers. Also, the delivery person might be equipped with a special
car and pays
car and pays
Customer
calls for
Customer
receives the
Asks
what’s
wrong with
the car
Schedules a
date for
bringing the
car for repair
Provides
information
Visibility
Brings the car
to the repair
Calls the
customer that
the car is ready.
Makes repairs and
informs Cust
repair will be rapidly completed thereby saving the time of the customer and employees.
Who: Perhaps the customer service representative could diagnose the problem and thus
save time for the service manager.
Where: The Car Repair Company might wish to reconsider the way spare parts are
ordered, delivered, and stored in the facility.
Little’s Law applies when the system is in steady state where the average input rate
equals the average output rate. It only applies to average values of the variables. It does
not provide an estimate of the variance that might be found in the three variables.
4. A bottleneck is a resource that limits the capacity of the entire system. The bottleneck is
found by finding the minimum of the capacity of all the resources required in the process.
supply. Increasing capacity will improve the flow rate only if there is sufficient demand
and supply. Likewise, increasing demand will only result in a higher flow rate if there is
sufficient capacity. These three quantities are interrelated.
process output.
7. The primarily problem is convincing people to change or abandon their current
procedures. This can include changing the current procedures used by management,
production workers, service providers, or customers.
9. Answers will vary depending upon the student’s sources.
10. Answers will vary depending upon the student’s sources.
11. Service blueprinting is one form of process flowcharting (or process mapping). It is
Answers to Problems
1. a. I = T x R = 6 X 10 = 60 claims in the system on average
b. Flow rate = min (demand, capacity) = min (7, 8) = 7 per hour
b. Using Little’s Law solve for T: T = I/R = 200/600 = .333 hours = 20 minutes.
c. The throughput time can be decreased by either decreasing I, the number of checks in
the system, or increasing R, the flow rate.
3. The capacity of the receptionist is 4 minutes per customer or 15 customers per hour.
c. If the input to the system is random, as the flow rate approaches the capacity of the
system, the number of customers waiting will approach a very large number (infinity).
This occurs because capacity is wasted whenever the number of customers arriving in a
given time interval is less than capacity and when the arrivals later exceed capacity the
Each oven takes 30 minutes per order and can handle 2 orders per hour. There are 3
ovens so the total oven capacity is 6 cakes per hour.
The capacity of the process is 6 cakes per hour and the bottleneck is the ovens.
b. Throughput time = 2 + 8 + 30 + 60 + 2 + 3 = 105 minutes
The service manager takes 2 minutes per order and can handle 30 orders per hour.
Each chef takes 16 minutes per order and can handle 60/16 = 3.75 orders per hour. There
are 4 chefs so the kitchen can handle 4 X 3.75 = 15 orders per hour.
The bartender takes 3 minutes and can handle 20 orders per hour.
Each waiter takes 20 minutes and can handle 3 orders per hour. There are 6 waiters so
considering that only 80% of the orders require bar service. So, the bar is not a
constraint.
b. Throughput time = 2 + 16 + 20 = 38 minutes.
Note, the bartender time is not added, since bar service is provide in parallel.
Bartender 1 x 7 = 7
Manager 1 x 12 = 12
Total Labor 95
The overhead is added 95 + 95 X .60 = 152
orders per hour).
The labor cost per order is 152/15 = 10.13. Adding the food cost ($6) the total cost is
$16.13 average cost per order.
6. a. The capacity of the system is the minimum of the capacities of the resources, since
Batch Size 100 50
Wood Cutting 30 + 500 30 + 250
Make Four Legs 60 + 1000 60 + 500
Make Tops 60 + 1200 60 + 600
Finish the Wood 20 + 800 20 + 400
c. I = T X R = 4330/60 x 6 = 433 tables in the system.
7.
max
max
Note: Examples (a), (b) and (c) will vary from one situation to the next and are,
therefore, not included in the answers for problems 7 through 9.
8. Check symbols used in question 7 against those in Chapter 6.
9. Address the following questions for each process map: What? (Could payment be
automated?) Who? (Can someone else pay your bills? Probably best to do it yourself!) Where?
(Do you have secure Internet access for paying bills online?) When? (How can you be certain
all bills are paid on time?) How? (Is there a better way to pay your bills?)
O → D Walk to bathroom.
O → D Clean up; Brush teeth, etc.
O → D Shave or fix hair.
O → D Eat breakfast.
O → D Gather brief case.
O → D Prepare yourself for going to the library (e.g. dress, get bag).
O → D Walk from the room (out of the house/dorm) to the bus stop.
O → D Wait for the bus.
O → D Bring out the materials for studying from the bag.
O → D Study.
O → D Ride the bus back to the house/dorm and walk to the room.
11. Preparing yourself for a job interview:
Going to the library to study and returning to your room:
What: To study at the library.
Who: Myself.
When: To reach the library at the shortest possible time and be able to finish
Customer
Customer
calls to
Customer
receives and
Greets
customer
Requests
type of pizza
Completes the
order and gives
it to the kitchen
Pizza
submitted
for delivery
Delivers pizza
to the
customer
Provides
information
Line of
vivisiVisibility
12 ……. b. Service Blueprint for Automobile repair
Customer
Mechanic
What: Customers want fast delivery, a complete order, and a quality product. If the sales
person is trained to be a better listener to customer’s orders, this might improve service
and quality. Also if the delivery person has more experience in driving that will improve
timeliness of the delivery. The product itself might be improved by changing ingredients
or the training of the kitchen employees.
When: Reconsider the existing processes in order to optimize them and to speed up the
pizza preparation and delivery.
How: If possible the Pizza Delivery Company might think of including online order
taking for its customers. Also, the delivery person might be equipped with a special
Customer
calls for
Customer
receives the
Asks
what’s
wrong with
the car
Schedules a
date for
bringing the
car for repair
Provides
information
Visibility
Brings the car
to the repair
Calls the
customer that
the car is ready.
Makes repairs and
informs Cust
repair will be rapidly completed thereby saving the time of the customer and employees.
Who: Perhaps the customer service representative could diagnose the problem and thus
save time for the service manager.
Where: The Car Repair Company might wish to reconsider the way spare parts are
ordered, delivered, and stored in the facility.