
Latest Finish (LF) – the latest an activity can finish and still ensure that the project can be
completed on its scheduled time.
6. The management significance of the critical path is that it constrains the completion date
of the project since it is the longest path of activity times from the start to the end of the
network. As a result, activities on the critical path should be intensively managed to avoid
slippage. Other activities, not on the critical path, can be allowed to slip somewhat, up to
their amount of slack, without affecting the project completion date.
7. The Gantt chart indicates activity duration; when each activity is scheduled to begin and
when it will be completed. The chart can be used for less complex projects and when
activity times are constant – it is easy to use and easily understood. The output of network
methods can also be shown in Gantt chart format.
8. Since cost, performance and schedule are three conflicting objectives of a project, tradeoffs
among them must constantly be made in the course of project management. For example,
to design and plant a unique and exquisite garden will require more investments in time
and money than planting an ordinary garden. In this case, superior performance cannot be
achieved with minimal cost and within a short period of time.
9. Forward and backward passes are needed for the calculation of early start, early finish, late
start, and late finish times for activities. This information in turn can be used to identify
the critical path, slack times and project completion time.
10. Earliest Start, ES – earliest time an activity can start based on completion of all predecessor
activities
Latest Start, LS – latest time an activity can start and still achieve its latest finish time
Earliest Finish, EF – earliest time an activity can be completed given that it starts at its
11. There are three statistical assumptions. The first assumption is that the random times of
activities are independent. That means the time duration of one activity does not affect the
time duration of any other activity. The second assumption is that the total time of
completion of the project is normally distributed. The third assumption is that the activity
times are distributed according to the Beta distribution.
In most cases the duration of one activity may not affect another activity. But, there may
12. It’s true that the statistical assumptions of PERT are more complicated than the assumption
of constant times. However, when completion times of activities are uncertain as in the
case of R&D, the additional complication is needed to obtain a useful planning tool.
Assuming constant times for R&D will lead to false conclusions about the project
completion time. When activity times are uncertain, the project completion time itself is
uncertain and cannot be assumed to be constant. Also with uncertain activity times, every
13. If an activity has a high variance in a PERT chart, the high variance could cause the activity
to be critical even though it is not on the critical path calculated using expected times. This
is because the high variance makes it more likely the activity will take a long time to
complete and therefore affect the project completion time. If the activity with high variance
is on the critical path to start with, its high variance will increase the variance of the project
completion time and the high variance will be considered in the calculations of the project
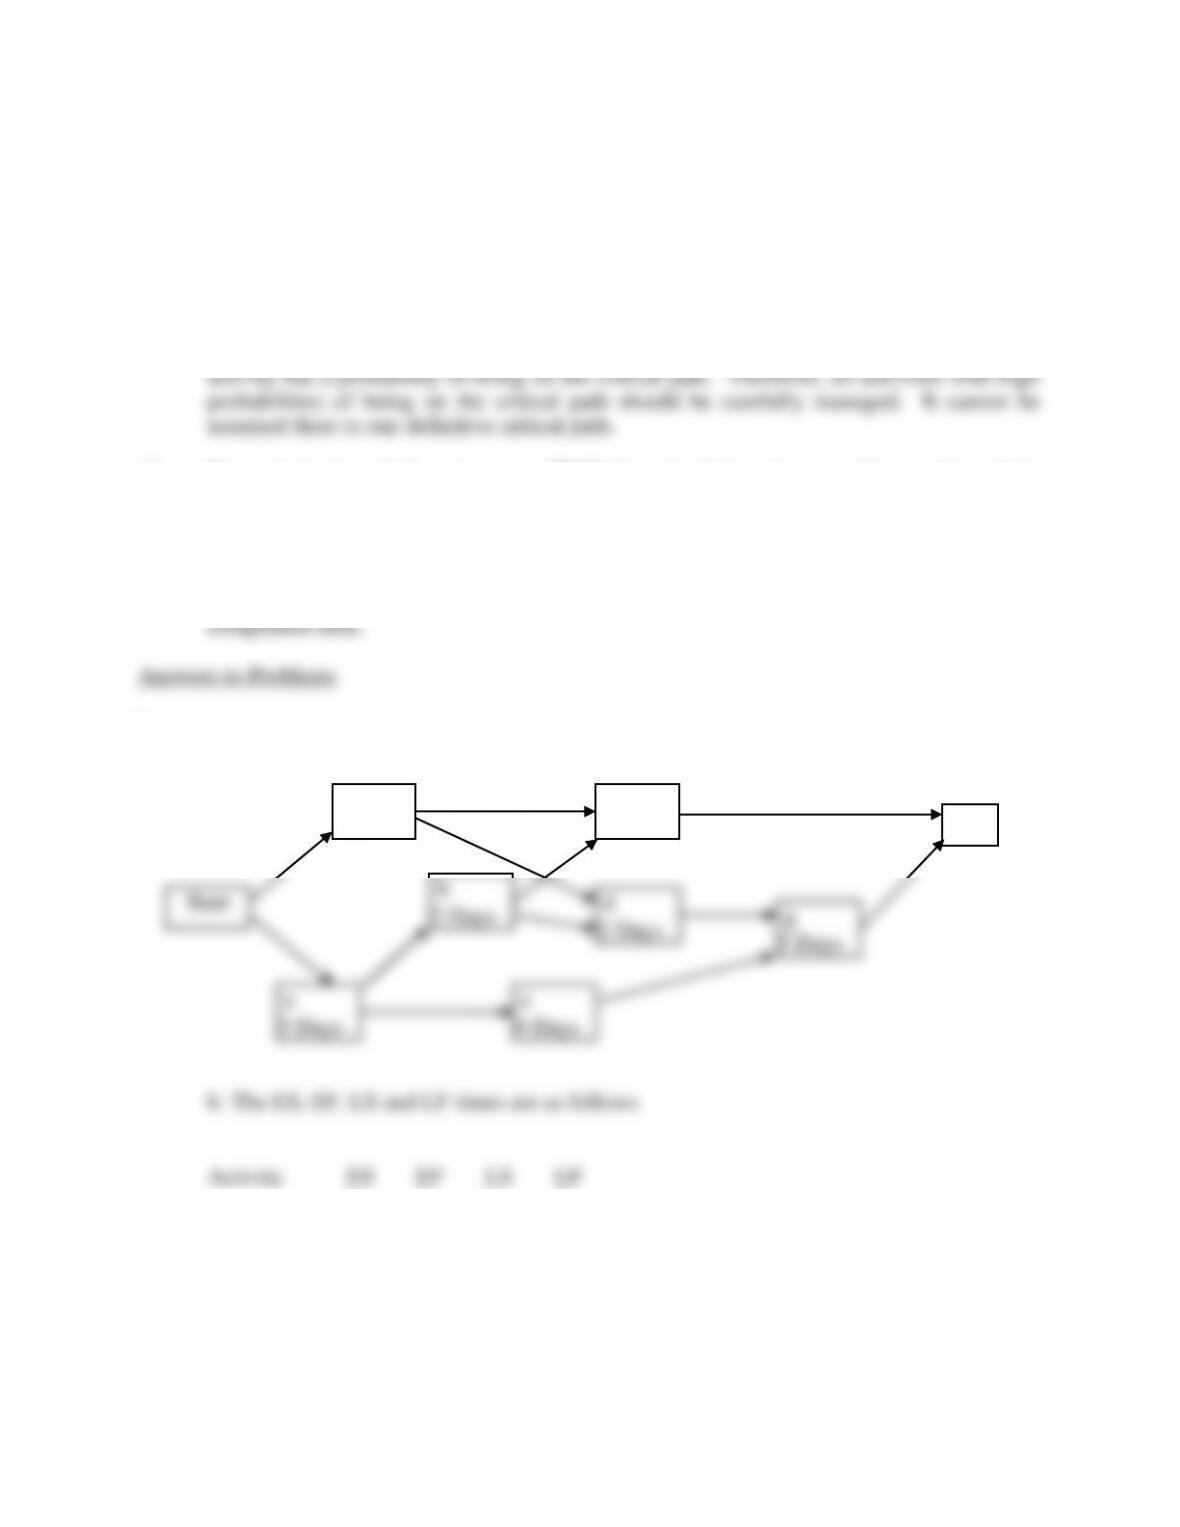
1.
a. Network:
a
b
2 Days
d
2 Days
e
g
a
b
2 Days
d
2 Days
e
g
a 0 3 0 3
b 3 5 3 5
c 0 5 0 5
d 5 7 5 7
e 3 7 3 7
f 5 11 6 12
g 7 12 7 12
c
5 Days
f
6 Days
End
c. There are 5 project paths:
of 12 days. The project completion time is 12 days.
d. If project completion must be reduced by 2 days, activities on each of the three critical
paths will be affected for the first day. When multiple critical paths exist, it may be
advantageous to crash an activity which is common to more than one path. For example, if
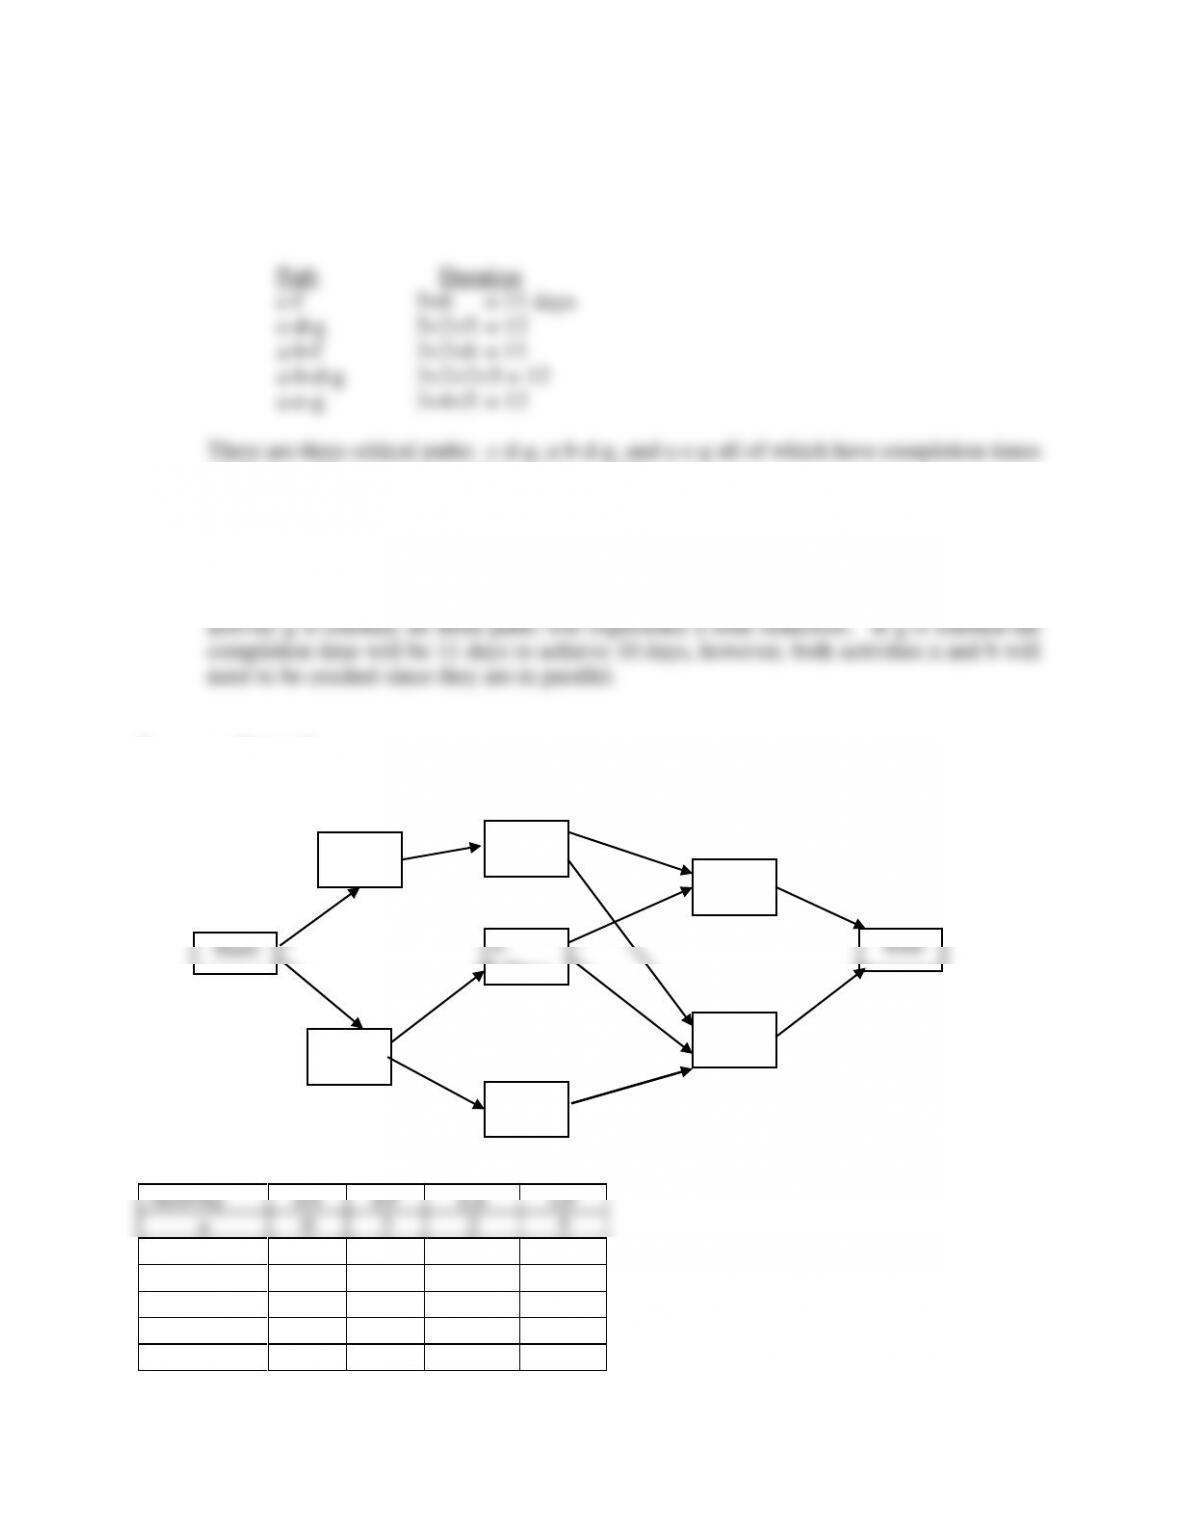
2. a. Network:
b.
Activity
ES
EF
LS
LF
a
0
3
2
5
b
0
2
0
2
c
3
5
5
7
d
2
7
2
7
a
3 Days
c
2 Days
Start
b
2 Days
d
5 Days
f
2 Days
e
4 Days
g
3 Days
End
g
7
10
7
10
c.
Activity
Total Slack
Activity
Total Slack
a
2
e
1
b
0
f
1
c
2
g
0
d
0
d. Time period
Activity
1
2
3
4
5
6
7
8
9
10
a
b
c
d
e
f
g
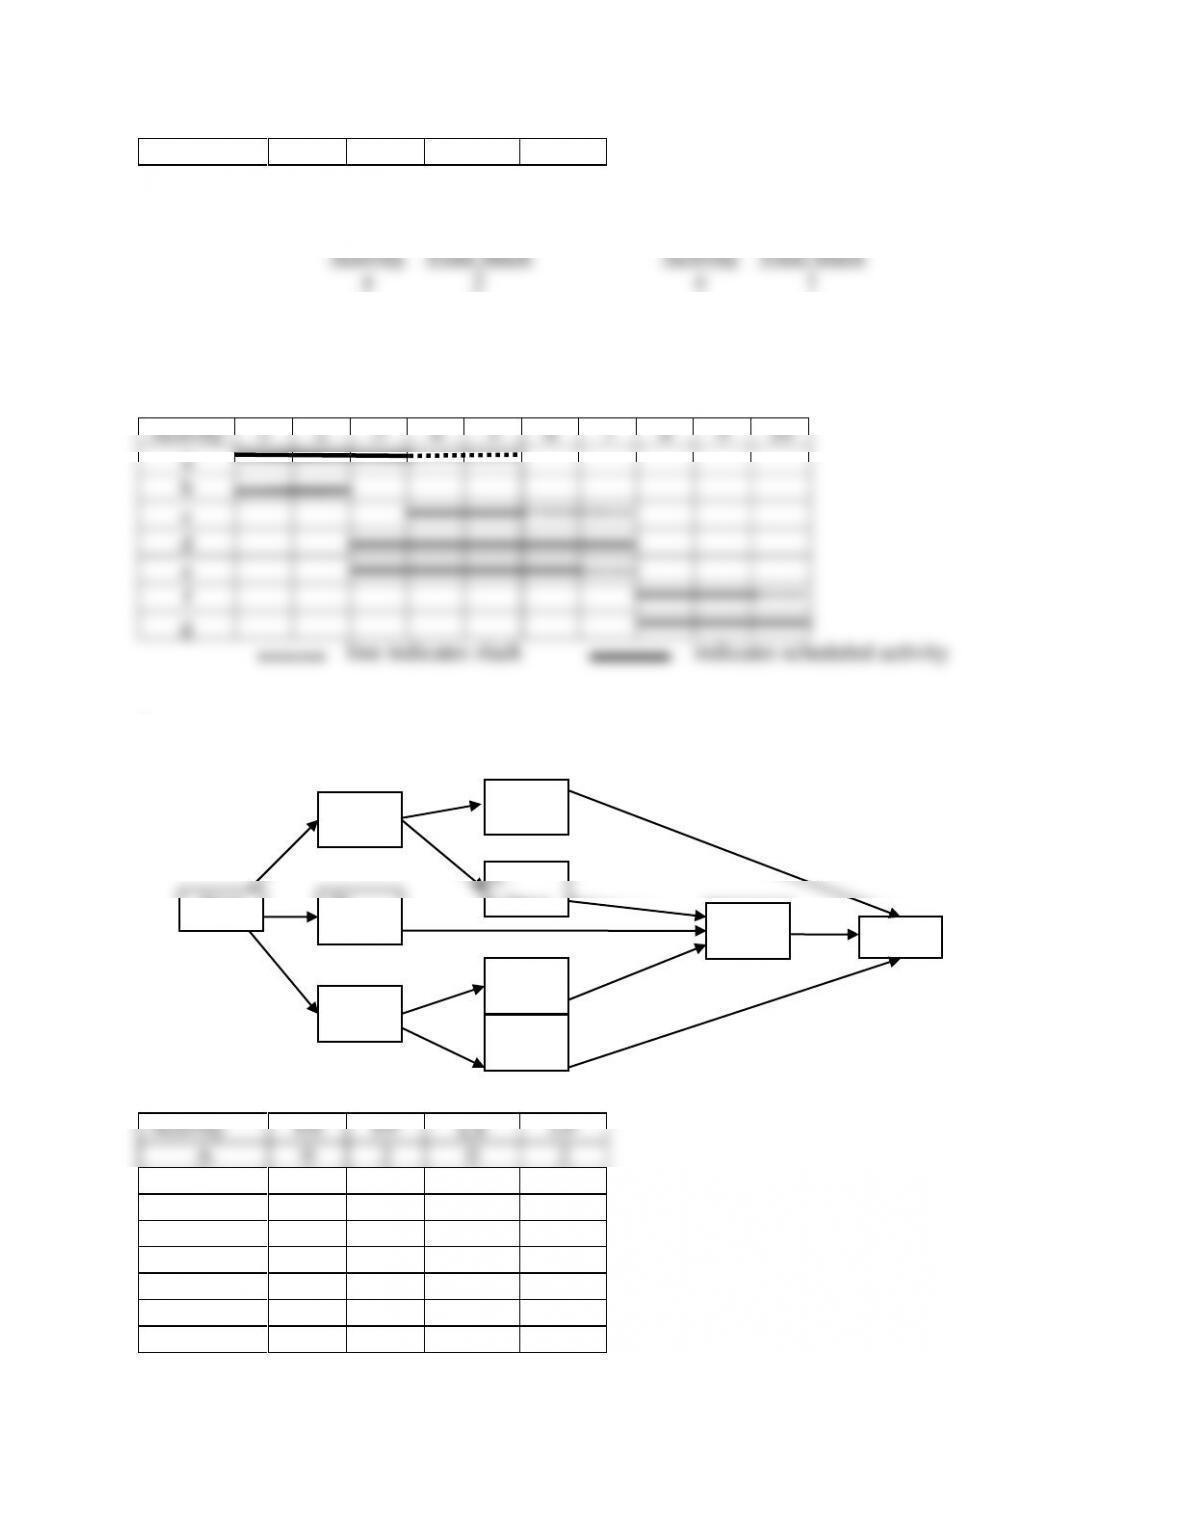
3.
a. Forward and Backward pass
Activity
ES
EF
LS
LF
A
0
2
0
2
B
2
7
5
10
C
2
5
2
5
D
0
3
2
5
E
0
1
2
3
F
1
3
3
5
G
1
4
7
10
F
1
3
3
5
G
1
4
7
10
A
2 Days
B
5 Days
Start
E
1 Day
F
2 Days
G
3 Days
H
5 Days
End
C
3 Days
D
3 Days

b. Activity Slack
A 0
B 3
C 0
D 2
E 2
F 2
3 c. Gantt Chart
Time Period
Activity
1
2
3
4
5
6
7
8
9
10
A
B
C
D
E
F
G
H
Latest Finish (LF) – the latest an activity can finish and still ensure that the project can be
completed on its scheduled time.
6. The management significance of the critical path is that it constrains the completion date
of the project since it is the longest path of activity times from the start to the end of the
network. As a result, activities on the critical path should be intensively managed to avoid
slippage. Other activities, not on the critical path, can be allowed to slip somewhat, up to
their amount of slack, without affecting the project completion date.
7. The Gantt chart indicates activity duration; when each activity is scheduled to begin and
when it will be completed. The chart can be used for less complex projects and when
activity times are constant – it is easy to use and easily understood. The output of network
methods can also be shown in Gantt chart format.
8. Since cost, performance and schedule are three conflicting objectives of a project, tradeoffs
among them must constantly be made in the course of project management. For example,
to design and plant a unique and exquisite garden will require more investments in time
and money than planting an ordinary garden. In this case, superior performance cannot be
achieved with minimal cost and within a short period of time.
9. Forward and backward passes are needed for the calculation of early start, early finish, late
start, and late finish times for activities. This information in turn can be used to identify
the critical path, slack times and project completion time.
10. Earliest Start, ES – earliest time an activity can start based on completion of all predecessor
activities
Latest Start, LS – latest time an activity can start and still achieve its latest finish time
Earliest Finish, EF – earliest time an activity can be completed given that it starts at its
11. There are three statistical assumptions. The first assumption is that the random times of
activities are independent. That means the time duration of one activity does not affect the
time duration of any other activity. The second assumption is that the total time of
completion of the project is normally distributed. The third assumption is that the activity
times are distributed according to the Beta distribution.
In most cases the duration of one activity may not affect another activity. But, there may
12. It’s true that the statistical assumptions of PERT are more complicated than the assumption
of constant times. However, when completion times of activities are uncertain as in the
case of R&D, the additional complication is needed to obtain a useful planning tool.
Assuming constant times for R&D will lead to false conclusions about the project
completion time. When activity times are uncertain, the project completion time itself is
uncertain and cannot be assumed to be constant. Also with uncertain activity times, every
13. If an activity has a high variance in a PERT chart, the high variance could cause the activity
to be critical even though it is not on the critical path calculated using expected times. This
is because the high variance makes it more likely the activity will take a long time to
complete and therefore affect the project completion time. If the activity with high variance
is on the critical path to start with, its high variance will increase the variance of the project
completion time and the high variance will be considered in the calculations of the project
1.
a. Network:
a 0 3 0 3
b 3 5 3 5
c 0 5 0 5
d 5 7 5 7
e 3 7 3 7
f 5 11 6 12
g 7 12 7 12
c
5 Days
f
6 Days
End
c. There are 5 project paths:
of 12 days. The project completion time is 12 days.
d. If project completion must be reduced by 2 days, activities on each of the three critical
paths will be affected for the first day. When multiple critical paths exist, it may be
advantageous to crash an activity which is common to more than one path. For example, if
2. a. Network:
b.
Activity
ES
EF
LS
LF
a
0
3
2
5
b
0
2
0
2
c
3
5
5
7
d
2
7
2
7
a
3 Days
c
2 Days
Start
b
2 Days
d
5 Days
f
2 Days
e
4 Days
g
3 Days
End
g
7
10
7
10
c.
Activity
Total Slack
Activity
Total Slack
a
2
e
1
b
0
f
1
c
2
g
0
d
0
d. Time period
Activity
1
2
3
4
5
6
7
8
9
10
a
b
c
d
e
f
g
3.
a. Forward and Backward pass
Activity
ES
EF
LS
LF
A
0
2
0
2
B
2
7
5
10
C
2
5
2
5
D
0
3
2
5
E
0
1
2
3
A
2 Days
B
5 Days
Start
E
1 Day
F
2 Days
G
3 Days
H
5 Days
End
C
3 Days
D
3 Days
b. Activity Slack
A 0
B 3
C 0
D 2
E 2
F 2
3 c. Gantt Chart
Time Period
Activity
1
2
3
4
5
6
7
8
9
10
A
B
C
D
E
F
G
H