4.) Expand phone lines with part-time people. This is similar to alternative number
two except it uses part-time clerks and patients are asked to call back later in
the week to actually schedule an appointment. Patients no longer get a busy
signal as they do with the present system. This is the least expensive
alternative.
b. Which alternative is best depends on what level of customer service is desired. When
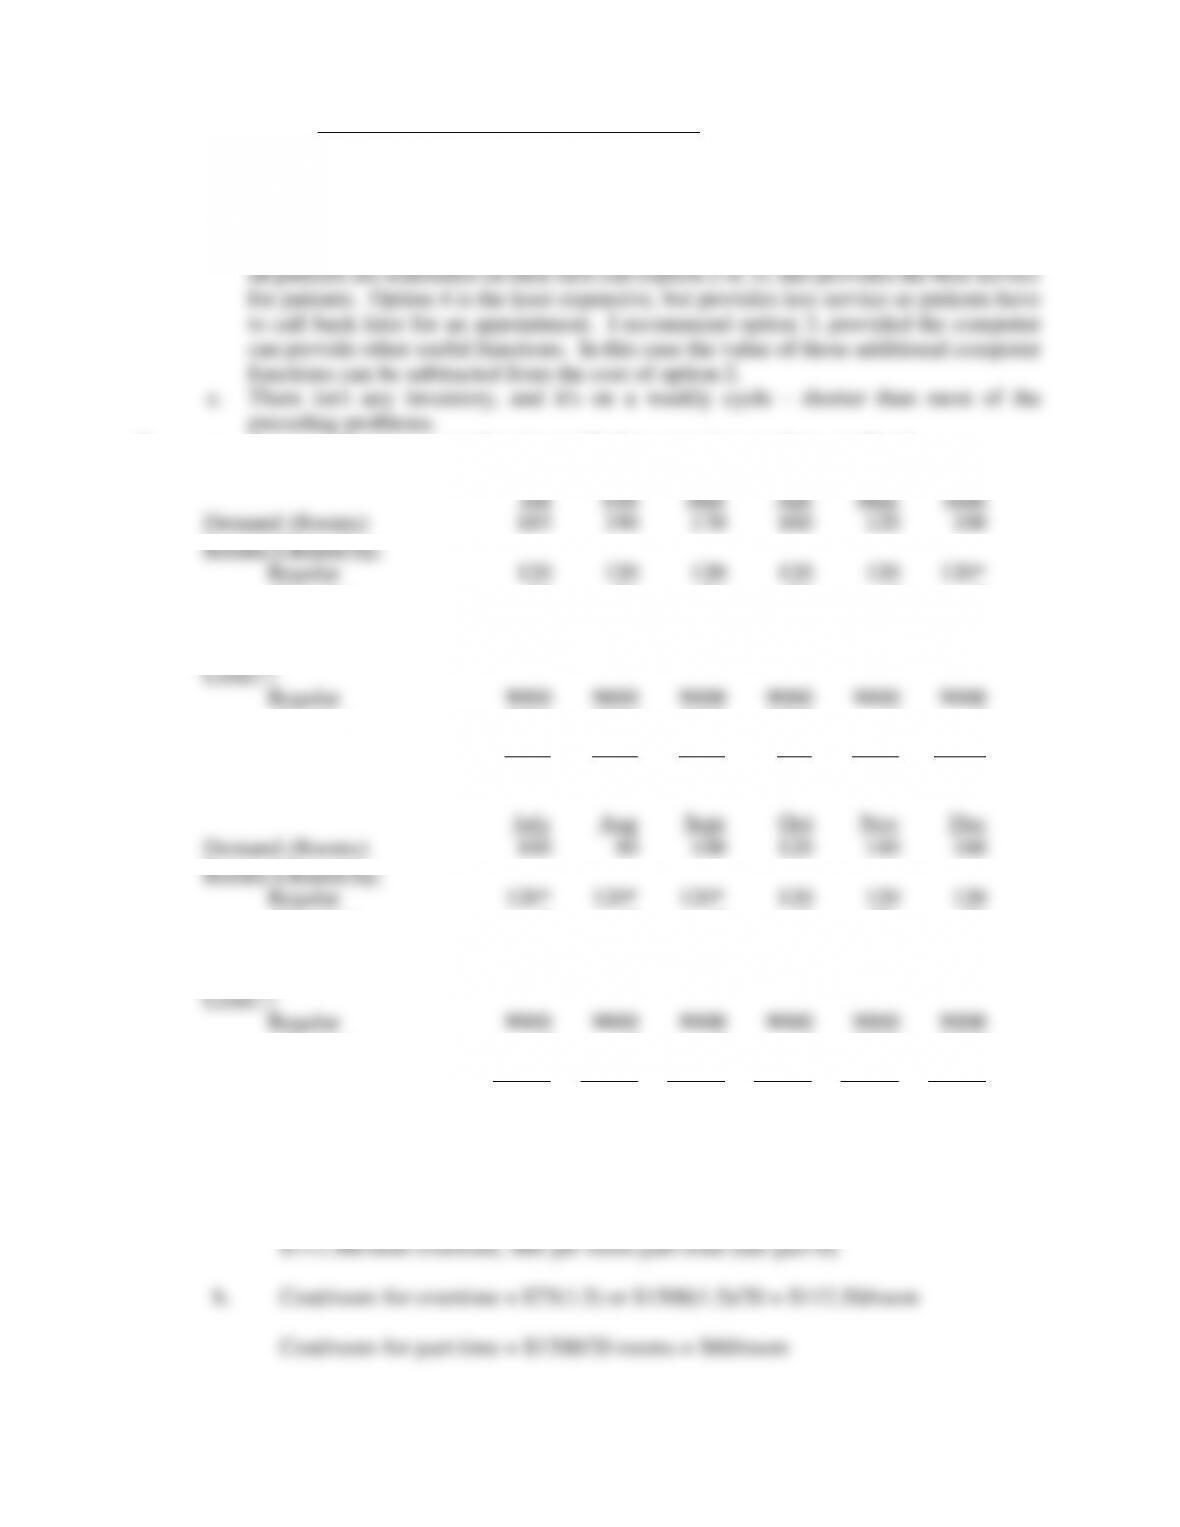
9. a. Assumes maximum overtime is used before part-time workers are hired.
Jan
Feb
Mar
Apr
May
June
Demand (Rooms)
185
190
170
160
120
100
Rooms Cleared by:
Regular
120
120
120
120
120
120*
Overtime
24
24
24
24
0
0
Part Time (PT)
41
46
26
16
0
0
No. PT workers
2.05
2.30
1.3
0.80
0
0
Costs**
Regular
9000
9000
9000
9000
9000
9000
Overtime
2700
2700
2700
2700
0
0
Part Time
2460
2760
1560
960
0
0
TOTAL
14160
14460
13260
12660
9000
9000
July
Aug
Sept
Oct
Nov
Dec
Demand (Rooms)
100
80
100
120
140
160
Rooms Cleared by:
Regular
120*
120*
120*
120
120
120
Overtime
0
0
0
0
20
24
Part Time
0
0
0
0
0
16
No. PT workers
0
0
0
0
0
0.80
Costs**
Regular
9000
9000
9000
9000
9000
9000
Overtime
0
0
0
0
2250
2700
Part Time
0
0
0
0
0
960
TOTAL
9000
9000
9000
9000
11250
12660
Annual Total is $132,450.
* Assumes 6 regular workers employed regardless of demand.
** Assumes room cleaning costs are $75 per room regular time ($1500/20),
1,500 2,442,000
2,000 2,502,000
2,500 2,562,000
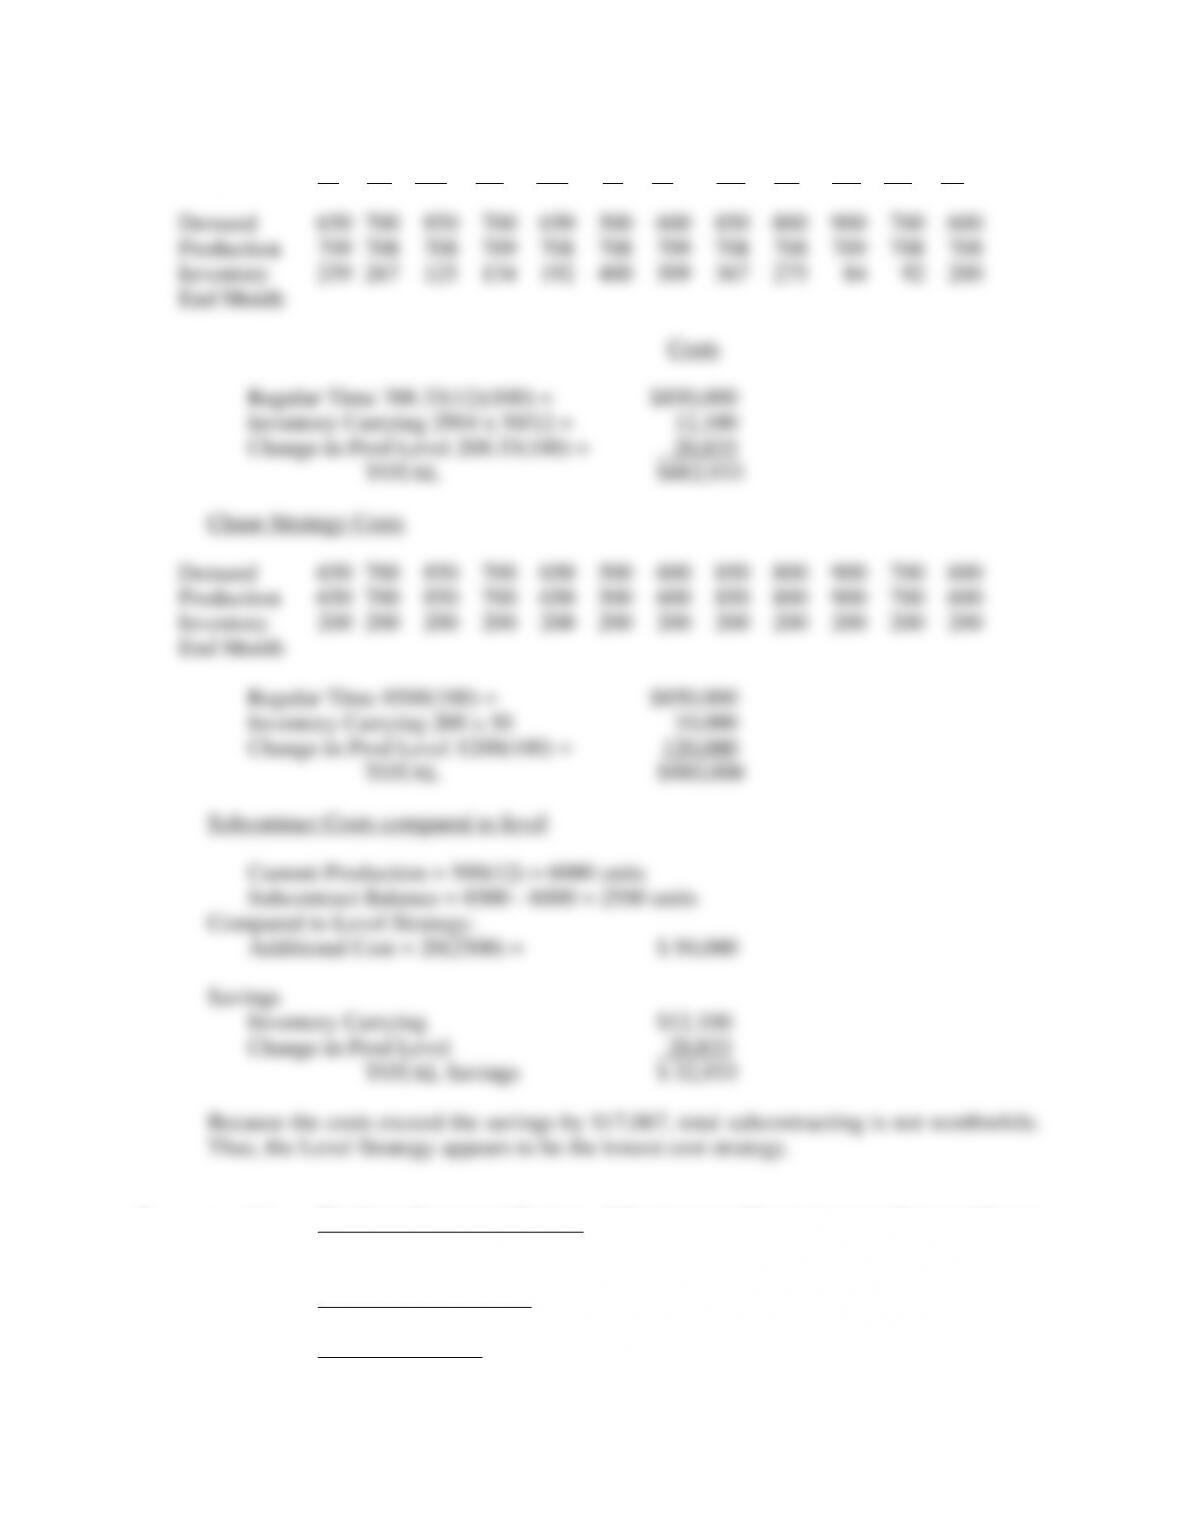
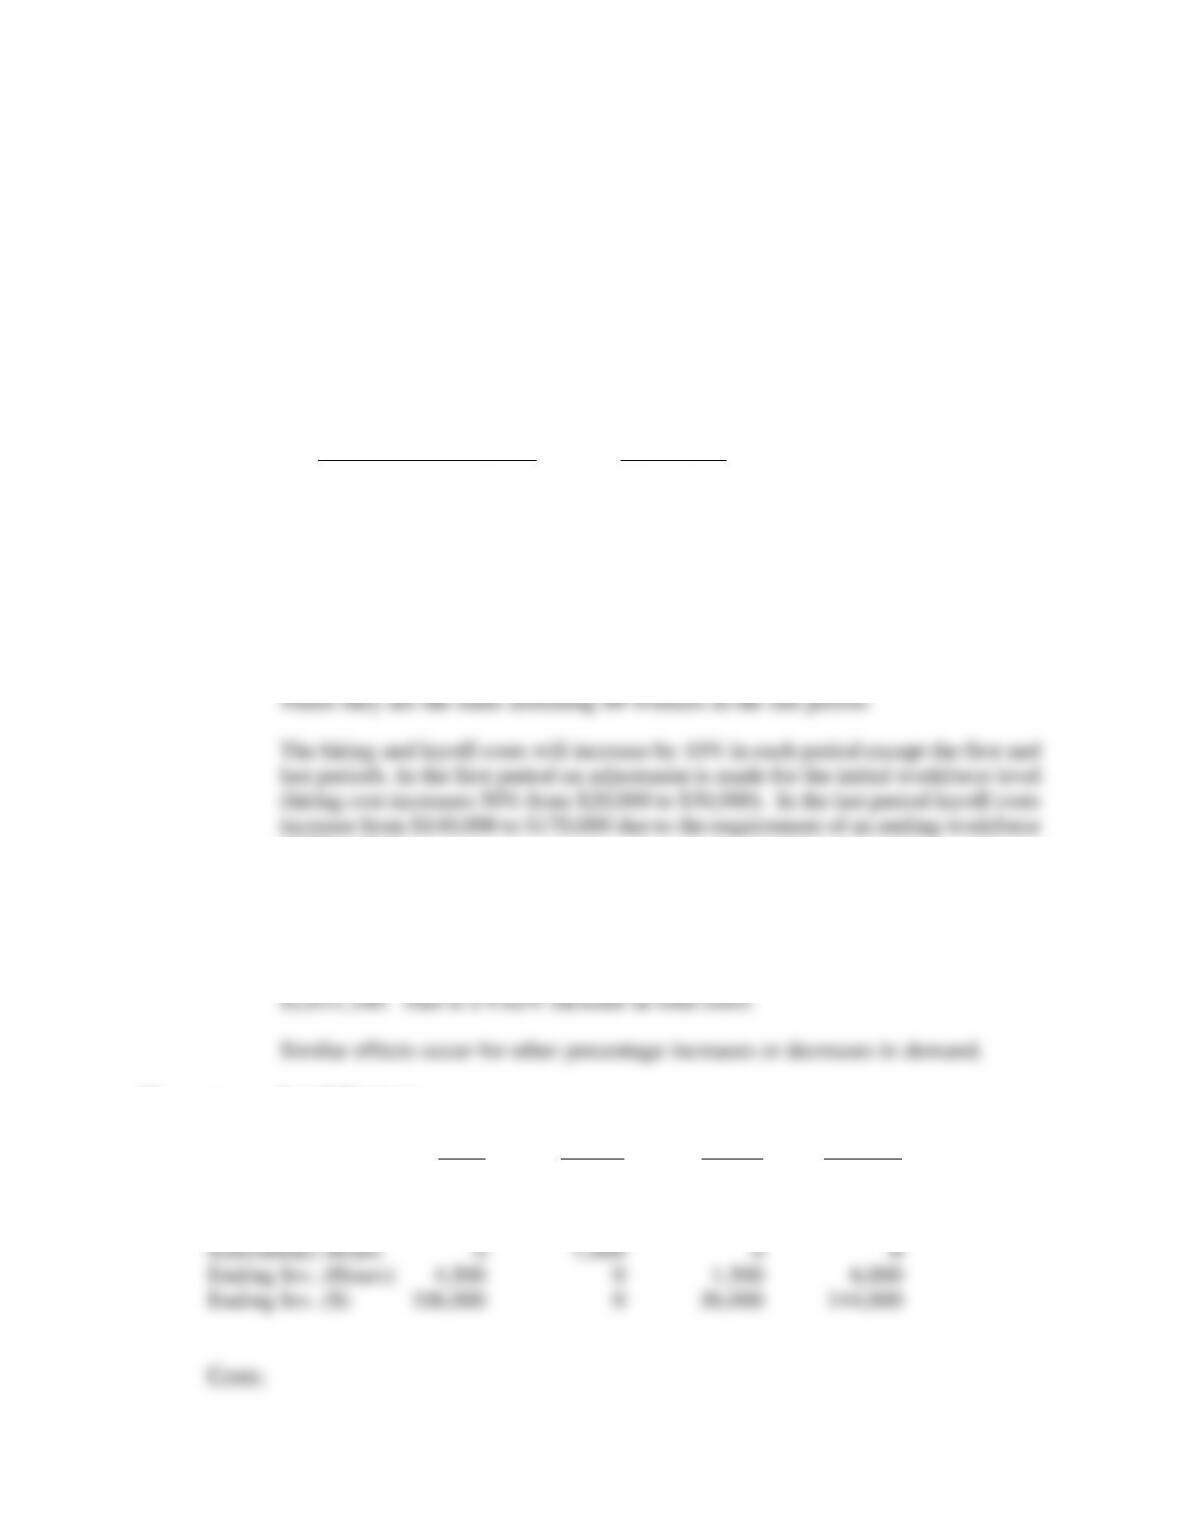
e. The effect of a 10% increase in demand, for example, will have the following
effects:
Increase regular time worker costs by 10% in each period except the last period
of 80 workers.
Inventory costs do not increase at all for the chase strategy except in the last period
where they decrease from $17,500 to $15,000.
The net effect of these changes is an increase in total cost from $2,382,000 to
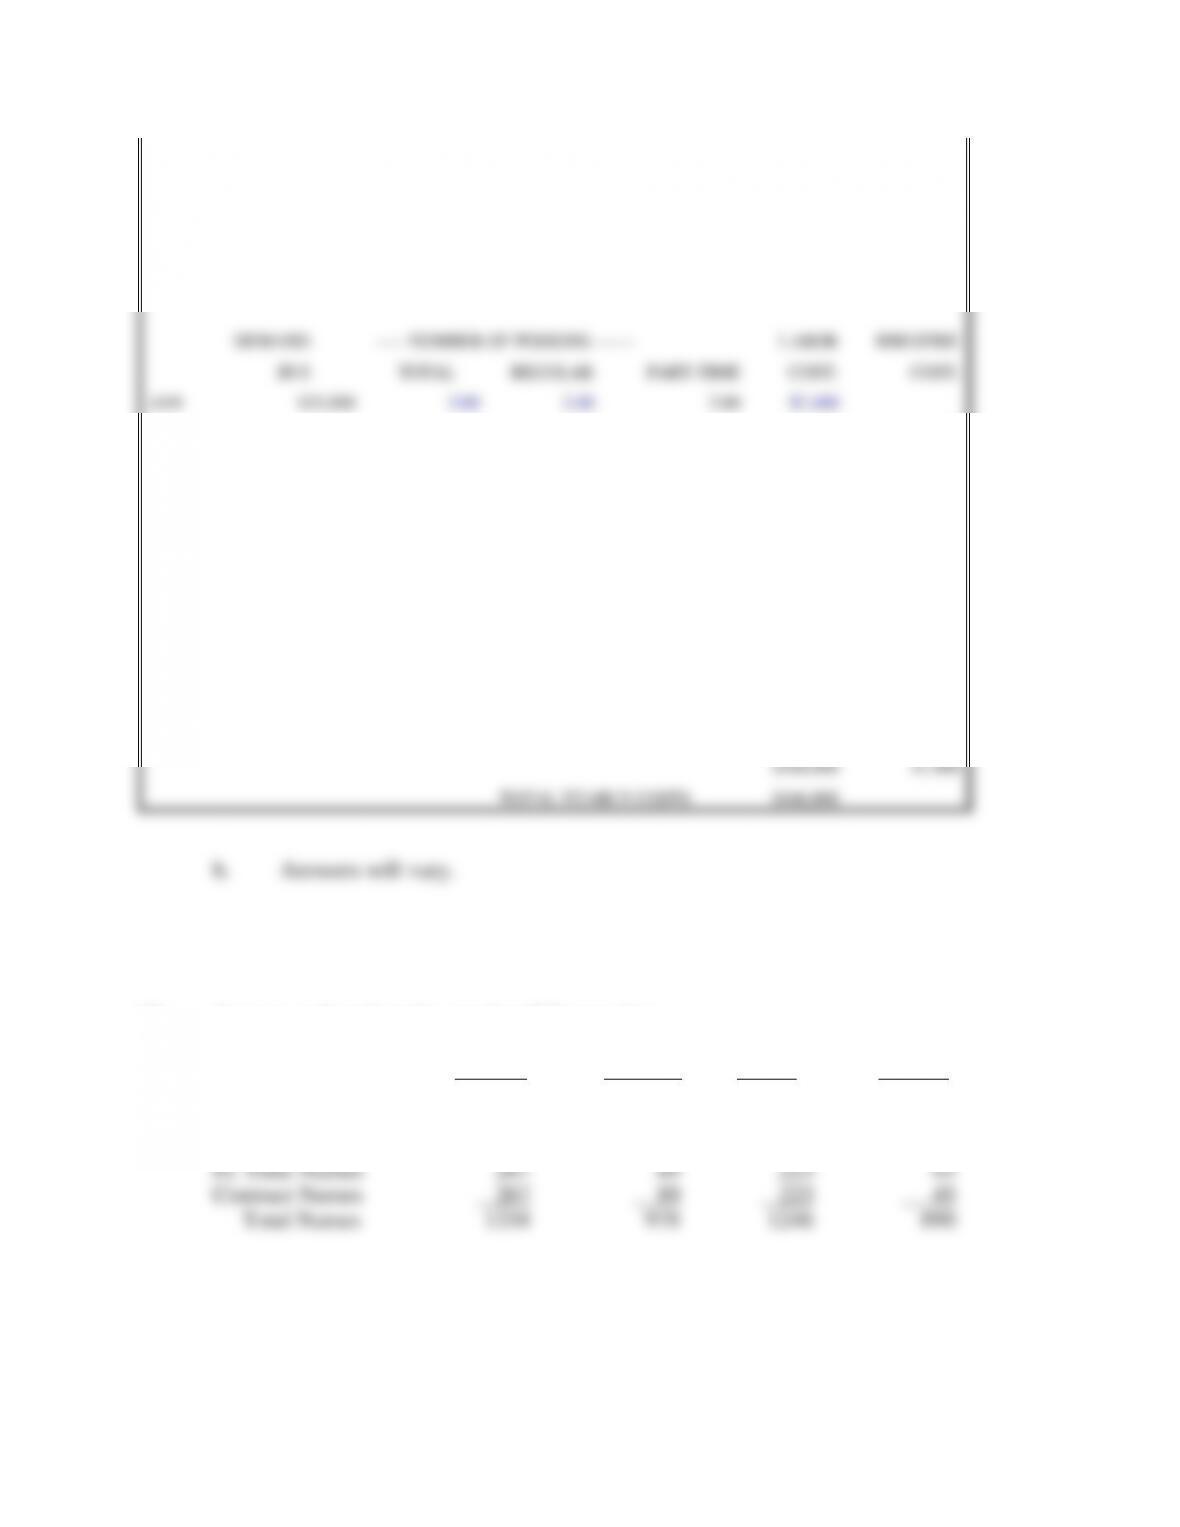
11. a. Level Strategy:
Fall Winter Spring Summer
Demand (Hours) 10,000 15,000 8,000 5,000
Reg. Hours 9,500 9,500 9,500 9,500
Overtime Hours 0 0 0 0
12. a. The cost of this strategy is $146,808.
(Assumes an integer number of regular workers must be used in each period.)
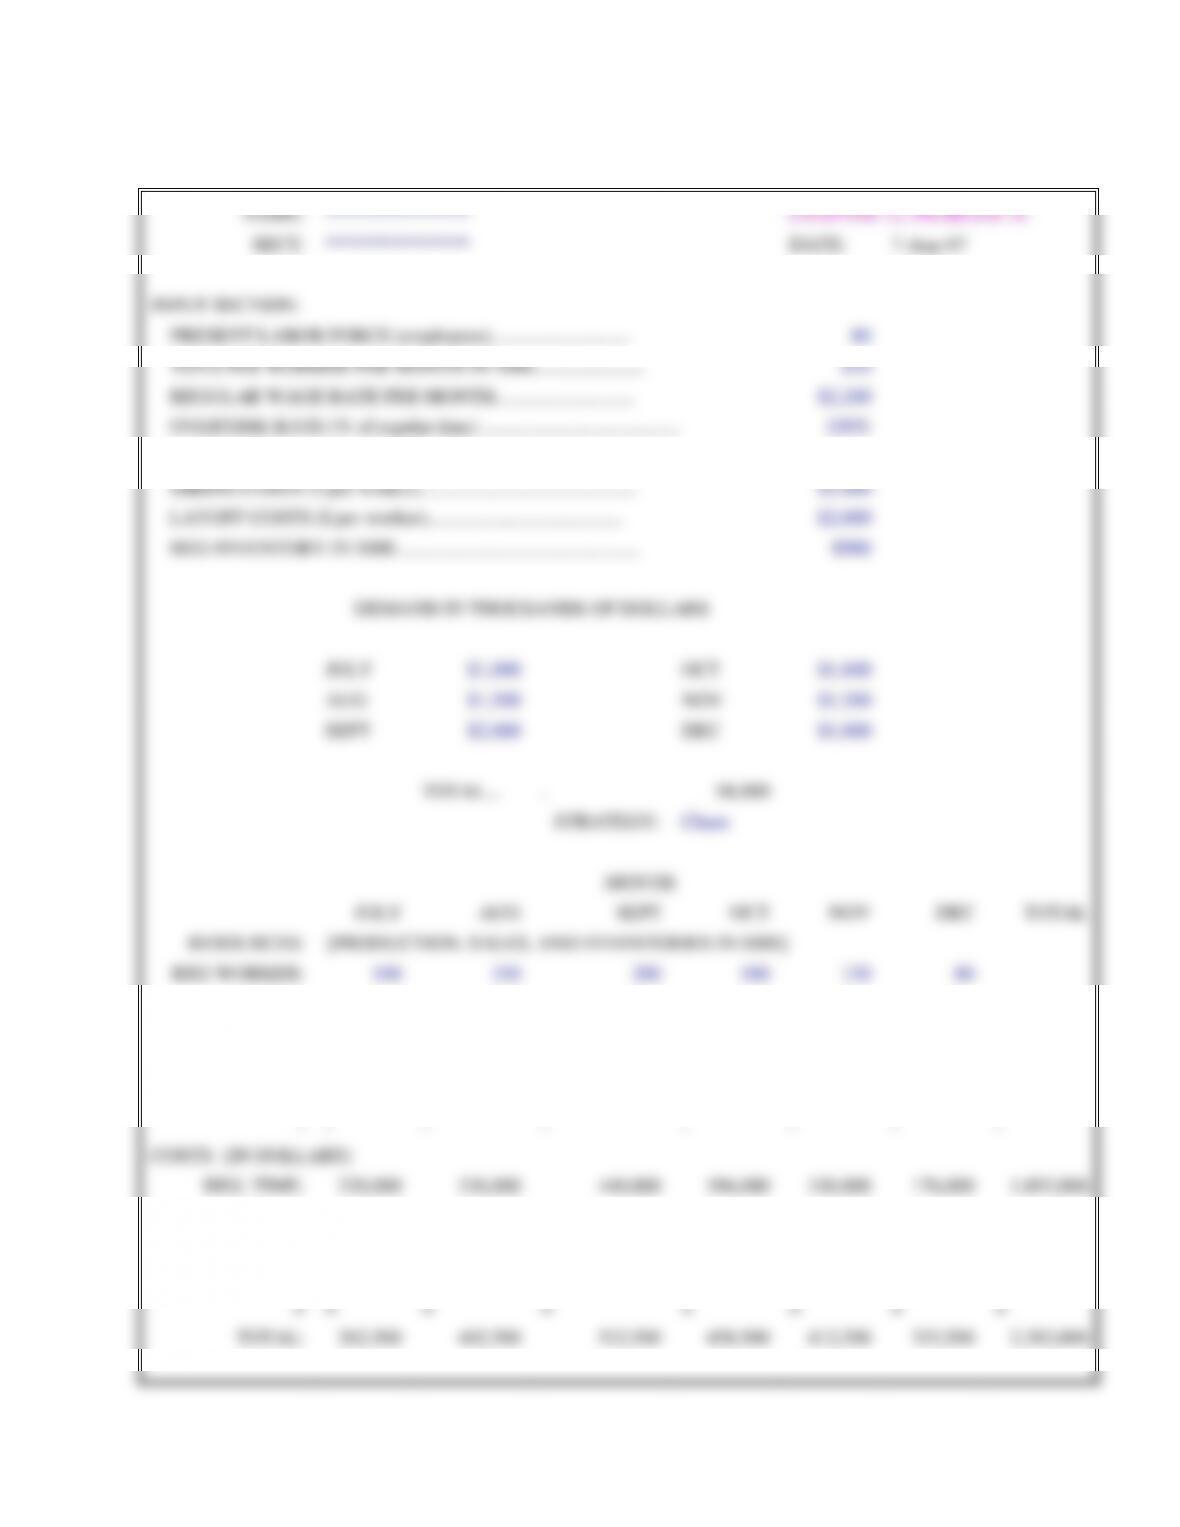
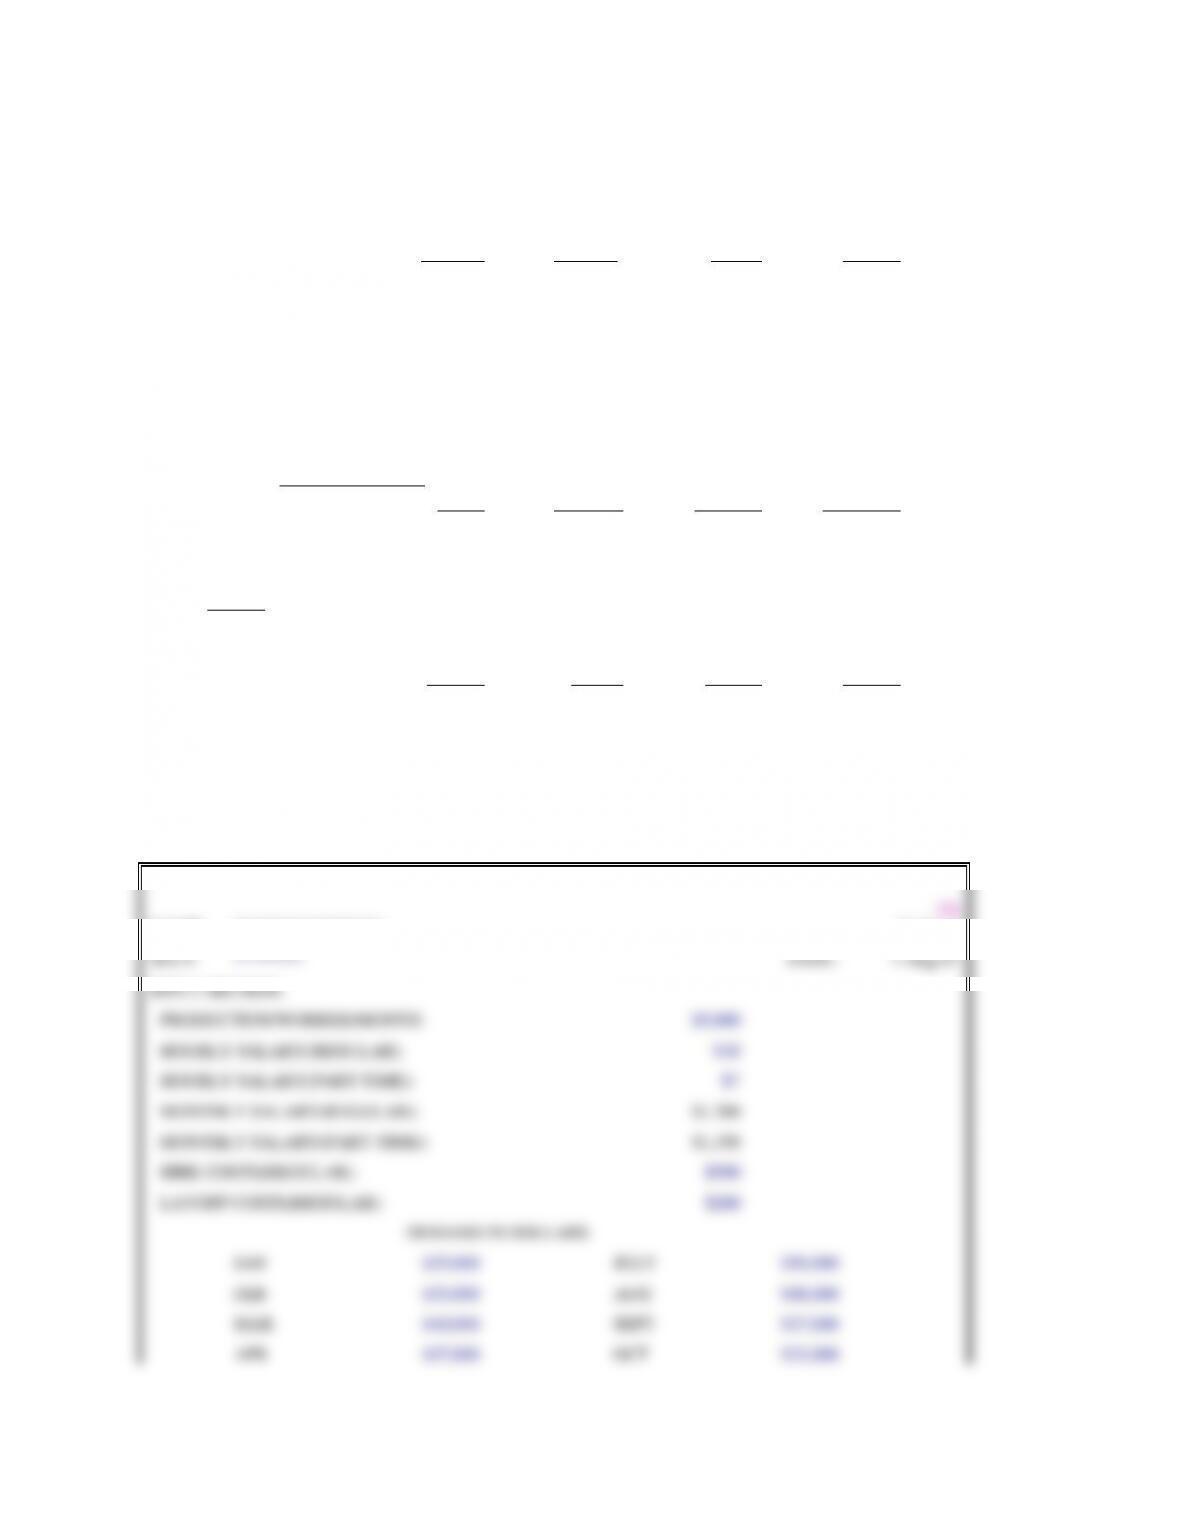
NAME:
*****************
Ch
12, Pr 12
SECT:
********
DATE:
7-Aug-07
INPUT SECTION:
PRODUCTION/WORKER/MONTH:
$5,000
HOURLY SALARY(REGULAR):
$10
HOURLY SALARY(PART-TIME):
$7
MONTHLY SALARY(REGULAR):
$1,700
MONTHLY SALARY(PART-TIME):
$1,190
HIRE COSTS(REGULAR):
$500
LAYOFF COSTS(REGULAR):
$200
DEMAND IN DOLLARS
JAN
$25,000
JULY
$50,000
FEB
$33,000
AUG
$48,000
MAR
$40,000
SEPT
$37,000
APR
$57,000
OCT
$33,000

4.) Expand phone lines with part-time people. This is similar to alternative number
two except it uses part-time clerks and patients are asked to call back later in
the week to actually schedule an appointment. Patients no longer get a busy
signal as they do with the present system. This is the least expensive
alternative.
b. Which alternative is best depends on what level of customer service is desired. When
9. a. Assumes maximum overtime is used before part-time workers are hired.
Jan
Feb
Mar
Apr
May
June
Demand (Rooms)
185
190
170
160
120
100
Rooms Cleared by:
Regular
120
120
120
120
120
120*
Overtime
24
24
24
24
0
0
Part Time (PT)
41
46
26
16
0
0
No. PT workers
2.05
2.30
1.3
0.80
0
0
Costs**
Regular
9000
9000
9000
9000
9000
9000
Overtime
2700
2700
2700
2700
0
0
Part Time
2460
2760
1560
960
0
0
TOTAL
14160
14460
13260
12660
9000
9000
July
Aug
Sept
Oct
Nov
Dec
Demand (Rooms)
100
80
100
120
140
160
Rooms Cleared by:
Regular
120*
120*
120*
120
120
120
Overtime
0
0
0
0
20
24
Part Time
0
0
0
0
0
16
No. PT workers
0
0
0
0
0
0.80
Costs**
Regular
9000
9000
9000
9000
9000
9000
Overtime
0
0
0
0
2250
2700
Part Time
0
0
0
0
0
960
TOTAL
9000
9000
9000
9000
11250
12660
Annual Total is $132,450.
* Assumes 6 regular workers employed regardless of demand.
** Assumes room cleaning costs are $75 per room regular time ($1500/20),
1,500 2,442,000
2,000 2,502,000
2,500 2,562,000
e. The effect of a 10% increase in demand, for example, will have the following
effects:
Increase regular time worker costs by 10% in each period except the last period
of 80 workers.
Inventory costs do not increase at all for the chase strategy except in the last period
where they decrease from $17,500 to $15,000.
The net effect of these changes is an increase in total cost from $2,382,000 to
11. a. Level Strategy:
Fall Winter Spring Summer
Demand (Hours) 10,000 15,000 8,000 5,000
Reg. Hours 9,500 9,500 9,500 9,500
Overtime Hours 0 0 0 0
12. a. The cost of this strategy is $146,808.
(Assumes an integer number of regular workers must be used in each period.)
NAME:
*****************
Ch
12, Pr 12
SECT:
********
DATE:
7-Aug-07
INPUT SECTION:
PRODUCTION/WORKER/MONTH:
$5,000
HOURLY SALARY(REGULAR):
$10
HOURLY SALARY(PART-TIME):
$7
MONTHLY SALARY(REGULAR):
$1,700
MONTHLY SALARY(PART-TIME):
$1,190
HIRE COSTS(REGULAR):
$500
LAYOFF COSTS(REGULAR):
$200
DEMAND IN DOLLARS
JAN
$25,000
JULY
$50,000
FEB
$33,000
AUG
$48,000
MAR
$40,000
SEPT
$37,000
APR
$57,000
OCT
$33,000