
1. a. and b. F1 = 10, To = 2, = .2, ß = .4
Tracking
Day Demand Average Trend Forecast MAD Signal
1 10 10.0 2.0 10.0 0.00 —
2 12 12.0 2.0 12.0 0.00 —
3 13 13.8 1.9 14.0 0.20 -5
4 15 15.6 1.9 15.7 0.30 -5.67
5 17 17.3 1.8 17.4 0.32 -6.56
6 20 19.3 1.9 19.2 0.42 -3.10
7 21 21.2 1.9 21.2 0.37 -4.05
c. The error exceeds 3.75 MAD only for day 3 when MAD first exceeds zero. In no
other period is 3.75 MAD exceeded, so we would consider the MAD within
tolerance. The tracking signal was outside of the -6 limit during day 5, but came
back inside tolerances in days 6 and 7.
1 10 10
2 12 10
3 13 10.4
4 15 10.9
5 17 11.7
6 20 12.8
7 21 14.2

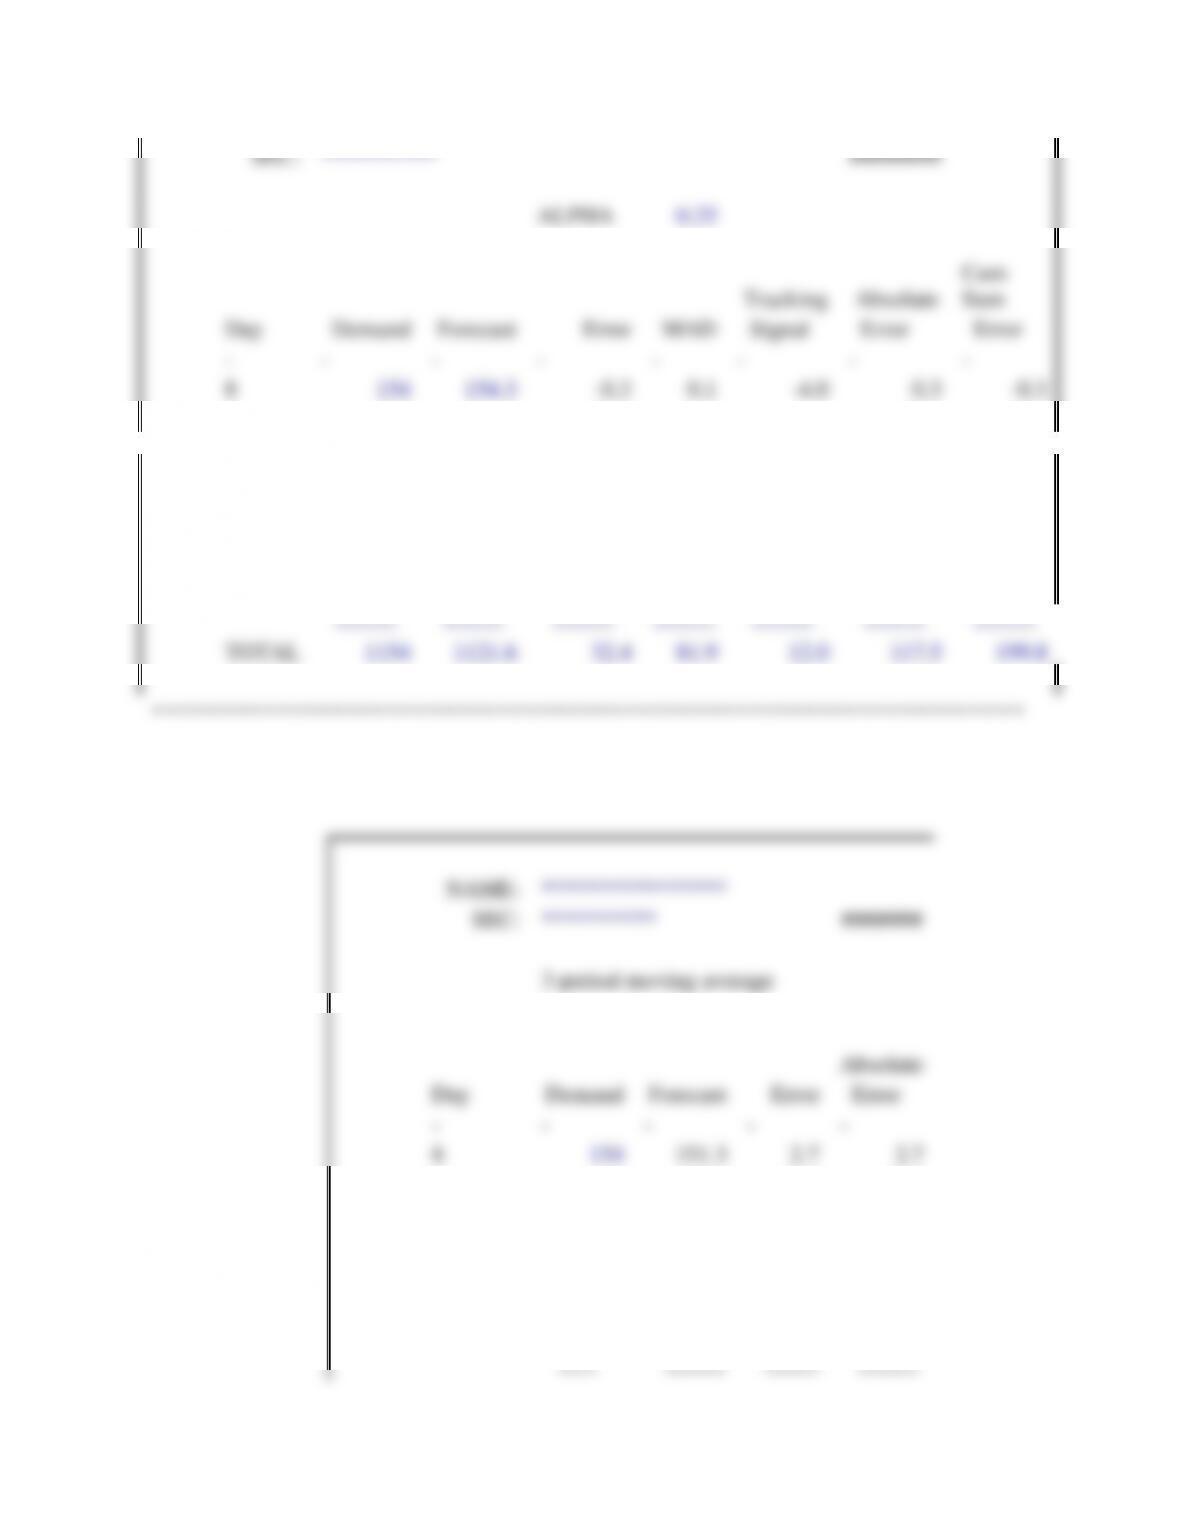
2. a.
Trend Adj
CHAPTER 11
Day
Demand
Average
Trend
Forecast
PROBLEM SP2
——-
—-———
————-
————-
————-
1
80
108.0
23.6
115.00
2
95
124.3
22.1
131.60
3
120
141.1
21.1
146.42
NAME:
**********
********
4
110
151.8
19.0
162.21
SECT.:
********
5
75
151.6
15.2
170.76
DATE:
18-Dec-08
6
60
145.4
10.9
166.77
7
50
135.0
6.6
156.30
8
85
130.3
4.4
141.68
9
99
127.6
2.9
134.72
10
110
126.4
2.1
130.51
11
90
120.8
0.6
128.53
A[o] =
90
12
80
113.1
-1.1
121.41
T[o] =
25
13
65
102.6
-3.0
112.05
alpha =
0.20
14
50
89.7
-4.9
99.68
beta =
0.20
2. b.
16
18
20
22
Chapter 11, Problem SP 1d
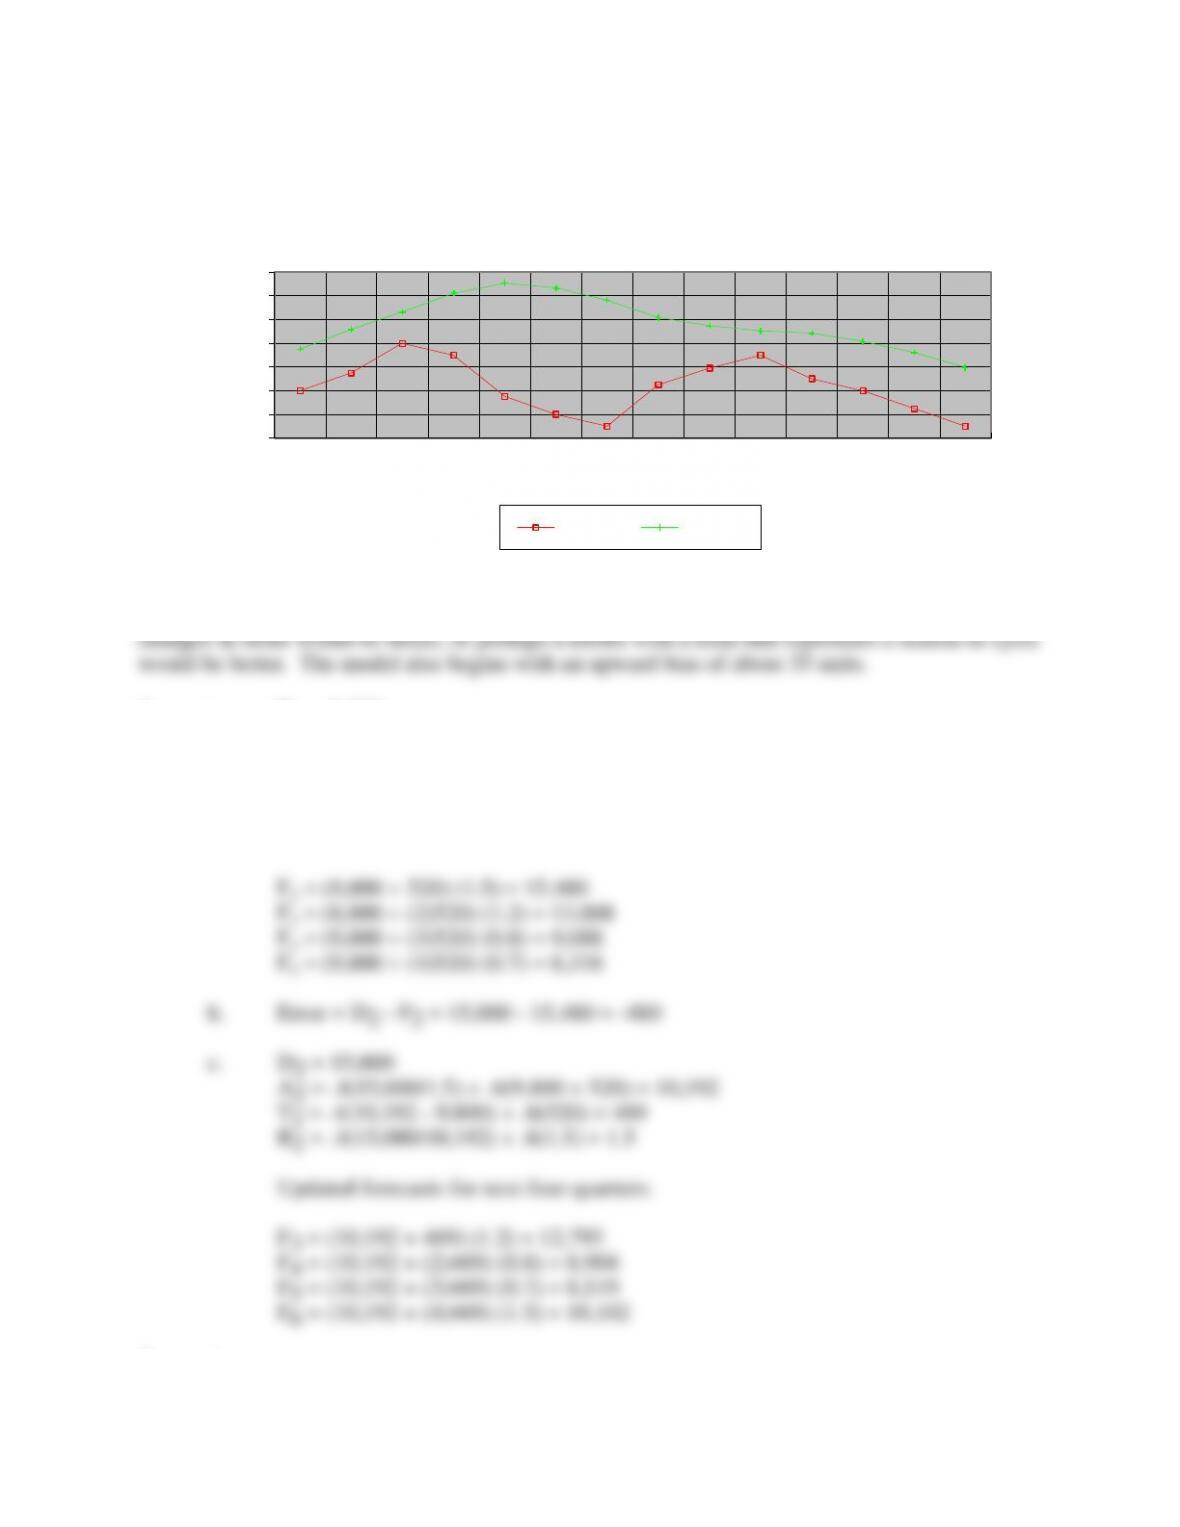
c. No, the model does not appear to fit the data well. A model with more sensitivity to
3. a. D1 = 6,000
A1 = .4(6,000/.75) + .6(10,000 + 1,000) = 9,800
T1 = .4(9,800 – 10,000) + .6(1,000) = 520
R1 = .4(6,000/9,800) + .6(.75) = 0.7
Updated forecasts for next four quarters:
4. a.
40
60
80
100
120
140
160
180
1 2 3 4 5 6 7 8 9 10 11 12 13 14
Days 1 through 14
Chapter 11, Problem SP2, Part b
Demand vs Forecast
Demand Forecast
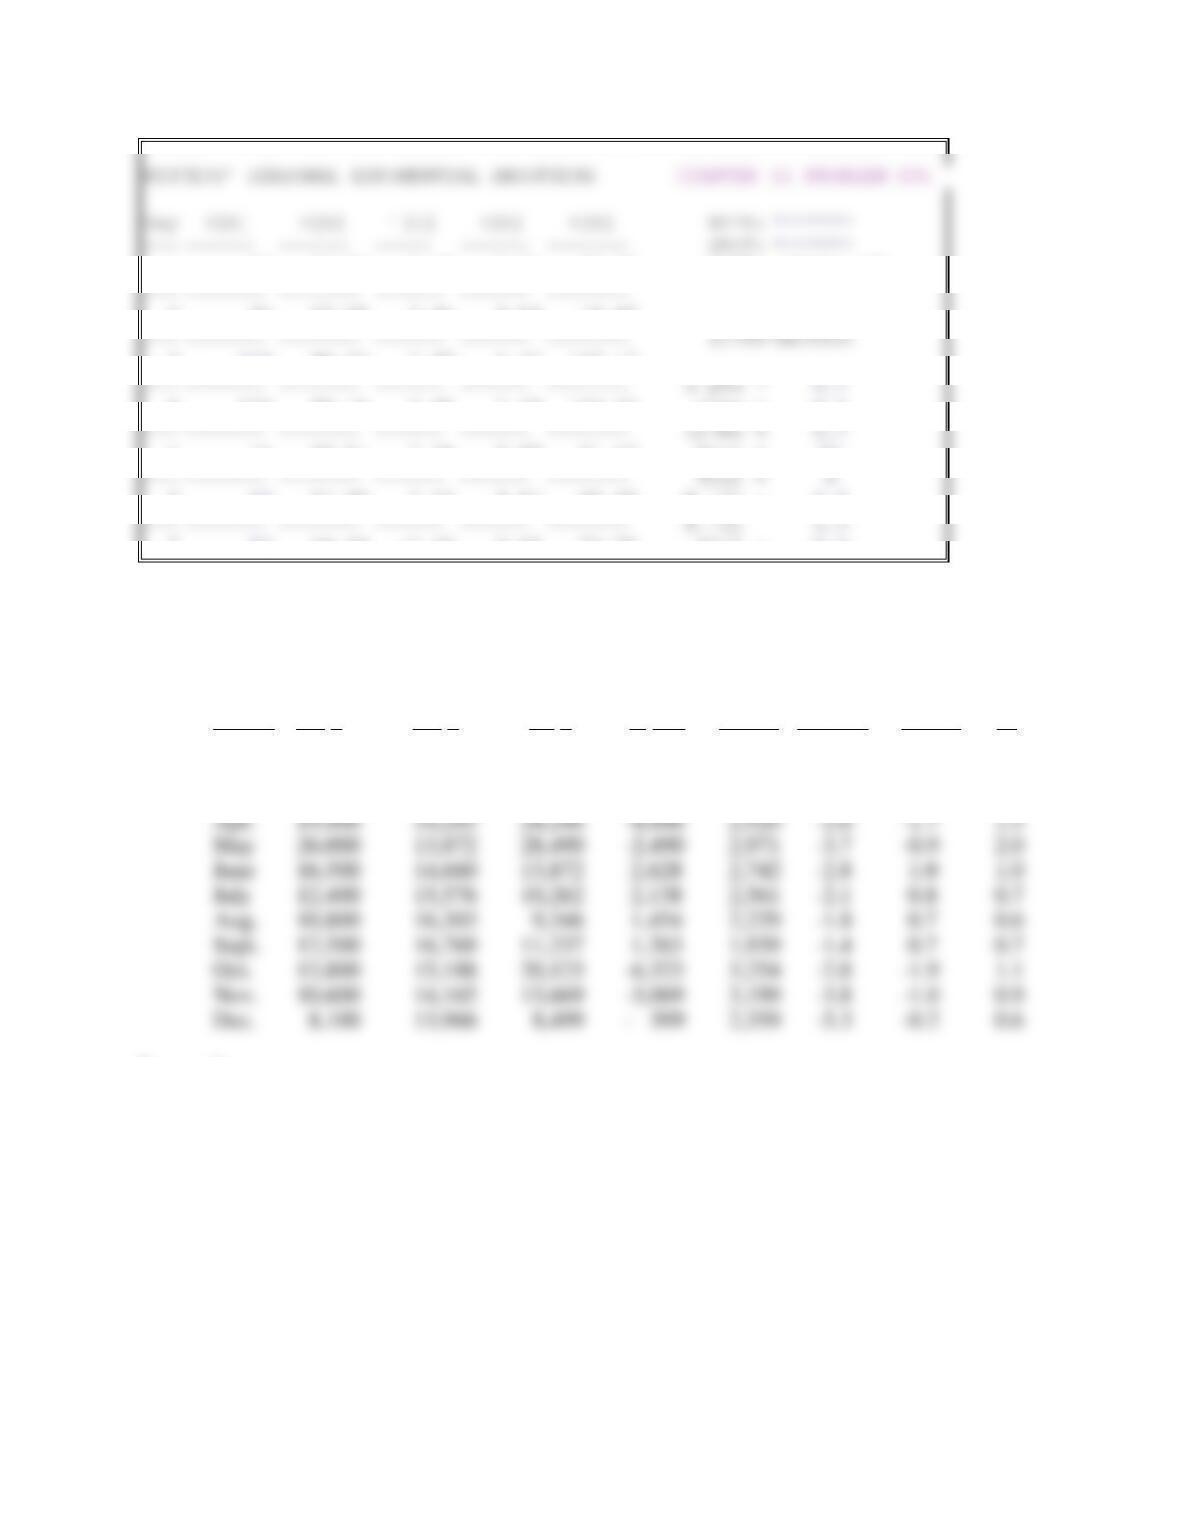
WINTERS’ SEASONAL EXPONENTIAL SMOOTHING
CHAPTER 11 PROBLEM SP4
Day
D[t]
A[t]
T[t]
R[t]
F[t]
NAME:
*******
—
——
——
—–
——
——-
SECT:
*******
1
80
86.50
0.15
0.81
68.00
DATE:
18–Dec–08
—
——-
——-
——
——
——-
2
95
89.68
0.45
0.84
70.40
—
——-
——-
——
——
——-
INPUT
SECTION
3
120
90.35
0.47
1.30
117.17
—
——-
——-
——
——
——-
alpha =
0.1
4
110
90.18
0.41
1.29
118.33
beta =
0.1
—
——-
——-
——
——
——-
gamma =
0.1
5
75
89.87
0.34
0.89
81.53
A[o] =
85
—
——-
——-
——
——
——-
T[o] =
0
6
60
87.90
0.11
0.87
80.60
R[–2] =
0.8
—
——-
——-
——
——
——-
R[–1] =
1.3
7
50
84.94
–0.20
0.84
76.78
R[o] =
0.9
b. 6
5. a.
Tracking Dt – Ft/
Month Dt At Ft Dt – Ft MAD Signal MAD Rt
Jan. 13,600 15,600 12,000 1,600 480 3.3 3.3 0.8
Feb. 21,800 14,553 28,080 -6,280 2,220 –2.1 -2.8 1.7
Mar. 14,900 15,154 13,098 1,802 2,095 -1.4 0.9 0.9
5. b.
5. c. (See part a for Tracking Signal and MAD calculations.) All errors (Dt –Ft) are less
than 3.75 MAD, and the tracking signal is within the ± 6 tolerance.
5. d. Seasonal
Month Ratio Forecast
Jan 0.85 12,613
Feb. 1.54 22,789
Mar. 1.06 15,621
Apr. 1.36 20,147
14,979 is the Average Level
-5.72 is the Trend
Forecast: (Y ) (Seasonal Ratio)
7,000
12,000
17,000
22,000
27,000
32,000
1 2 3 4 5 6 7 8 9 10 11 12
Chapter 11, Problem SP5b
Demand Forecast
^
1. a. and b. F1 = 10, To = 2, = .2, ß = .4
Tracking
Day Demand Average Trend Forecast MAD Signal
1 10 10.0 2.0 10.0 0.00 —
2 12 12.0 2.0 12.0 0.00 —
3 13 13.8 1.9 14.0 0.20 -5
4 15 15.6 1.9 15.7 0.30 -5.67
5 17 17.3 1.8 17.4 0.32 -6.56
6 20 19.3 1.9 19.2 0.42 -3.10
7 21 21.2 1.9 21.2 0.37 -4.05
c. The error exceeds 3.75 MAD only for day 3 when MAD first exceeds zero. In no
other period is 3.75 MAD exceeded, so we would consider the MAD within
tolerance. The tracking signal was outside of the -6 limit during day 5, but came
back inside tolerances in days 6 and 7.
1 10 10
2 12 10
3 13 10.4
4 15 10.9
5 17 11.7
6 20 12.8
7 21 14.2
2. a.
Trend Adj
CHAPTER 11
Day
Demand
Average
Trend
Forecast
PROBLEM SP2
——-
—-———
————-
————-
————-
1
80
108.0
23.6
115.00
2
95
124.3
22.1
131.60
3
120
141.1
21.1
146.42
NAME:
**********
********
4
110
151.8
19.0
162.21
SECT.:
********
5
75
151.6
15.2
170.76
DATE:
18-Dec-08
6
60
145.4
10.9
166.77
7
50
135.0
6.6
156.30
8
85
130.3
4.4
141.68
9
99
127.6
2.9
134.72
10
110
126.4
2.1
130.51
11
90
120.8
0.6
128.53
A[o] =
90
12
80
113.1
-1.1
121.41
T[o] =
25
13
65
102.6
-3.0
112.05
alpha =
0.20
14
50
89.7
-4.9
99.68
beta =
0.20
2. b.
16
18
20
22
Chapter 11, Problem SP 1d
c. No, the model does not appear to fit the data well. A model with more sensitivity to
3. a. D1 = 6,000
A1 = .4(6,000/.75) + .6(10,000 + 1,000) = 9,800
T1 = .4(9,800 – 10,000) + .6(1,000) = 520
R1 = .4(6,000/9,800) + .6(.75) = 0.7
Updated forecasts for next four quarters:
4. a.
40
60
80
100
120
140
160
180
1 2 3 4 5 6 7 8 9 10 11 12 13 14
Days 1 through 14
Chapter 11, Problem SP2, Part b
Demand vs Forecast
Demand Forecast
WINTERS’ SEASONAL EXPONENTIAL SMOOTHING
CHAPTER 11 PROBLEM SP4
Day
D[t]
A[t]
T[t]
R[t]
F[t]
NAME:
*******
—
——
——
—–
——
——-
SECT:
*******
1
80
86.50
0.15
0.81
68.00
DATE:
18–Dec–08
—
——-
——-
——
——
——-
2
95
89.68
0.45
0.84
70.40
—
——-
——-
——
——
——-
INPUT
SECTION
3
120
90.35
0.47
1.30
117.17
—
——-
——-
——
——
——-
alpha =
0.1
4
110
90.18
0.41
1.29
118.33
beta =
0.1
—
——-
——-
——
——
——-
gamma =
0.1
5
75
89.87
0.34
0.89
81.53
A[o] =
85
—
——-
——-
——
——
——-
T[o] =
0
6
60
87.90
0.11
0.87
80.60
R[–2] =
0.8
—
——-
——-
——
——
——-
R[–1] =
1.3
7
50
84.94
–0.20
0.84
76.78
R[o] =
0.9
b. 6
5. a.
Tracking Dt – Ft/
Month Dt At Ft Dt – Ft MAD Signal MAD Rt
Jan. 13,600 15,600 12,000 1,600 480 3.3 3.3 0.8
Feb. 21,800 14,553 28,080 -6,280 2,220 –2.1 -2.8 1.7
Mar. 14,900 15,154 13,098 1,802 2,095 -1.4 0.9 0.9
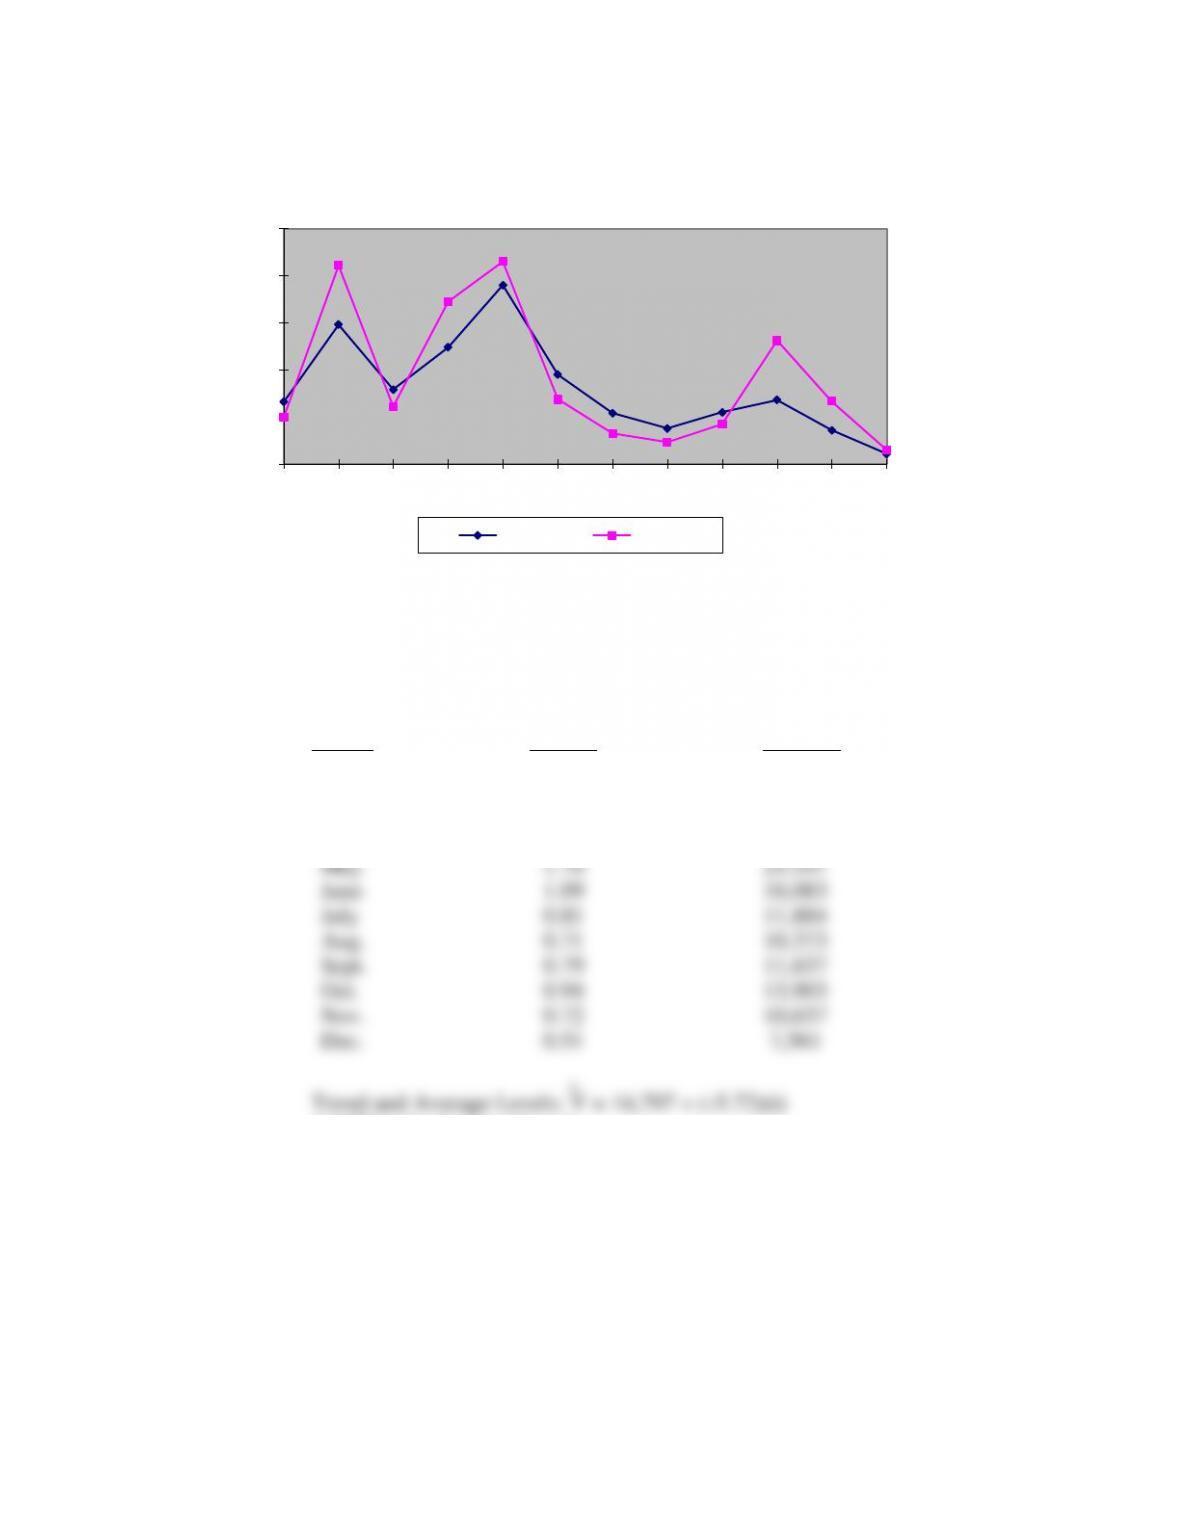
5. b.
5. c. (See part a for Tracking Signal and MAD calculations.) All errors (Dt –Ft) are less
than 3.75 MAD, and the tracking signal is within the ± 6 tolerance.
5. d. Seasonal
Month Ratio Forecast
Jan 0.85 12,613
Feb. 1.54 22,789
Mar. 1.06 15,621
Apr. 1.36 20,147
14,979 is the Average Level
-5.72 is the Trend
Forecast: (Y ) (Seasonal Ratio)
7,000
12,000
17,000
22,000
27,000
32,000
1 2 3 4 5 6 7 8 9 10 11 12
Chapter 11, Problem SP5b
Demand Forecast
^