
A feasible solution to an optimization problem is a particular combination of decision
variables that satisfies some of the constraints.
Spreadsheet flexibility implies that the user should enter each input only once in the
model.
The explosion process calculates the demand for the parent of the children.
To provide dependability of delivery, Federal Express acquired its own fleet of
airplanes.

The concept of the quality trilogy is attributed to Philip Crosby.
Moving average forecasts with a smaller number of observations are more subject to
random changes in the data than those with a larger number of observations.
Given a Linear Program with a minimization objective, the optimal objective function
value may decrease if a ≥ constraint is added to the program.

Analyzing customer preferences is an ongoing process.
The make-to-stock product and service strategy has the shortest delivery lead time
among the possible strategies, but the customer has no involvement in product design.
The available-to-promise row in an extended MPS record shows how many committed
units the company has available for delivery at a given time.
The simple moving average forecasting method uses fewer periods of data than the
simple mean forecasting method does.

In a multi-server system, you must first verify that su > λ.
An improvement tool that utilizes cross-functional teams to plan and deliver
improvements to specific processes during two- or three-day marathon sessions is
called a kanban blitz.
Visitors to a major amusement park would be considered a finite customer population.

An example of a transformation is waiting to see the doctor.
Statistical quality control is a subset of statistical process control.
Location managers are typically responsible for managing the movement of products
between locations.
Understanding the stages of the life cycle is not important for product design purposes.

Productivity is essentially:
a) something to fill out managers’ reports
b) measure of resource effectiveness
c) a scorecard of how efficiently resources are used
d) a balance scorecard metric
e) the current business fad
Which of the following scheduling rules minimizes the average number of jobs in the
system?
a) first come, first served
b) last come, first served
c) earliest due date
d) shortest processing time
e) longest processing time
Which phase in the project life cycle involves identifying the need for the project?
a) conception
b) feasibility analysis or study

c) planning
d) execution
e) termination
Suppose that a plant has a daily productivity of 0.85 parts per employee? What can we
conclude?
a) the plant must be very labor-intensive
b) the plant is not earning profits
c) the plant must be highly automated
d) the plant should lay off workers
e) nothing
If the costs (S and H) and demands (D) are the same, which of the following is true with
regard to the EPQ model as compared to the EOQ model?
a) The lot size under the EPQ model is bigger than under the EOQ model.
b) The maximum inventory level is higher under the EPQ model than under the EOQ
model.
c) The two models use different formulas to compute annual ordering cost.

d) The inventory depletion rate is not the same for both models.
e) Both models use the same formula to compute annual holding cost.
_________________ crossdocking is the consolidating of shipments from LTL and
small package industries to gain economies of scale.
a) Warehouse
b) Manufacturing
c) Distributor
d) Transportation
e) Retail
Setup time is changed:
a) once each day regardless of product changes.
b) each time the operator begins the machine.
c) each time the machine is prepared to produce the desired item quantity.
d) for each shift that works on the desired item quantity manufacturing.

e) on rare occasions if it takes significant time.
What is the lower control limit for a c-chart if the average number of defects found over
320 samples is equal to 16?
a) 6.584
b) 4
c) 20
d) 0
e) 12
What tool is useful in helping everyone develop a clear picture of how an operation or
process works?
a) Control chart
b) Pareto analysis
c) Checklist
d) Flowchart

e) Scatter diagram
The reference desk of a university library receives requests for assistance. Assume that
a Poisson probability distribution with a mean rate of 10 requests per hour can be used
to describe the arrival pattern and that service times follow the exponential probability
distribution, with a mean service rate of 12 requests per hour.
a) What is the probability that there are no requests for assistance in the system?
b) What is the average number of requests that will be waiting for service?
c) What is the average waiting time in minutes before service begins?
d) What is the average time at the reference desk in minutes (waiting time plus service
time)?
e) What is the probability that a new arrival has to wait for service?
f) Suppose that another helper could be hired to join the desk, and she would have the
same service rate. Assuming that all patrons wait in a single line, what is the new
average waiting time in minutes before service begins?
g) Instead of the change in question f, suppose that a ‘super’ librarian can be hired who
can handle 16 requests per hour. Now what is the average waiting time in minutes
before service begins?
Consider a project having the following seven activities:
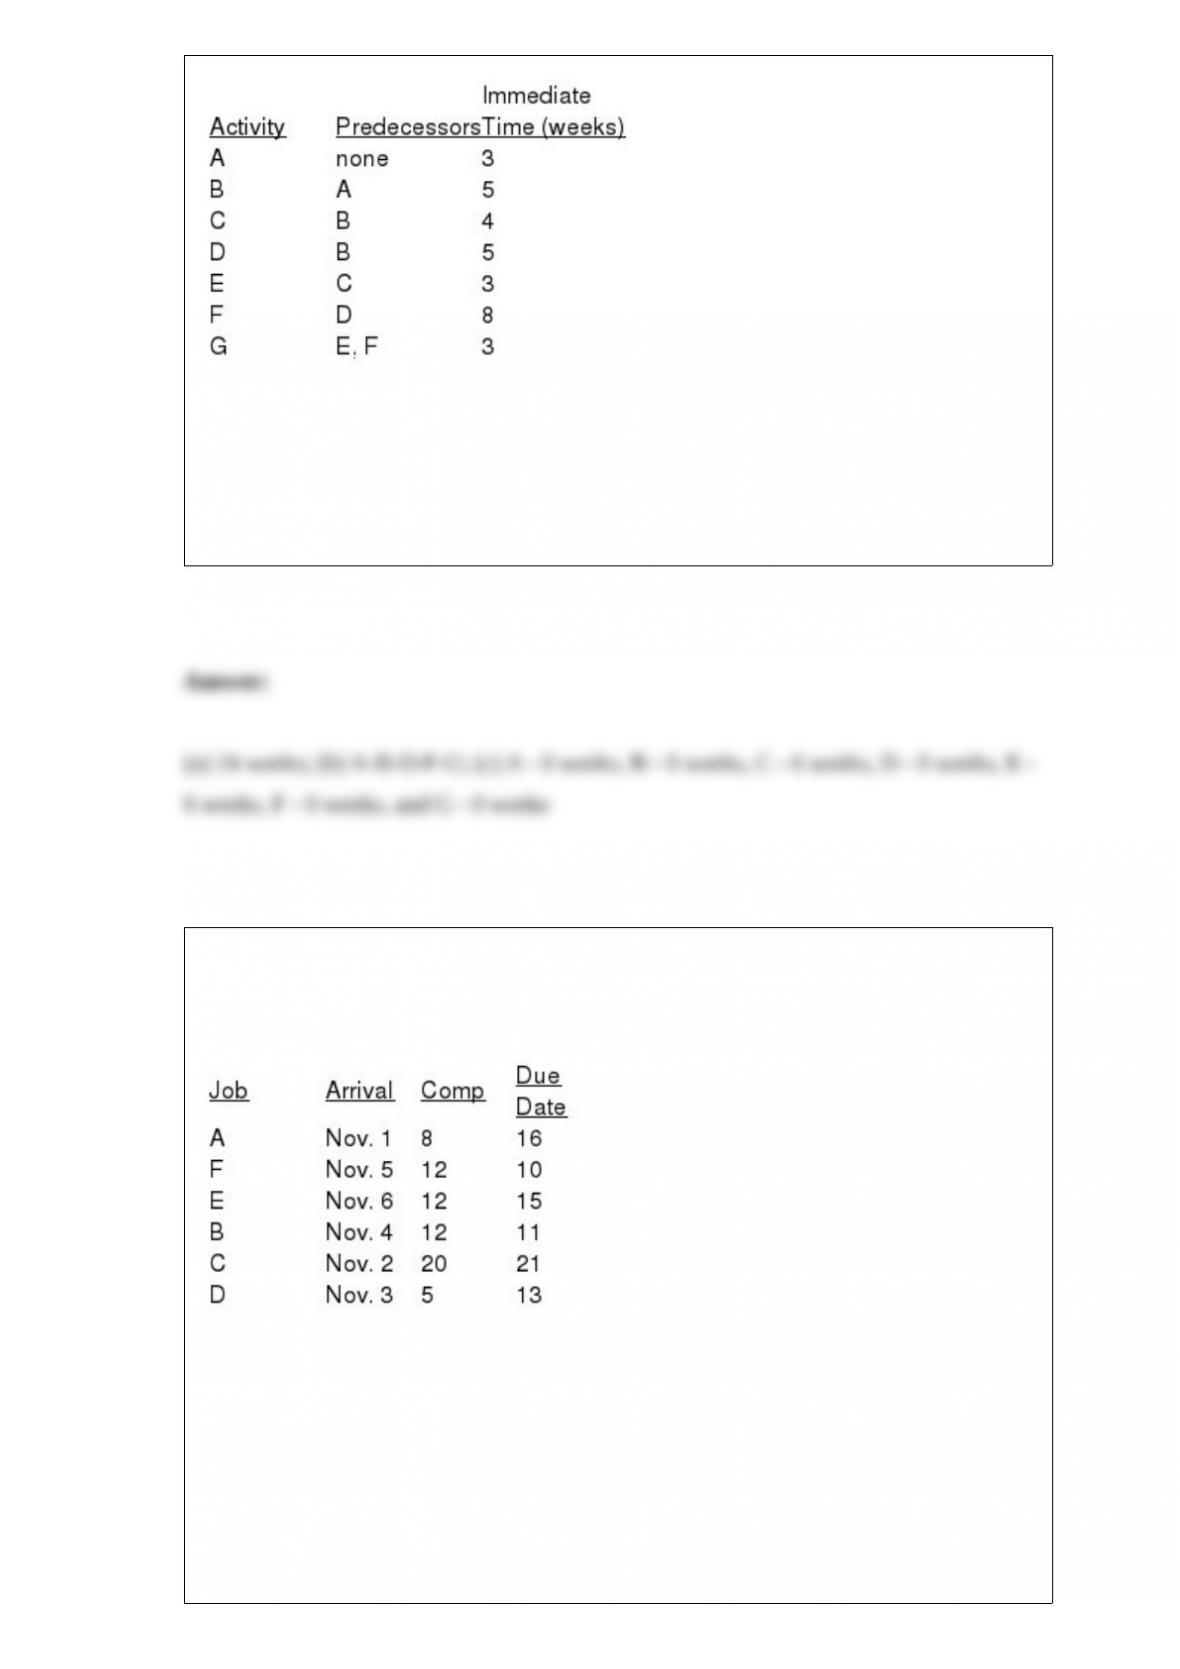
(a) What is the critical time?
(b) What is the critical path?
(c) What is the slack for each activity?
The following jobs must be processed in the Super Clean motor shop. Assume that the
company operates seven days per week. Using FCFS as the priority rule, calculate
average job tardiness.
a) 0
b) 6
c) .5
d) -2.833

e) -8
Suppose that you are using the four-period simple moving average method to forecast
sales, and sales have been increasing by 40% every period. How will your forecasts
perform?
a) Forecasts will be increasing by 40.0% every period.
b) Forecasts will be higher than actual.
c) Forecasts will equal actual.
d) Forecasts will be decreasing.
e) Forecasts will be increasing by 10.0% every period.

The advantages of cell manufacturing using a U-shaped cell include all of the following
except
a) Production efficiency with flexibility to produce a variety of parts
b) Easy reach and flexibility for workers
c) Higher worker satisfaction
d) No special material handling
e) Longer setup times
Consider a periodic review system with a lead time of 2 weeks, a review period of 4
weeks, average weekly demand of 100 units, standard deviation of weekly demand of
20 units, and a desired cycle-service level of 90%. (a) What is the target inventory
level? (b) If it is time to review the item and 10 units are on hand, how many units
should be ordered?
Small lot production
a) Increases inventory
b) Decreases flexibility

c) Reduces setup
d) Increases excess processing
e) Shortens lead time
Raissa’s early learning center must decide how many students they need to enroll to
make a profit. There is a trade off in quality of care and the number of students enrolled.
They must make a profit but not have so many children that the care suffers. They must
establish the point where the number of enrolled students establishes the first profit
point. They’ve determined that their fixed costs are $4,500 per month. It costs them an
additional $150 per month for each enrolled child. They only enroll students on a
monthly basis at a price of $450. How many students must they enroll to start making a
profit?
Customers often link long waits to ______ service.
Consider a workstation that can process 1060 units per hour. It takes 15 minutes to
receive an order from the previous station. The container size is 20 units. The factory
sets safety stock at 20 percent of demand during lead time. How many kanbans are
needed for the workstation?
Describe the relative benefits of using a single-line system vs. a multi-line system.
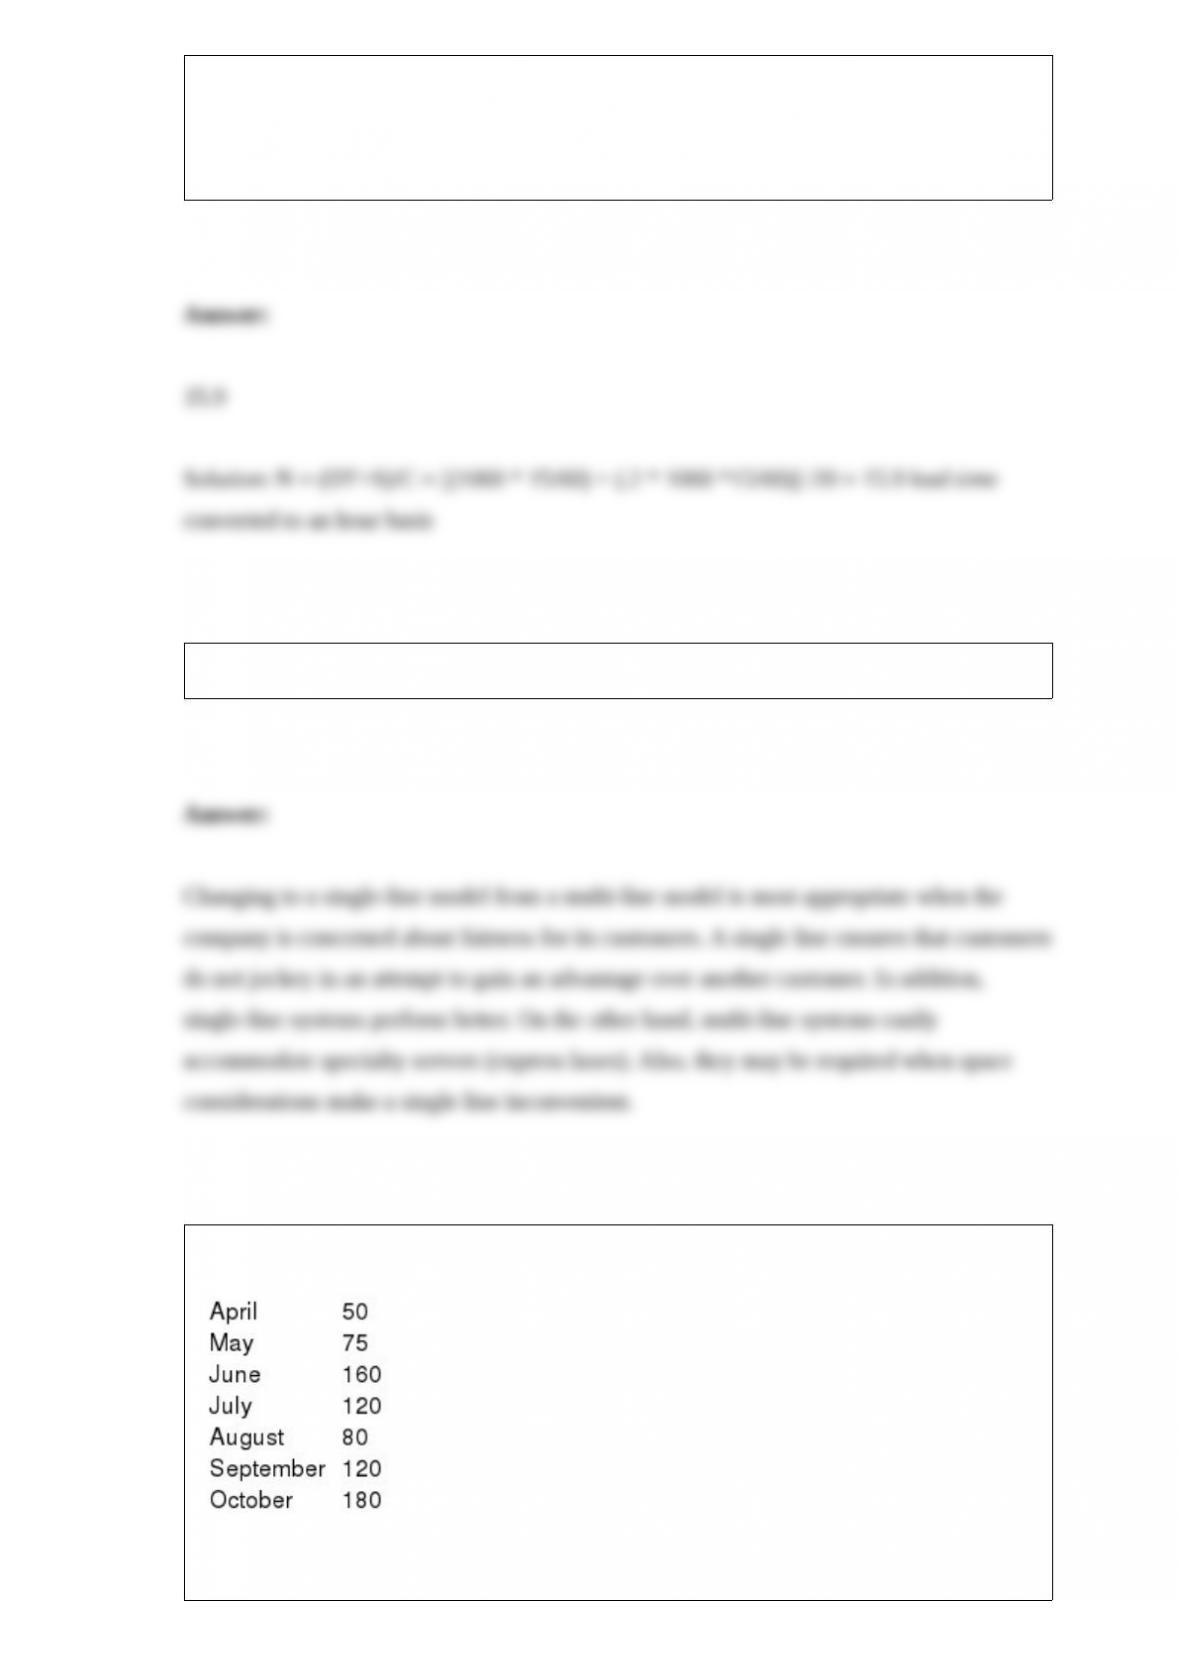
John’s Office Supply Company has the following order history over the last 8 months.
November 90

Compute a 3-month weighted moving average forecast for December, with a weight of
65% for the most recent month, 25% for the month preceding the most recent month,
and 10% for the month preceding that one.
Why is today’s Operations Management environment described as very different from
what it was just a few years ago?
Consider the following partial MPS record. Beginning inventory is 70 units. The firm
uses a fixed order quantity of 100 units. Fill out the last two rows of the table.
What are the three ‘components’ of a supply chain?
Discuss how companies can benefit from both infinite and finite loading.
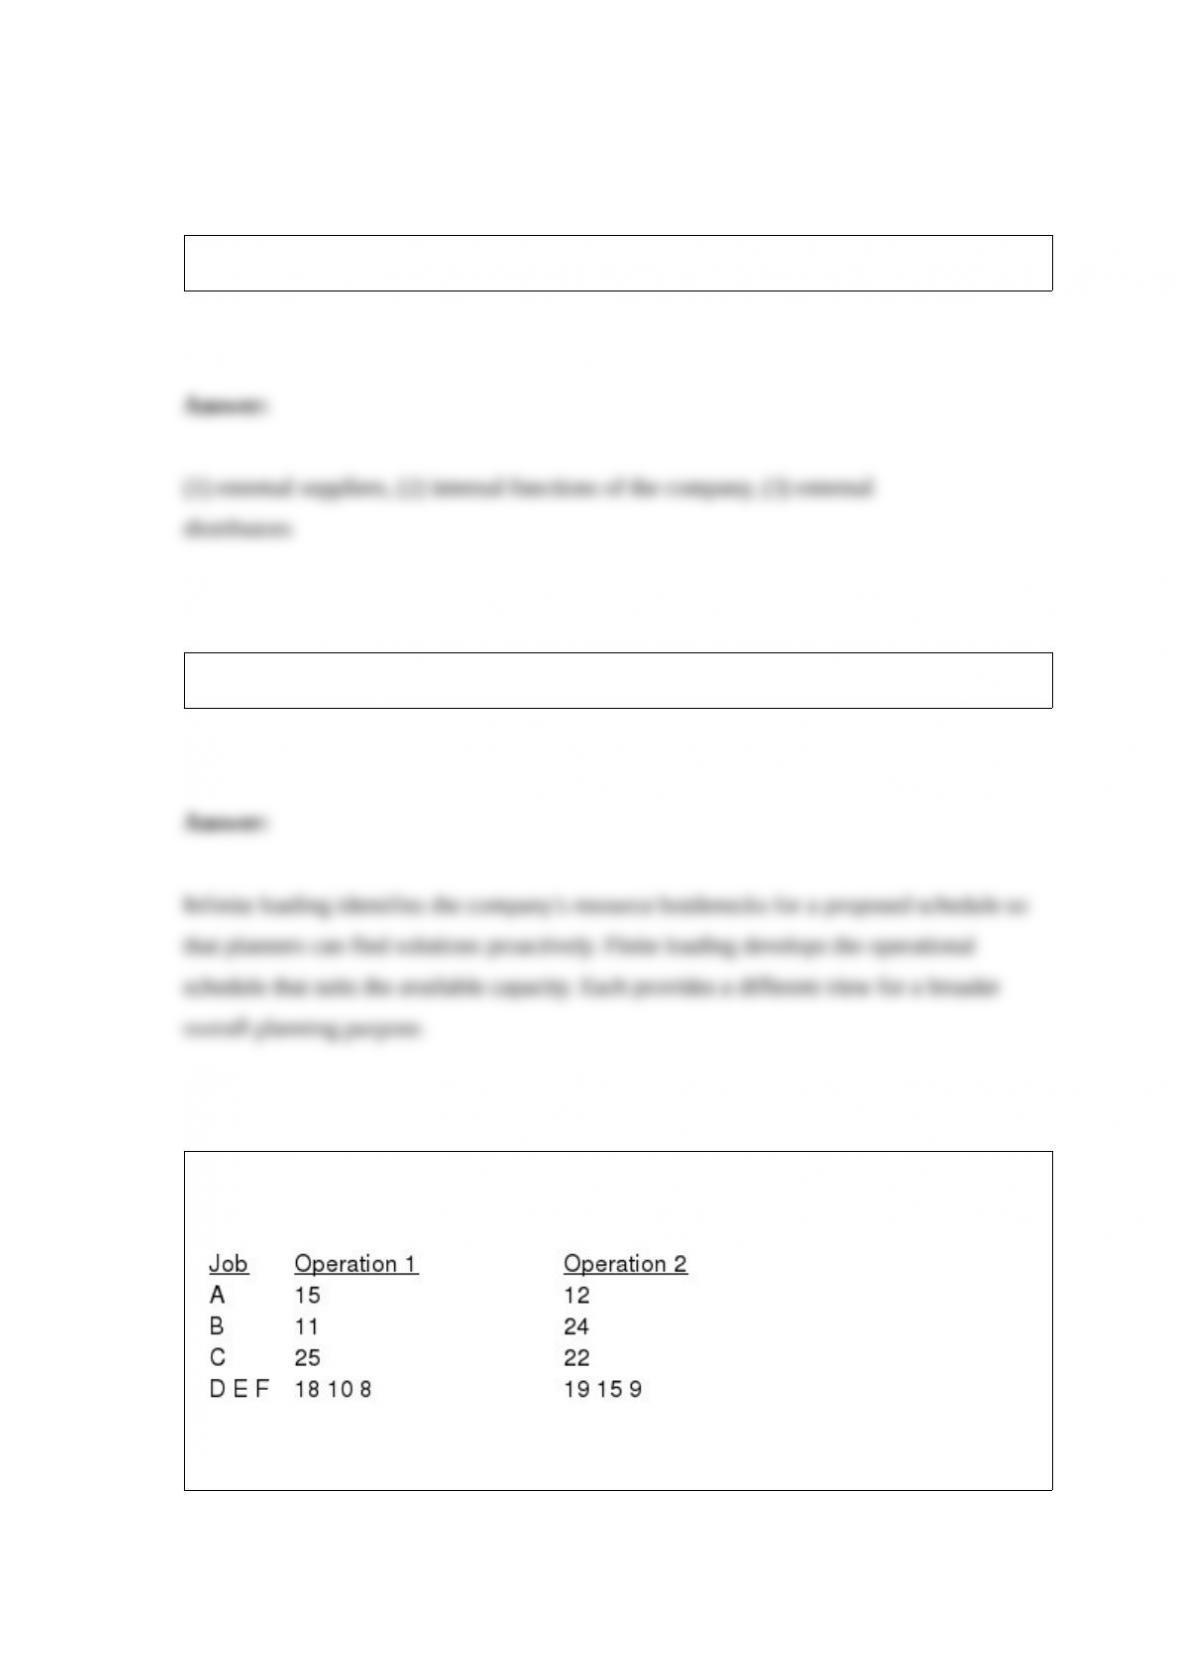
Six jobs are to be processed through a two-stage operation. The first operation involves
drill pressing, and the second involves lathing. Process times are as follows
Determine a sequence that will minimize the total completion time for these jobs.