
As shown in Exhibit 7-2, the rate of inflation for Year 5 is:
a. 5 percent
b. 10 percent.
c. 20 percent.
d. 25 percent.
Consider two people, Sandy Smith, who earns $25,000, and Gary Carver, who earns
$50,000. If the government has decided to tax everyone’s first $25,000 at 20 percent and
everyone’s second $25,000 at 40 percent, then:
a. Gary and Sandy both pay taxes of the same percentage of total income.
b. Gary and Sandy pay the same amount of taxes.
c. Gary pays twice the tax amount Sandy pays.
d. Gary pays three times the tax amount Sandy pays.
e. Sandy does not pay taxes.
Exhibit 17-2 Aggregate demand and aggregate supply curves
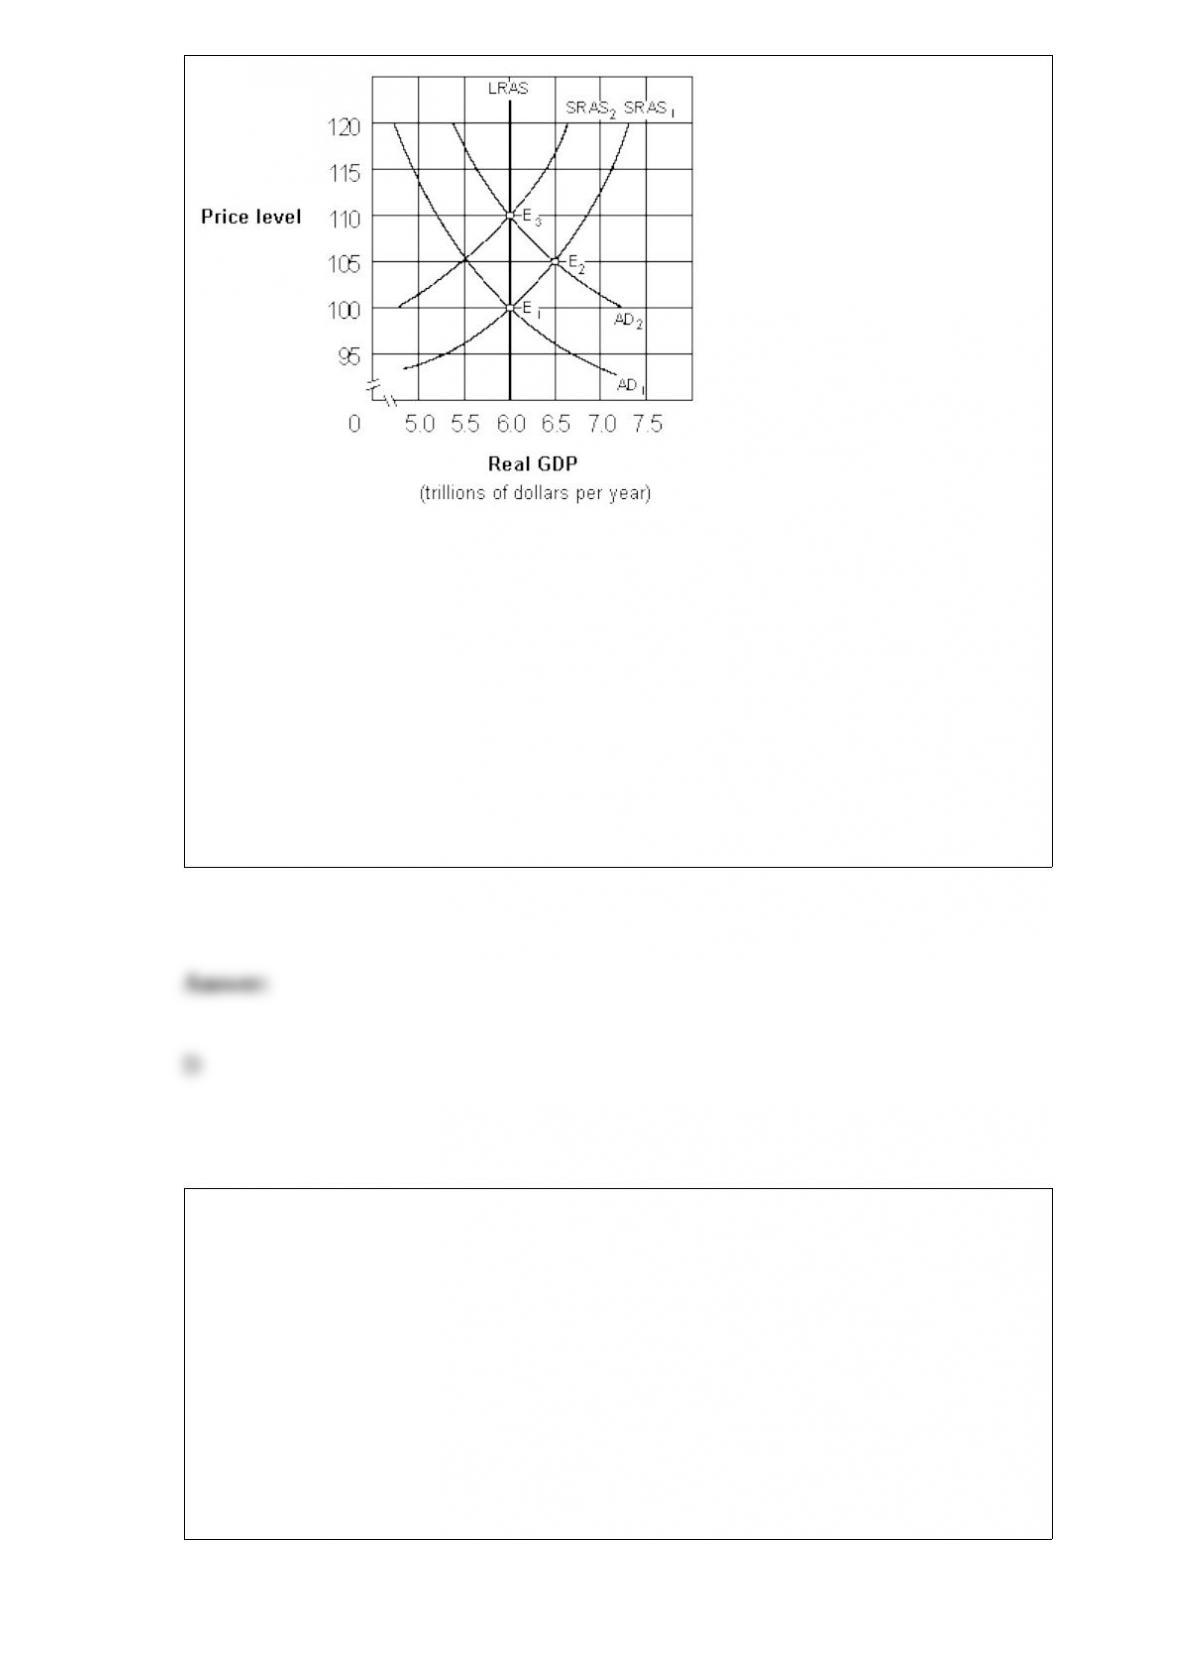
As shown in Exhibit 17-2, if
people behave according to adaptive expectations theory, an increase in the aggregate
demand curve from AD1 to AD2 will cause the economy to move:
a. directly from E1 to E3 and then remain at E3.
b. directly from E1 to E2 and then remain at E2.
c. from E1 to E2 initially and then eventually move back to E1.
d. from E1 to E2 initially and then eventually move to E3.
Classical economists believe that an increase in the money supply will lead to:
a. only c and d.
b. all of the following.
c. an increase in the price level.
d. an increase in nominal GDP.
e. an increase in real GDP.

Which of the following would cause a rightward shift in the aggregate supply curve?
a. Larger-than-expected wage increases.
b. Lower oil prices.
c. Increased investment spending.
d. Greater government regulation.
Using C to represent consumption, I to represent investment, G to represent government
spending, S to represent saving, X to represent exports, and M to represent imports,
aggregate expenditures can be represented by:
a. C + I + G + (X + M).
b. (C – S) + G + (X – M).
c. C + I + G + (X – M).
d. C + I + G + (X – M) – S.
In terms of production possibilities curves, the benefits of trade between two nations are
that each nation moves to a higher:
a. standard of living.
b. consumption possibilities combination.
c. both a and b.
d. neither a nor b.
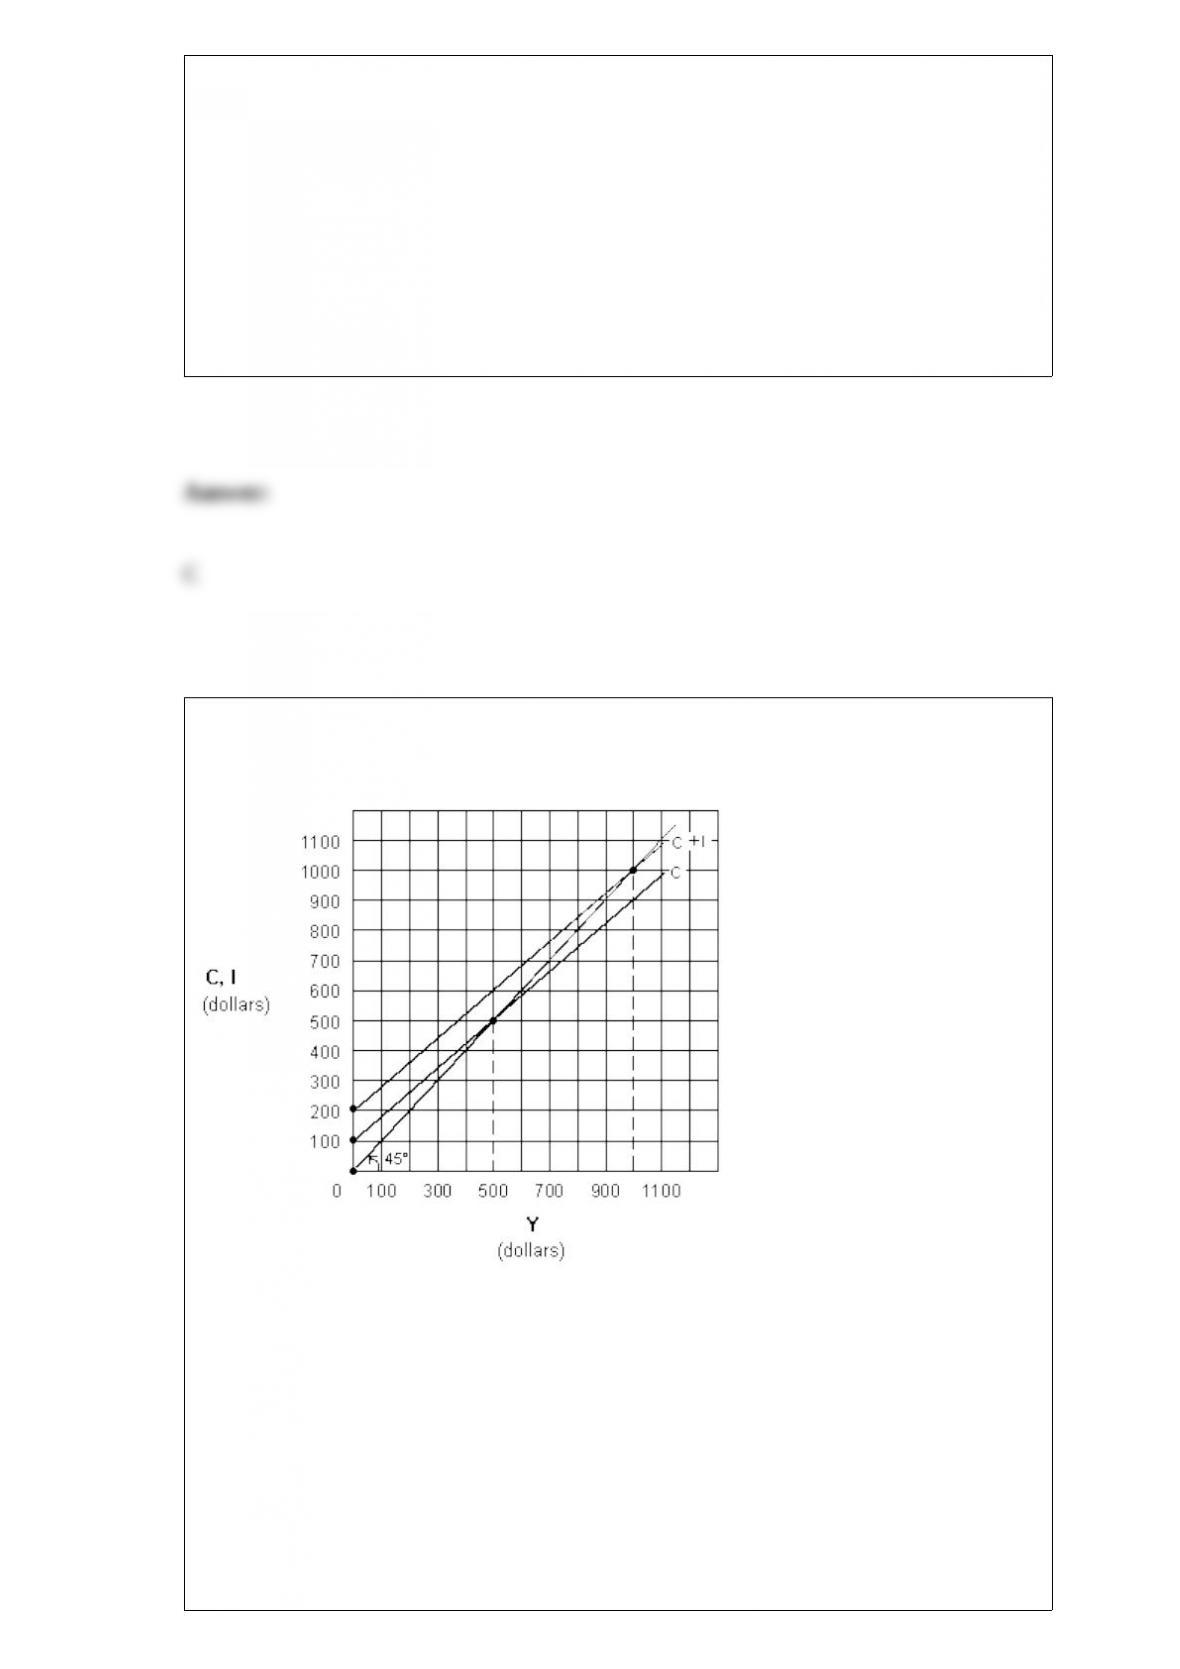
Exhibit 9-7 Keynesian aggregate-expenditures model
In Exhibit 9-7, the level of
investment is:
a. $50.
b. $100.
c. $150.
d. $200.
e. $0.

Which of the following people would be classified as fictionally unemployed?
a. Computer programmers who lost their jobs because of a recession.
b. Construction workers who are on temporary layoff.
c. Elementary school teachers who do not have summer jobs.
d. Textile workers who lost their jobs because of new foreign competition.
A tax where wealthy people pay a larger percentage of their income than poor people is
known as a(n):
a. excise tax.
b. flat tax.
c. proportional tax.
d. progressive tax.
e. regressive tax.

The primary cause of frictional unemployment is:
a. discouraged workers who give up looking for work.
b. fluctuations in aggregate demand.
c. the lack of training and marketable qualifications in job seekers.
d. inaccurate information about job opportunities.
Assuming prices and wages are fully flexible, the aggregate supply curve will be:
a. upward sloping, but not vertical.
b. vertical.
c. horizontal.
d. downward sloping.
Opportunity cost is the:
a. cost incurred when one fails to take advantage of an opportunity.
b. price paid for goods and services.
c. cost of the best option forgone as a result of choosing an alternative option.

d. undesirable aspects of an option.
Reductions in available resources will cause the production possibilities curve to:
a. expand.
b. disappear.
c. become vertical.
d. shift inward.
An increase in the wealth of households, other things remaining the same, can result in
____ the consumption function.
a. no effect on
b. an upward shift in
c. a movement to the left along
d. a downward shift of

The salary of the president of the United States in 2000 was $400,000. In 1940, the
president’s salary was $75,000. If the Consumer Price Index was 8.1 in 1940 and 100 in
2000, the 1940 presidential salary measured in terms of the purchasing power of the
dollar in 2000 would be:
a. less than $75,000.
b. less than $400,000.
c. approximately $668,850.
d. approximately $926,000.
Which of the following countries had the highest level of government expenditures as a
share of GDP?
a. Sweden.
b. Japan.
c. United States.
d. Italy.
Demand-pull inflation is due to:
a. minimum wage laws.

b. labor cost increases.
c. excess total spending.
d. tax increase.
“An increase in the federal minimum wage causes an increase in unemployment among
teenagers” is a:
a. statement of positive economics.
b. statement of normative economics.
c. testable value judgment.
d. fallacy of composition.