
When the Fed increases the money supply, interest rates:
a. rise.
b. fall.
c. are unaffected.
d. rise and then fall.
e. fall and then rise.
In the context of the production possibilities curve, opportunity cost is measured in:
a. dollars paid for the goods.
b. the quantity of other goods given up.
c. the value of the resources used.
d. changing technology.
e. units of satisfaction.
Most monetarists favor:
a. frequent changes in the growth rate of the money supply to avoid inflation.
b. placing the Federal Reserve under the Treasury.

c. a steady, gradual shrinkage of the money supply.
d. a constant increase in the money supply year after year equal to the potential annual
growth rate in real GDP.
Which of the following is not an example of a country’s infrastructure?
a. Transportation system.
b. Communications system.
c. Political system.
d. Educational system.
e. Energy system.
Assume that crackers and soup are complementary goods. The effect on the soup
market of an increase in the price of crackers (other things being equal) would best be
described as a(n):
a. decrease in the quantity of soup demanded.
b. decrease in the demand for soup.
c. increase in the quantity of soup demanded.
d. increase in the demand for soup.
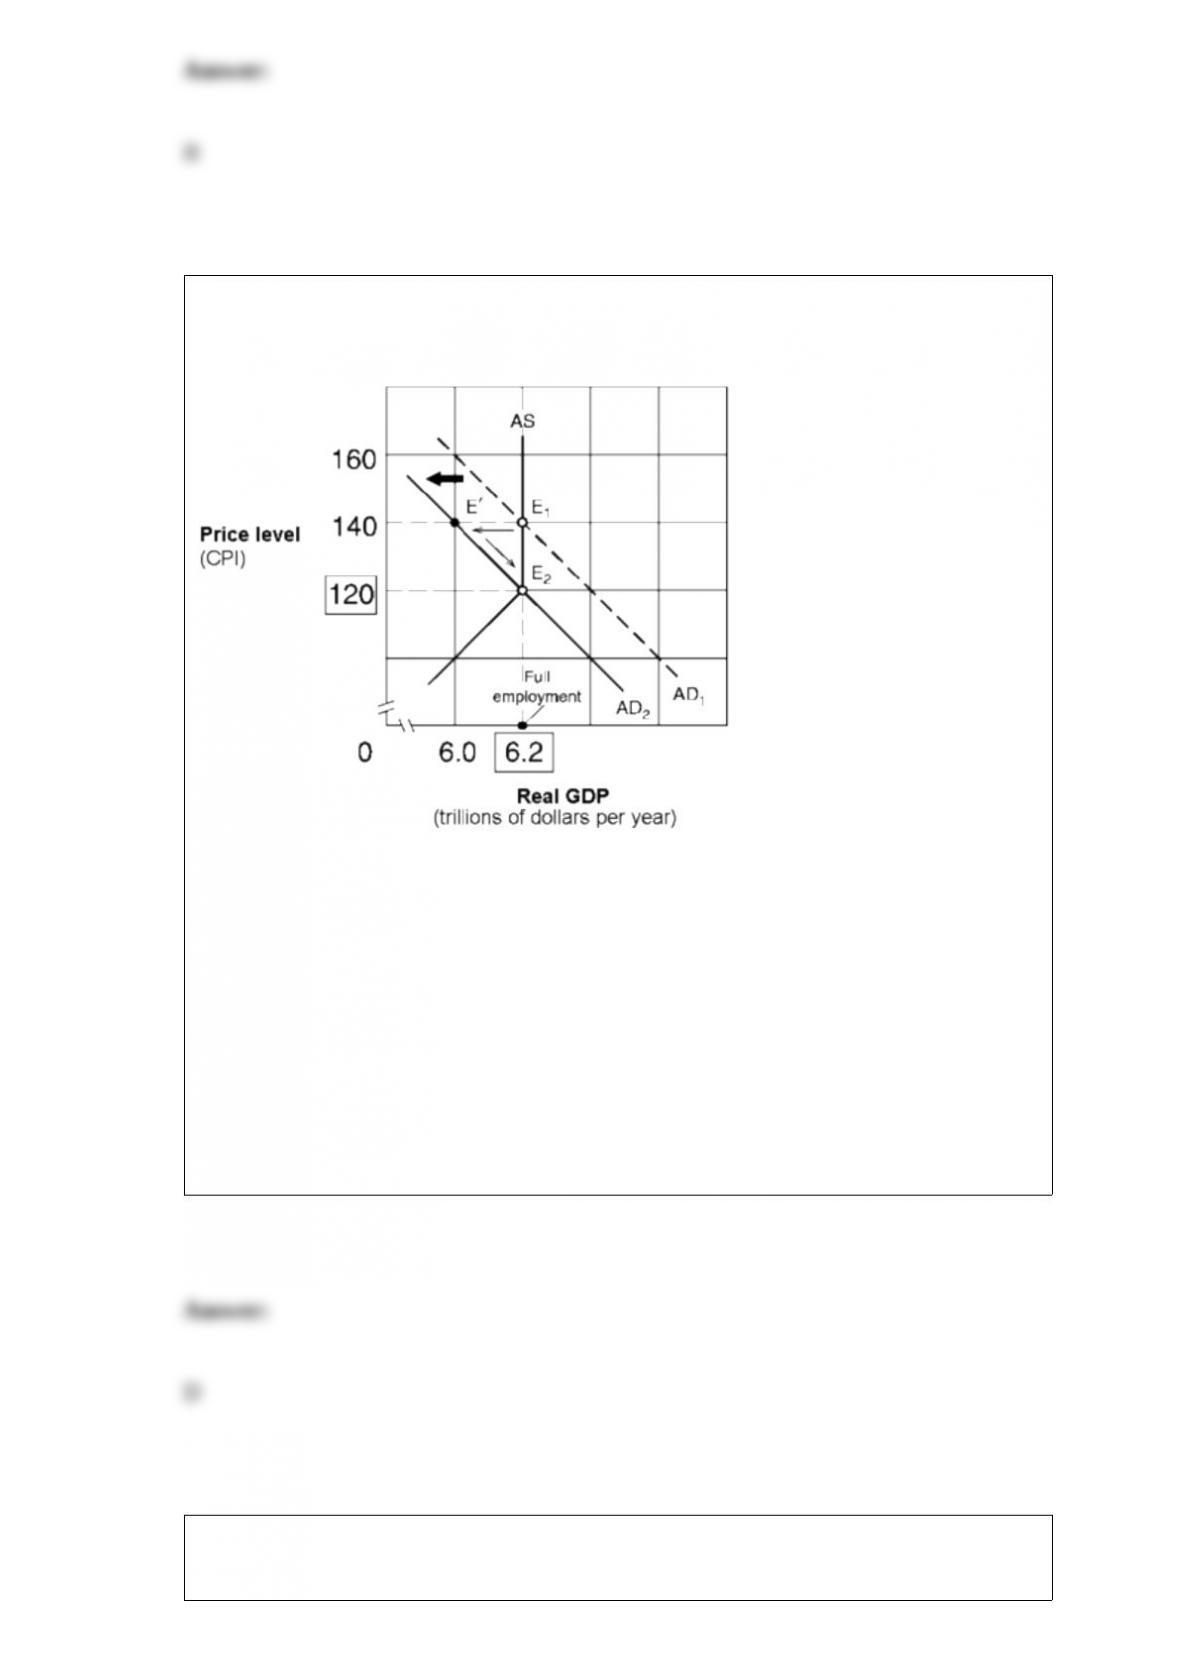
Exhibit 11-5 Aggregate demand and supply model
Suppose the economy in
Exhibit 11-5 is in equilibrium at point E1 and the marginal propensity to consume
(MPC) is 0.75. Following Keynesian economics, the federal government can move the
economy to point E2 and reduce inflation by:
a. increasing government spending by $50 billion.
b. decreasing government spending by $6 billion.
c. decreasing government spending by $100 billion.
d. decreasing government spending by $50 billion.
Which of the following statements is true?

a. An opportunity cost is what must be given up in order to get something else.
b. The three fundamental economic questions refer to What to produce? How to
produce? and When to produce?
c. The term “investment” refers to the purchase of stocks and bonds and other financial
securities.
d. The law of increasing opportunity cost implies that as production of one type of good
is expanded then fewer and fewer of other goods must be given up.
Tammy installed a set of wind chimes in her backyard. She enjoys listening to the
musical tones when the breeze hits them. Her neighbor Steven also enjoys the chimes,
but her other neighbor Sally hates the constant noise. Tammy’s wind chimes:
a. create a negative externality for Steven and a positive externality for Sally.
b. are not related to the issue of property rights since all parties are homeowners.
c. are an example of an efficient market since the benefits to one party are balanced by
costs to another party.
d. are a public good because all three parties can hear the wind chimes.
e. create a positive externality for Steven and a negative externality for Sally.
The subject of economics is primarily the study of:
a. the government decision-making process.

b. how to operate a business successfully.
c. decision-making because of the problem of scarcity.
d. how to make money in the stock market.
The equilibrium level of real GDP is $1,000, the target full-employment level of real
GDP is $1,500, and the marginal propensity to consume is 0.75. The target can be
reached if government spending is:
a. increased by $100 billion.
b. increased by $125 billion.
c. increased by $500 billion.
d. held constant.
A line that has a different slope at each point is a:
a. curve.
c. vertical line.
b. straight line. d. horizontal line.
The discount rate is the interest rate charged by:
a. major banks to their best customers.
b. banks for overnight loans to other banks.
c. the Fed on loans of reserves to banks.
d. banks for loans of less than 24 hours.
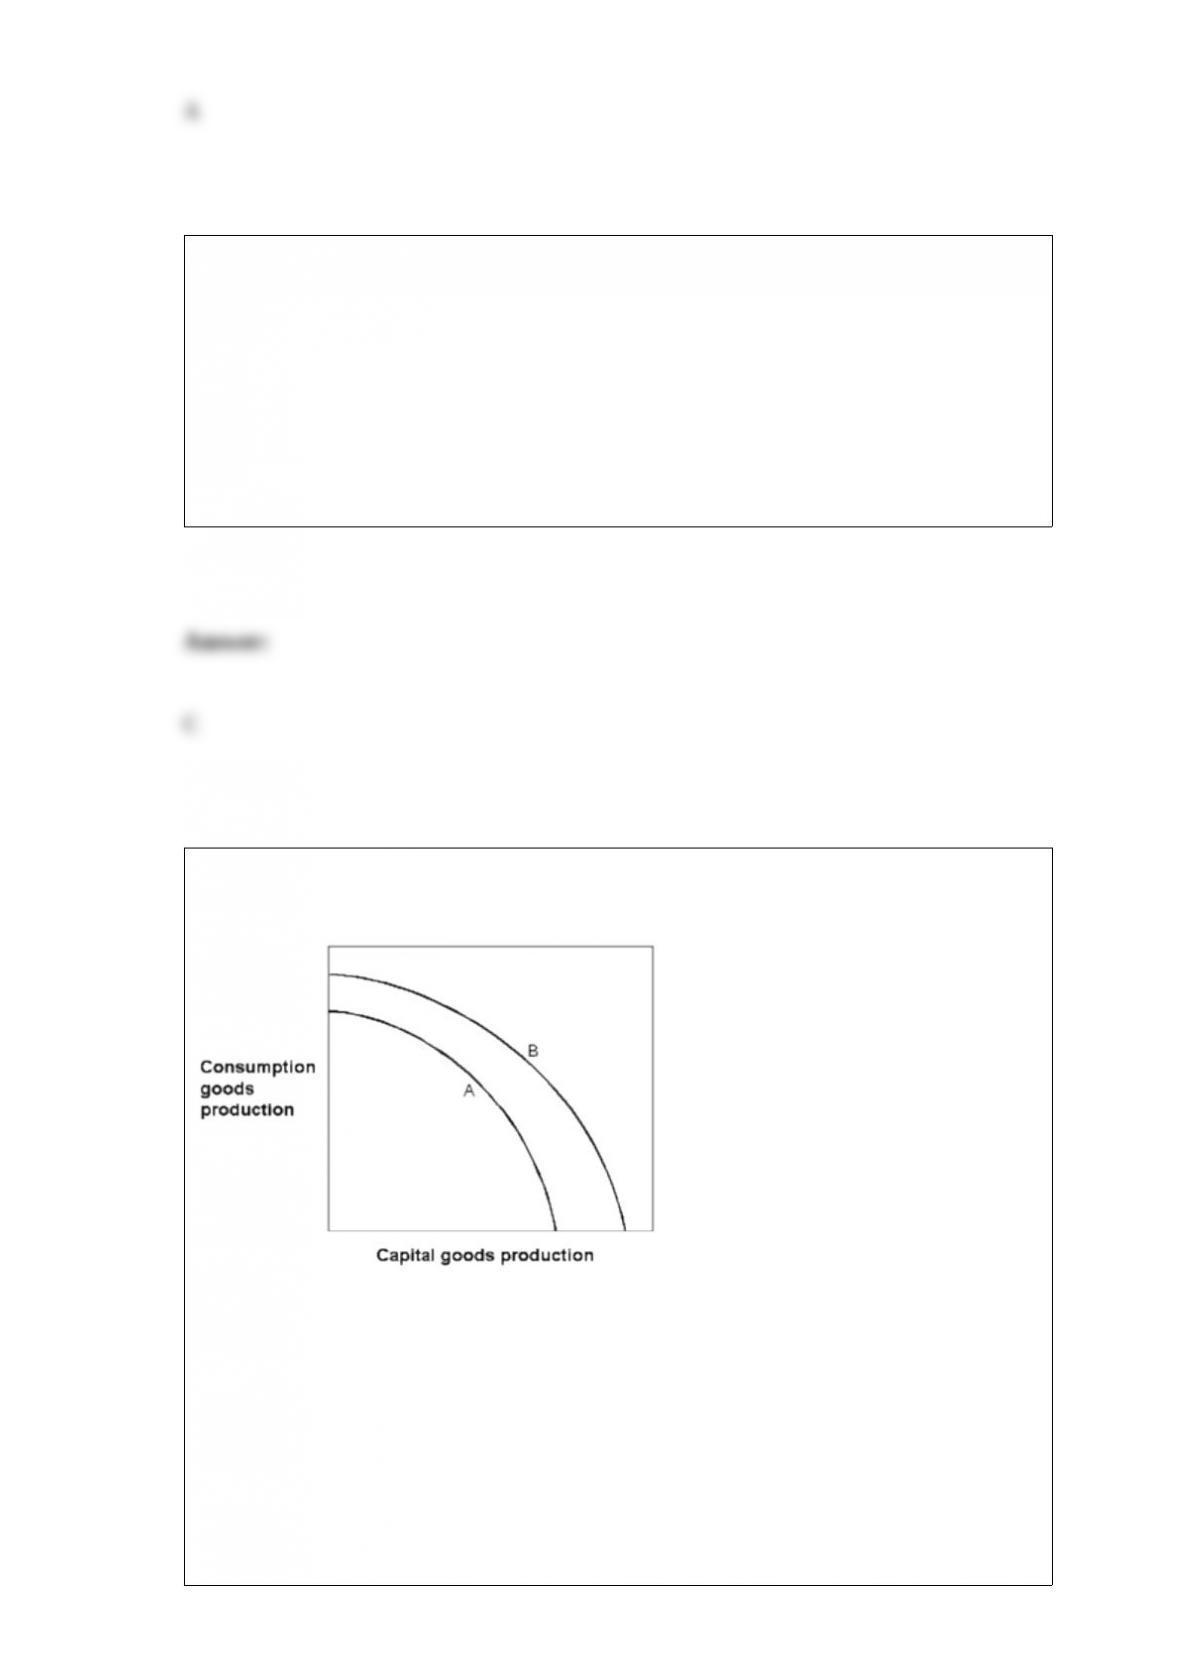
Exhibit 2-11 Production possibilities curves
In Exhibit 2-11, which of the following
could have caused the production possibilities curve of an economy to shift from the
one labeled A to the one labeled B?
a. A major natural disaster
b. An increase in consumption goods production this year
c. An advance in technology
d. An increase in unemployment
e. A decrease in consumption goods production this year
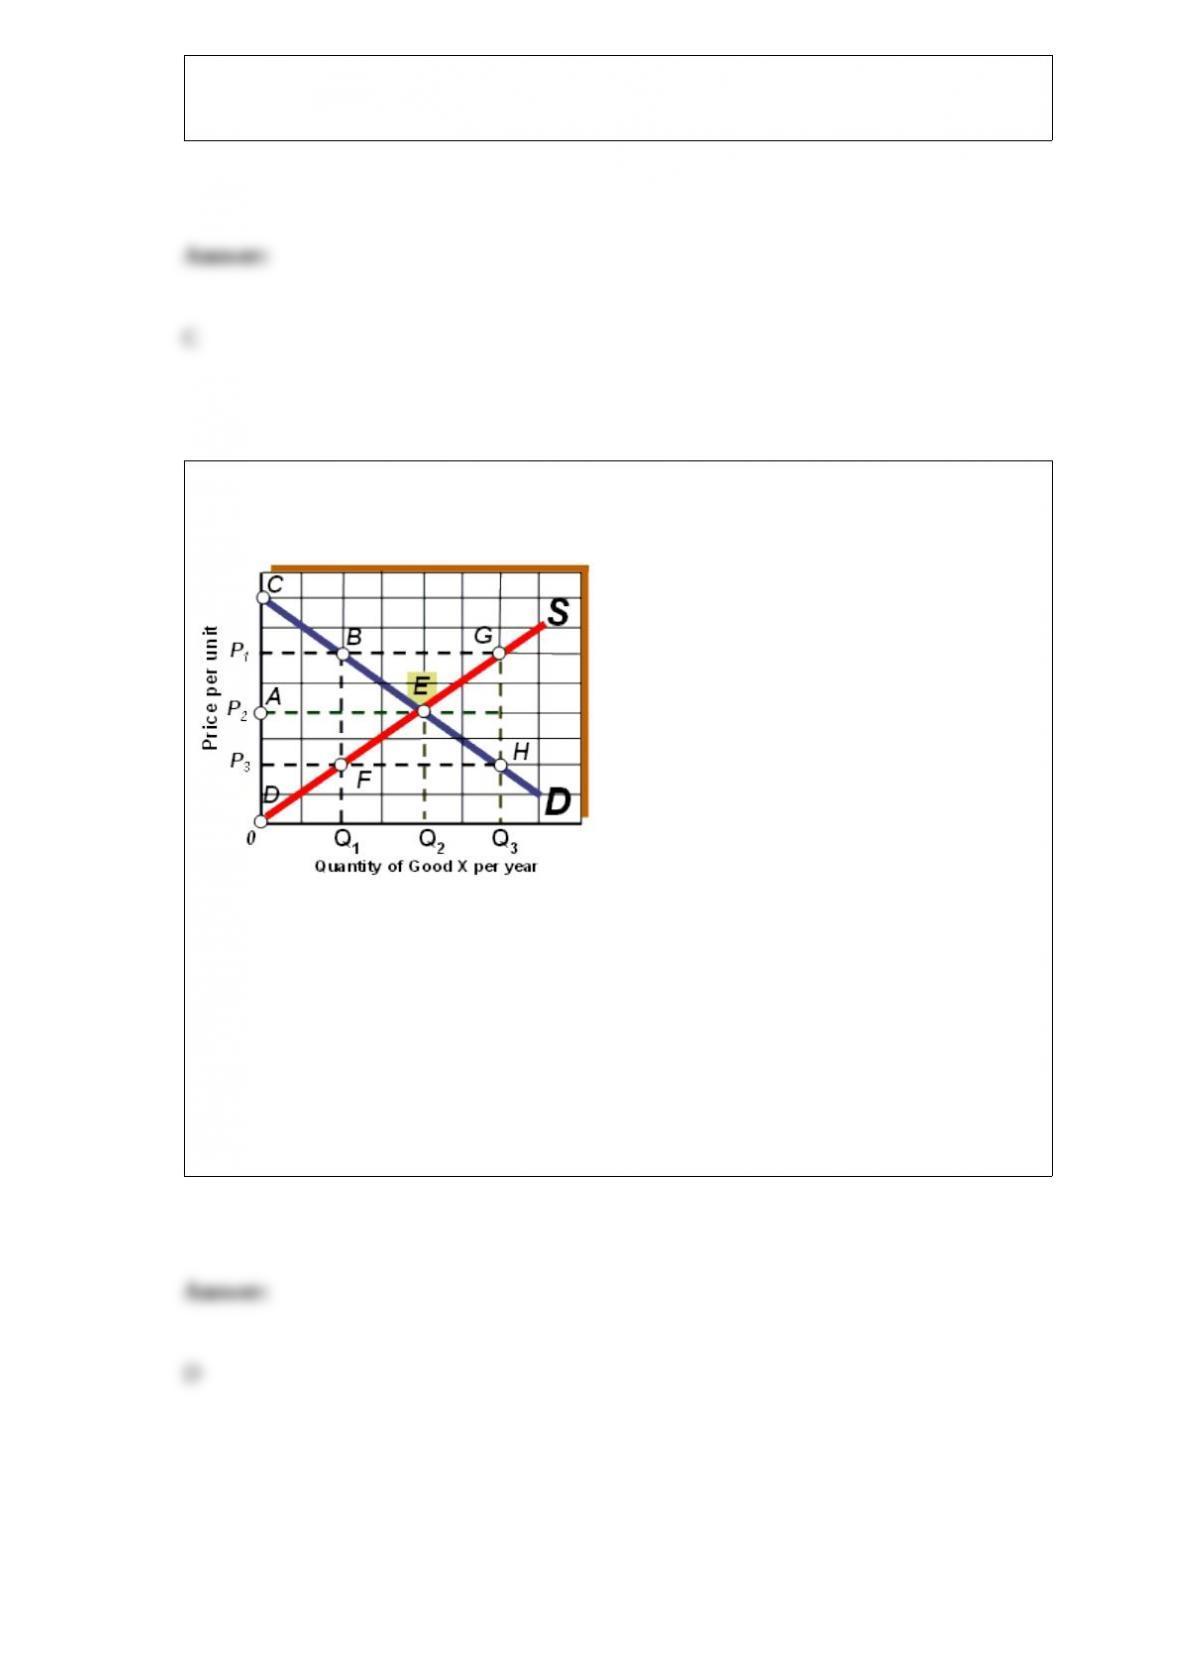
Exhibit 3A-2 Comparison of Market Efficiency and Deadweight Loss
As shown in Exhibit 3A-2, if the market price
falls from P1 to P2, then area ____ disappears.
a. ABEFD
b. BEG
c. EGH
d. BEF