
Currently, total private sector expenditures in the United States:
a. remained close to one third of GDP.
b. fell by half to 50 percent of GDP.
c. fell by half to 65 percent of GDP.
d. remained close to 60 percent of GDP.
The marginal propensity to consume measures the ratio of the:
a. average amount of our disposable income that we spend.
b. average amount of our savings that we spend.
c. change in consumer spending to a change in money holdings.
d. change in consumer spending to a change in interest rates.
e. change in consumer spending to a change in disposable income.
In the aggregate expenditures model, if an economy operates above equilibrium GDP,
there will be:
a. unplanned inventory depletion.
b. an increase in GDP.
c. a decrease in employment.

d. an increase in employment.
If the marginal propensity to consume (MPC) is 0.50, the value of the spending
multiplier is:
a. 5.
b. 1.
c. 2.
d. 5.
An increase in the demand for peanut butter, a normal good, can be caused by a(n):
a. decrease in consumer income.
b. increase in the price of jams, jellies, and preserves.
c. decrease in the price of bread.
d. drought in Georgia that destroyed 30 percent of the peanut crop.
e. decrease in the price of bologna.
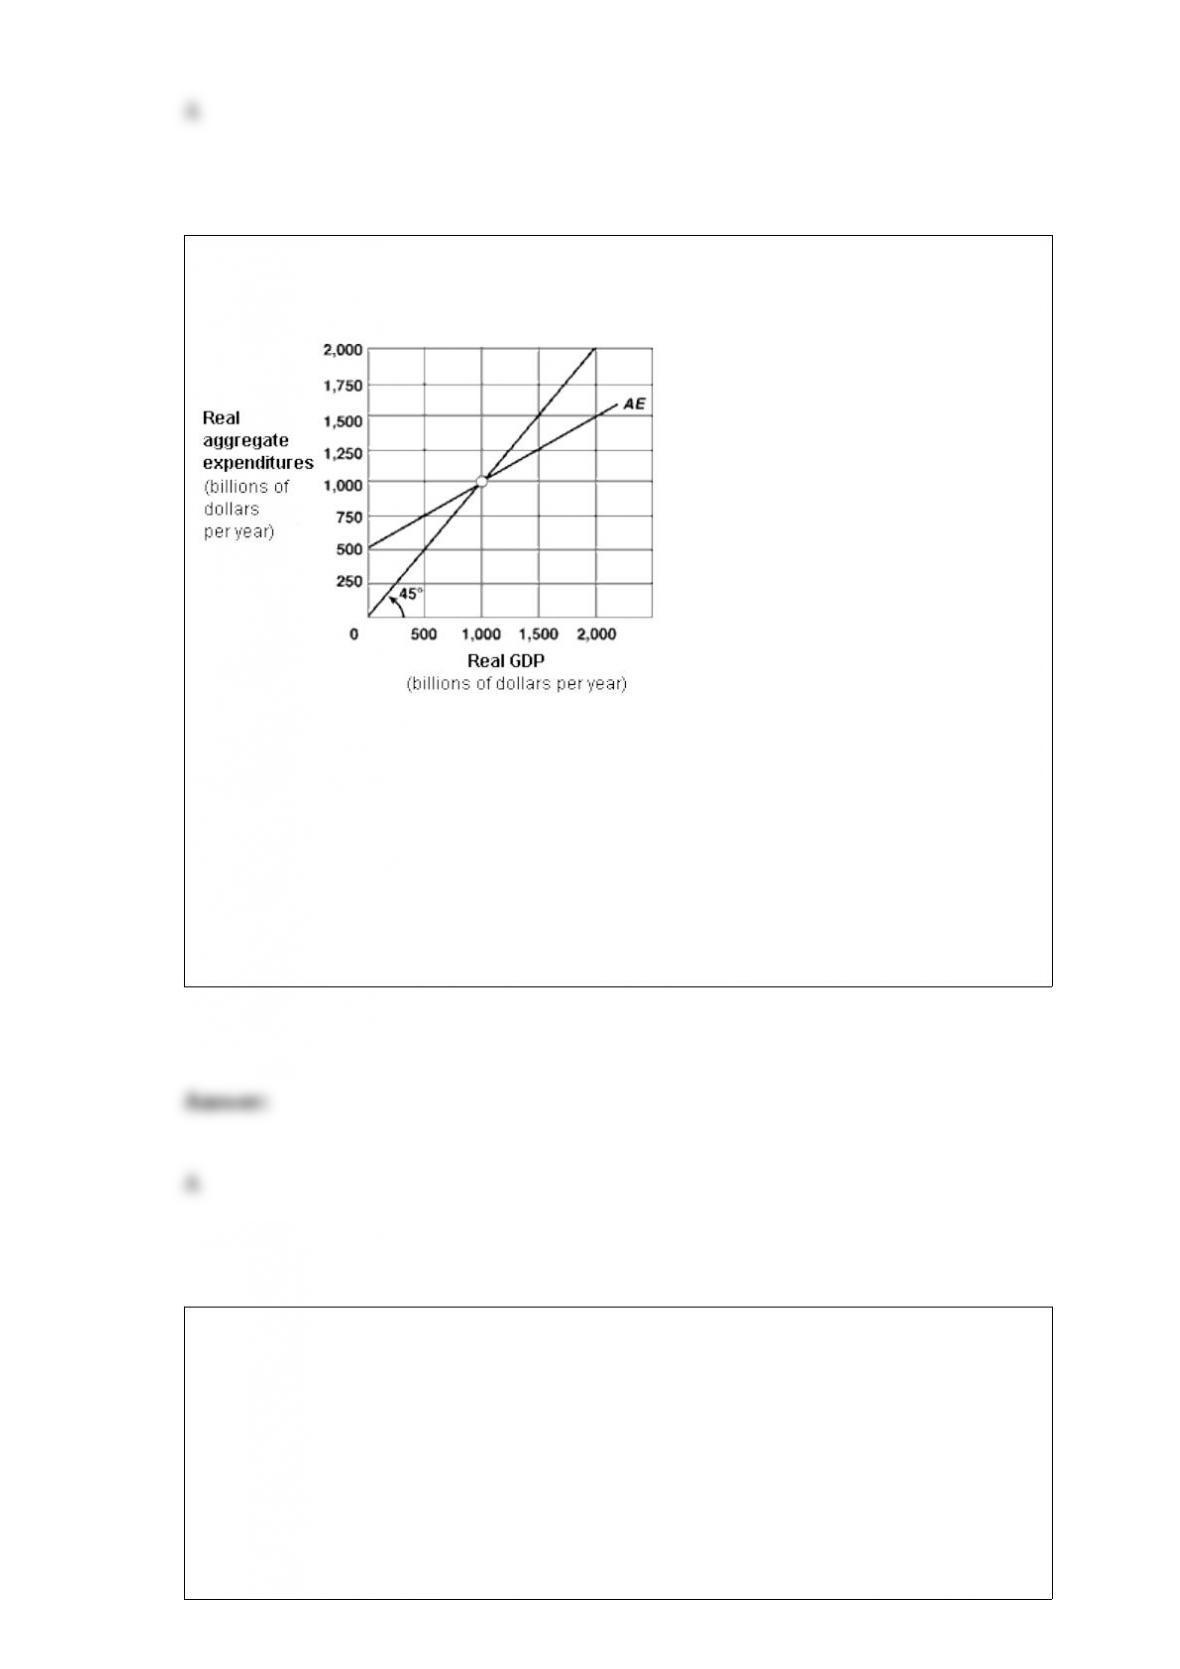
Exhibit 9-4 Keynesian aggregate expenditures model
When real GDP is $2,000 billion in
Exhibit 9-4, the economy experiences inventory:
a. accumulation of $500 billion.
b. accumulation of $700 billion.
c. depletion of $700 billion.
d. depletion of $500 billion.
Assume the marginal propensity to consume (MPC) is 0.80 and the government
increases taxes by $100 billion. The aggregate demand curve will shift to the:
a. left by $80 billion.
b. right by $200 billion.
c. right by $400 billion.

d. left by $400 billion.
If two goods are substitutes in consumption, a(n):
a. decrease in the price of one product will cause an increase in the demand for the
other product.
b. decrease in the price of one product will cause a decrease in the demand for the other
product.
c. increase in the price of one product will cause an increase in the supply of the other
product.
d. increase in the price of one product will cause a decrease in the supply of the other
product.
e. increase in the price of one product will cause a decrease in the demand for the other
product.
Which of the following characterizes the IACs?
a. High per capita GDP growth and high population growth.
b. Low per capita GDP growth and low population growth.
c. Low per capital GDP growth and high savings rate.
d. Low human capital investment.

Monetarists believe:
a. the cause-and-effect relationship hypothesized by the Keynesians understates the
impact of stimulative monetary policy.
b. the cause-and-effect relationship hypothesized by the Keynesians is an accurate
description of how monetary policy works.
c. since the economy is operating at full employment, any stimulative monetary policy
will cause the inflation rate to rise.
d. the cause-and-effect relationship hypothesized by the Keynesians is backwards, and
decreases in the money supply actually stimulate economic activity.
e. the cause-and-effect relationship hypothesized by Keynesians will not work because
investment does not respond to changes in interest rates.
Just before class, Jim tells Stuart, “Stuart, you shouldn’t skip class today because you
have paid tuition to enroll in the class.” Stuart ignores Jim’s advice, and instead makes
the decision of whether to attend based on the importance to his grade that he feels he’d
be missing that day in class relative to his value of the extra time he could have to finish
the video game he is playing. To an economist, Stuart is:
a. using marginal analysis.
b. ignoring the total value of attending class.
c. ignoring the concept of opportunity cost.
d. irresponsible.

The relationship between aggregate expenditures and disposable income is shown by
the:
a. aggregate expenditures curve.
b. consumption function.
c. investment curve.
d. saving-disposable personal income curve.
The curve that shows the relationship between the price of a good and the quantity that
consumers are willing to purchase at each price is the
a. supply curve.
b. demand curve.
c. production possibilities curve.
d. consumption curve.

Sam is a musician who is out of work because electronic equipment replaced live
musicians. This is an example of:
a. frictional unemployment.
b. cyclical unemployment.
c. structural unemployment.
d. involuntary unemployment.
The aggregate supply curve reflects the relationship between the price:
a. of a particular good and the quantity supplied by all firms producing that good.
b. of a particular good and the quantity supplied by the aggregate economy.
c. level and the quantity supplied of all goods in the economy.
d. level and the quantity of all goods purchased in the economy.
Exhibit 11-7 Aggregate demand and supply model

Suppose the economy in Exhibit 11-7 is
in equilibrium at point E1 and the marginal propensity to consumer (MPC) is 0.75.
Following Keynesian economics, to lower the price level from 170 to 150, the
government should reduce its spending by:
a. $20 billion.
b. $100 billion.
c. $133 billion.
d. $400 billion.
Since classical economists believe that both V and Q are constants for an economy in
short-run equilibrium, the equation of exchange becomes a theory in which:
a. the quantity of money explains prices.
b. the quantity of money explains velocity.
c. the quantity of money explains real GDP.
d. changes in M cause changes in V.
e. prices are never flexible

Exhibit 4-9 Data on supply and demand Price Quantity
DemandedQuantity
Supplied
$2.00 100 300
1.50 150 250
1.00 200 200
0.50 250 150In Exhibit 4-9, if a price ceiling is set at $1.50 the market result after
adjustment is:
a. a shortage of 150 units.
b. a surplus of 100 units.
c. shortage of 100 units.
d. equilibrium at 200 units.
If we observe a decrease in the price of a good and a decrease in the amount of the good
bought and sold, this could be explained by a(an):
a. increase in the supply of the good.
b. increase in the demand for the good.
c. decrease in the demand for the good.
d. decrease in the supply of the good.

John Maynard Keynes listed three types of motives for people holding
money-transactions, precautionary, and speculative.
If the marginal propensity to consume is 0.80, the value of the spending multiplier will
be 4.
The size of the spending multiplier depends on the marginal propensity to consume
(MPC).

A country cannot develop without a large natural resource base.
Borrowing from foreign banks by U.S. firms represents a capital inflow.
The entire national debt is owed to U.S. citizens.
Following Keynesian economics, and assuming a marginal propensity to consume
(MPC) of 0.75, an increase in federal government spending of $100 billion at below full
employment would be expected to shift the aggregate demand curve by $300 billion to
the right.

In the United States, the unemployment rate for blacks is roughly the same as the
unemployment rate for whites.
What is an economic theory or model? What constitutes a “good” economic theory or
model?
Increased government borrowing stimulates private borrowing because of its effect on
interest rates.