Unlock document.
This document is partially blurred.
Unlock all pages and 1 million more documents.
Get Access
16) What is the cumulative probability of selling 4 tires?
Tires Sold
Probability
0
.1
1
.2
2
.15
3
.3
4
.25
A) 1
B) .5
C) 10
D) .2
E) .25
17) The number of tires sold at a car garage varies randomly between 0 and 4 each hour, with equally
probability for each possible outcome. What set of random numbers (on the 01-100 scale) would tire sales
of 2 be assigned?
A) 01 through 20
B) 21 through 40
C) 41 through 60
D) 51 through 75
E) 26 through 50
18) There are four possible outcomes for a Monte Carlo simulation variable (A, B, C, and D). The random
numbers 02, 22, 53, and 74 correspond to the variables ________, respectively, if each possible outcome
has an equivalent chance of occurring.
A) A A C C
B) B B D D
C) A B C D
D) D C B A
E) A A C D
19) The ________ method is a simulation technique that uses random elements when chance exists in their
behavior.
20) A(n) ________ is the accumulation of individual probabilities of a distribution.
21) A(n) ________ is a series of digits that have been selected by a totally random process.
22) The numbers used to represent each possible value or outcome in a computer simulation are referred
to as ________.
23) What is the Monte Carlo method?
24) Identify, in order, the five steps required to implement the Monte Carlo simulation technique.
25) Explain how Monte Carlo simulation uses random numbers.
26) Provide a small example illustrating how random numbers are used in Monte Carlo simulation.
27) Explain what is meant by the statement: "simulation is not limited to using the standard probability
distributions."
28) Explain the difference between random numbers and random number intervals.
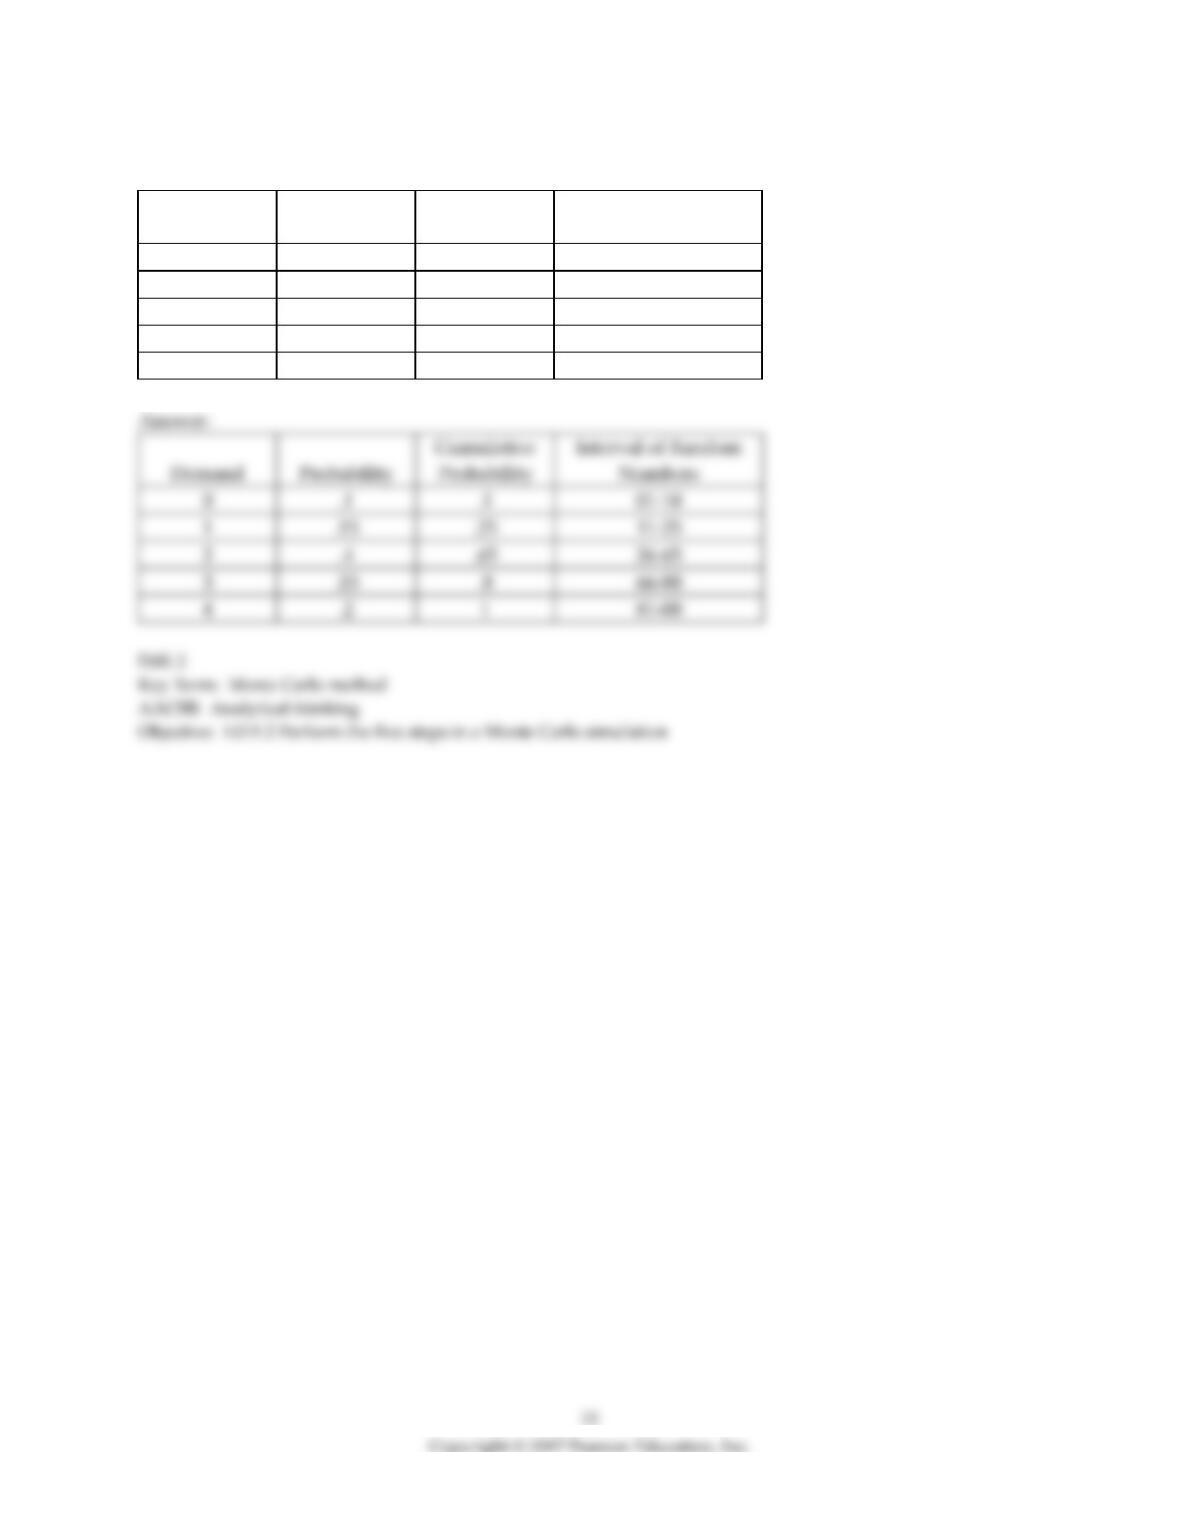
29) Complete the following table in preparation for a Monte Carlo simulation.
Demand
Probability
Cumulative
Probability
Interval of Random
Numbers
0
.1
1
.15
2
.4
3
.15
4
.2
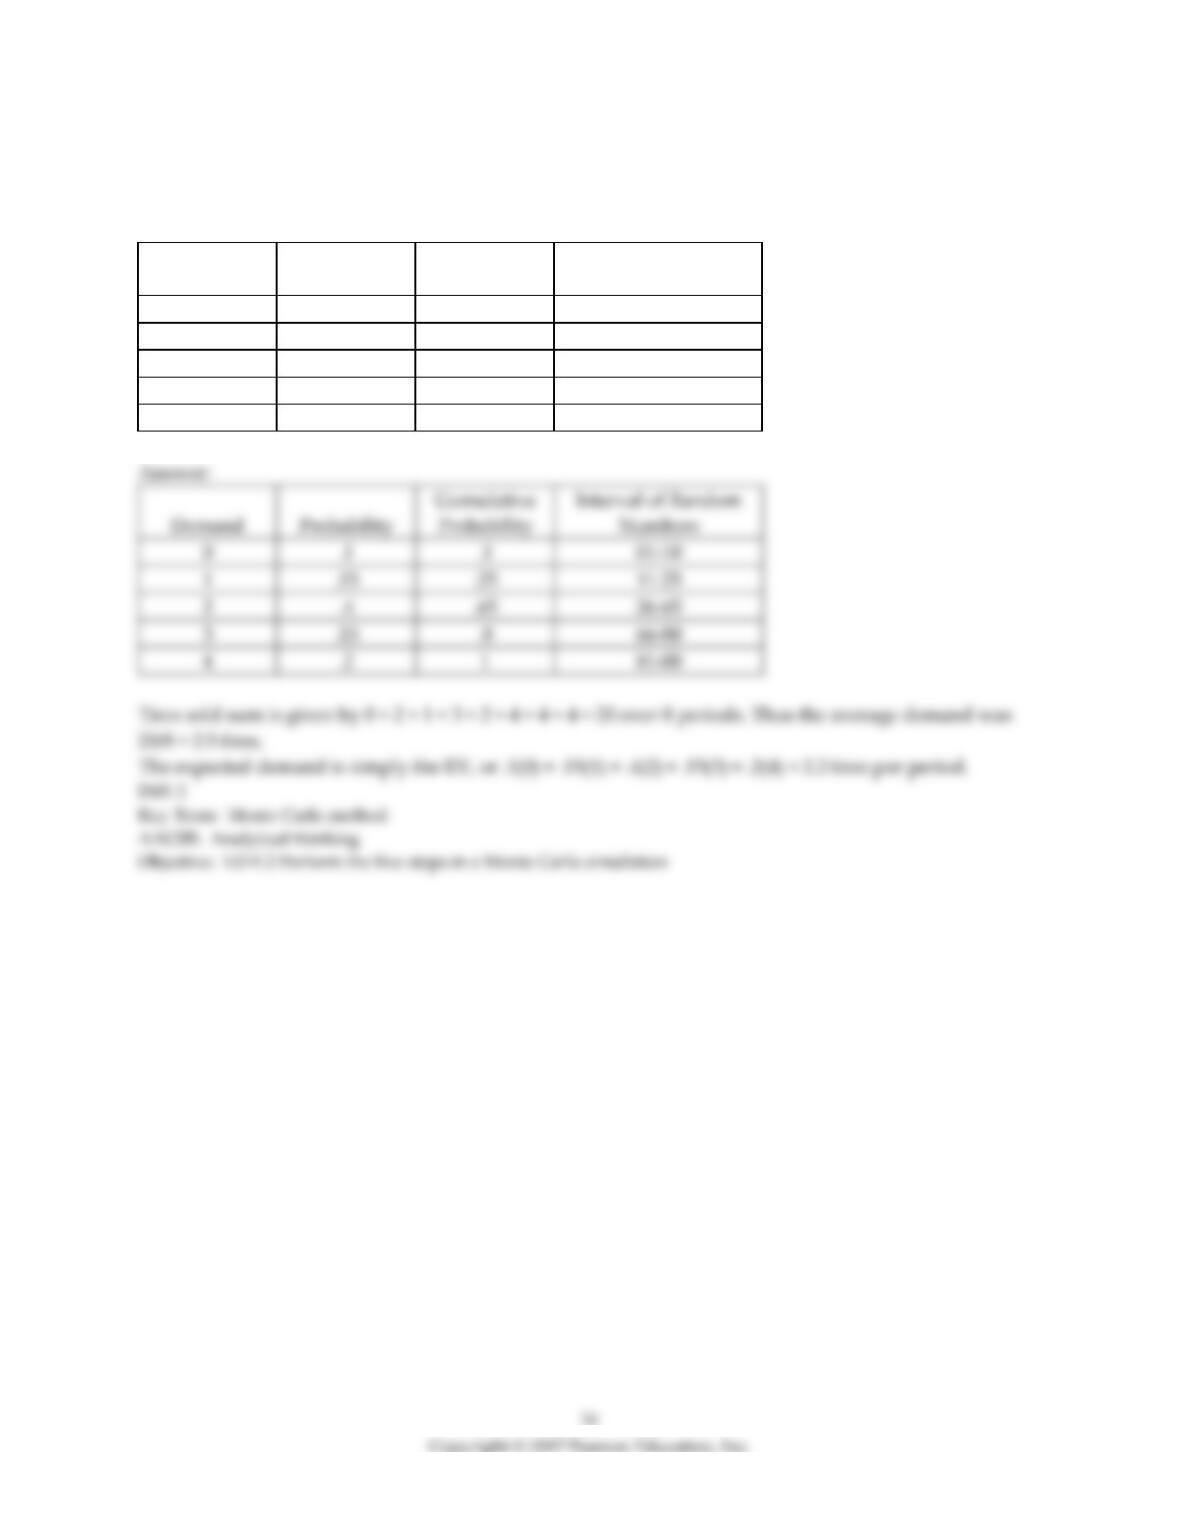
30) Suppose the following random numbers (1, 34, 22, 78, 56, 98, 00, 82) were selected during a Monte
Carlo simulation that was based on the chart below. What was the average demand per period for the
simulation? What is the expected demand?
Demand
Probability
Cumulative
Probability
Interval of Random
Numbers
0
.1
1
.15
2
.4
3
.15
4
.2
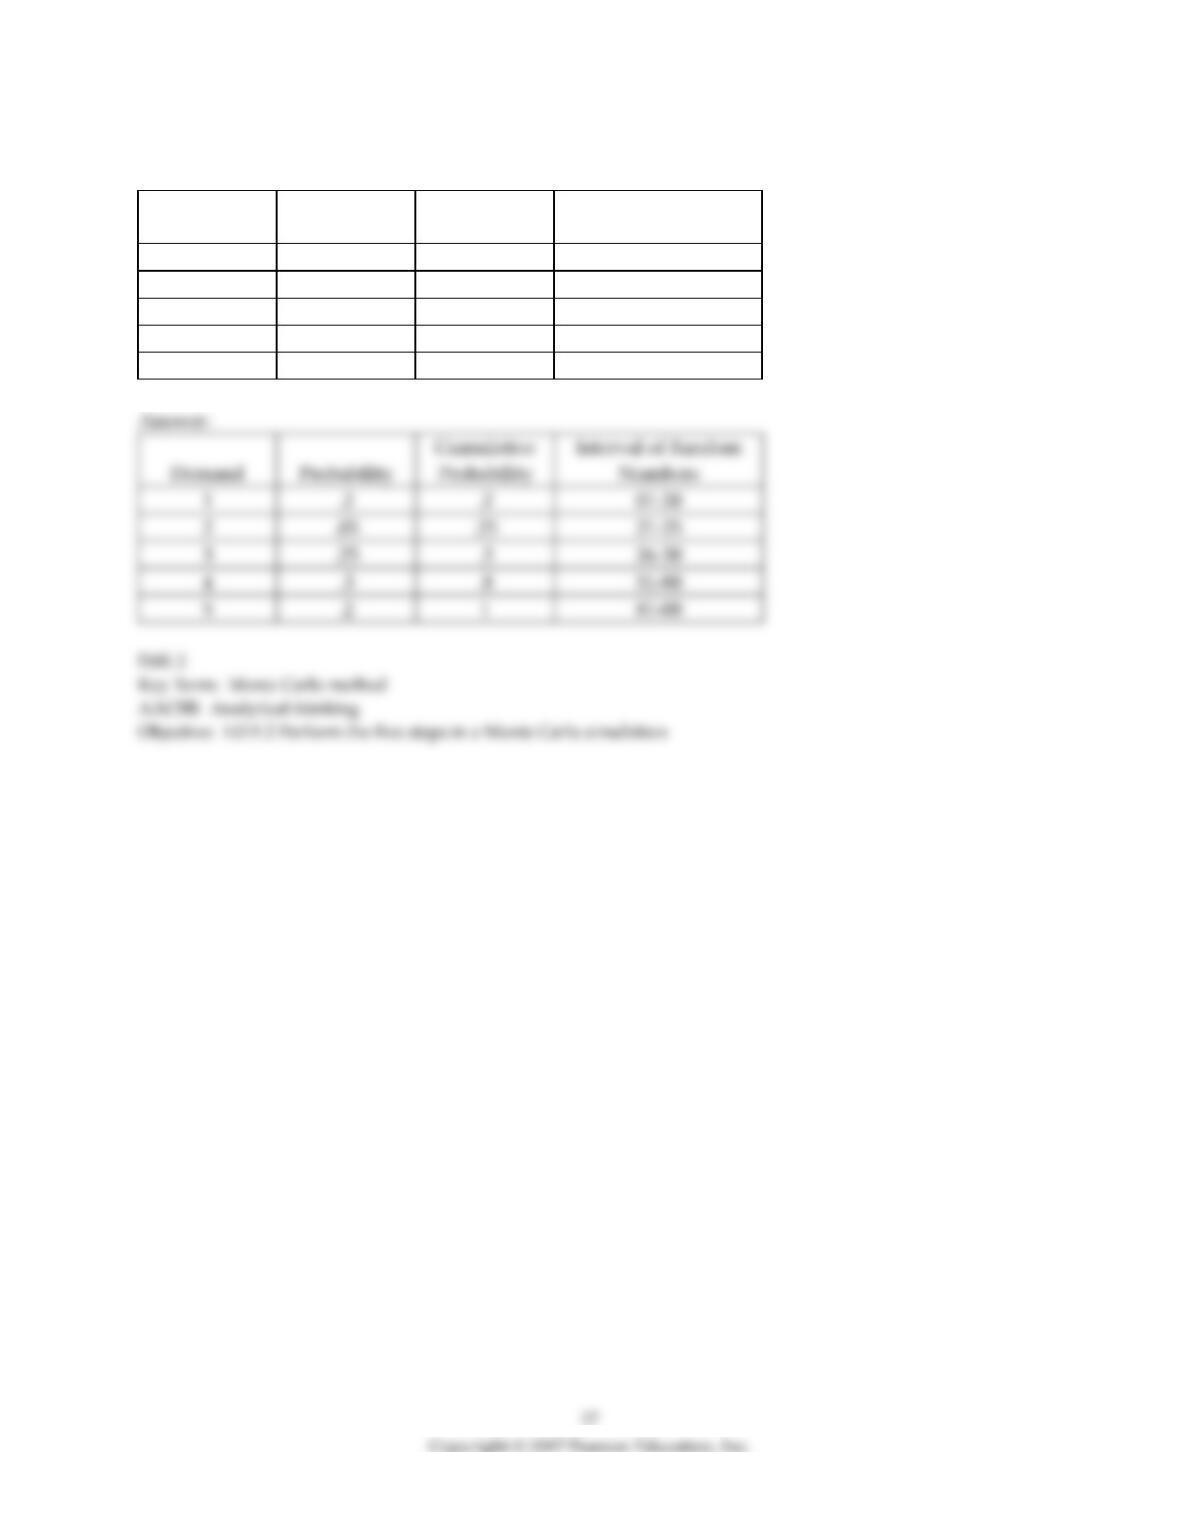
31) Complete the following table in preparation for a Monte Carlo simulation.
Demand
Probability
Cumulative
Probability
Interval of Random
Numbers
1
01-20
2
21-25
3
26-50
4
51-80
5
81-00
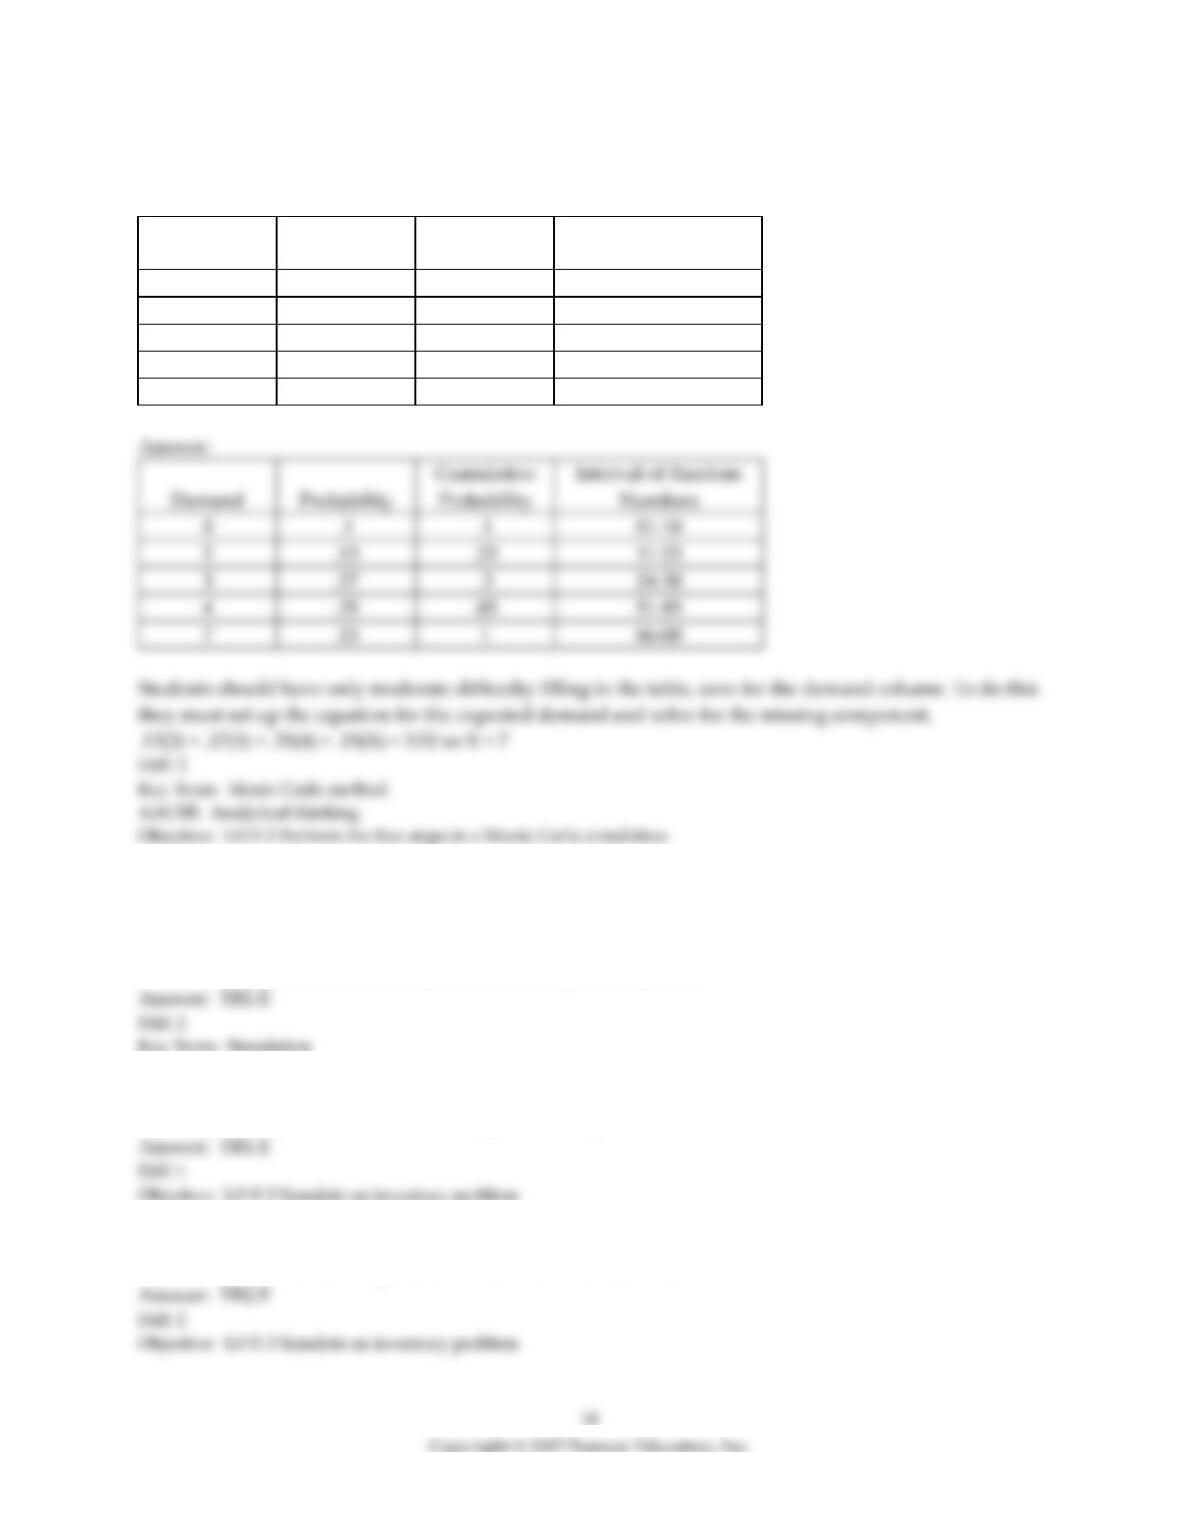
32) Complete the following table in preparation for a Monte Carlo simulation. The expected demand is
3.52.
Demand
Probability
Cumulative
Probability
Interval of Random
Numbers
0
.1
2
11-23
3
.5
4
86-00
Section 4 Simulation and Inventory Analysis
1) Results of simulation experiments with large numbers of trials or long experimental runs will generally
be better than those with fewer trials or shorter experimental runs.
2) In most real-world inventory problems, lead time and demand vary in ways that make simulation a
necessity because mathematical modeling is extremely difficult.
3) One reason for using simulation rather than an analytical model in an inventory problem is that the
simulation is able to handle probabilistic demand and lead times.
4) Which of the following is a necessity for common EOQ methodology but not simulations?
A) constant lead time
B) variable demand
C) variable holding costs
D) A and B
E) A, B and C
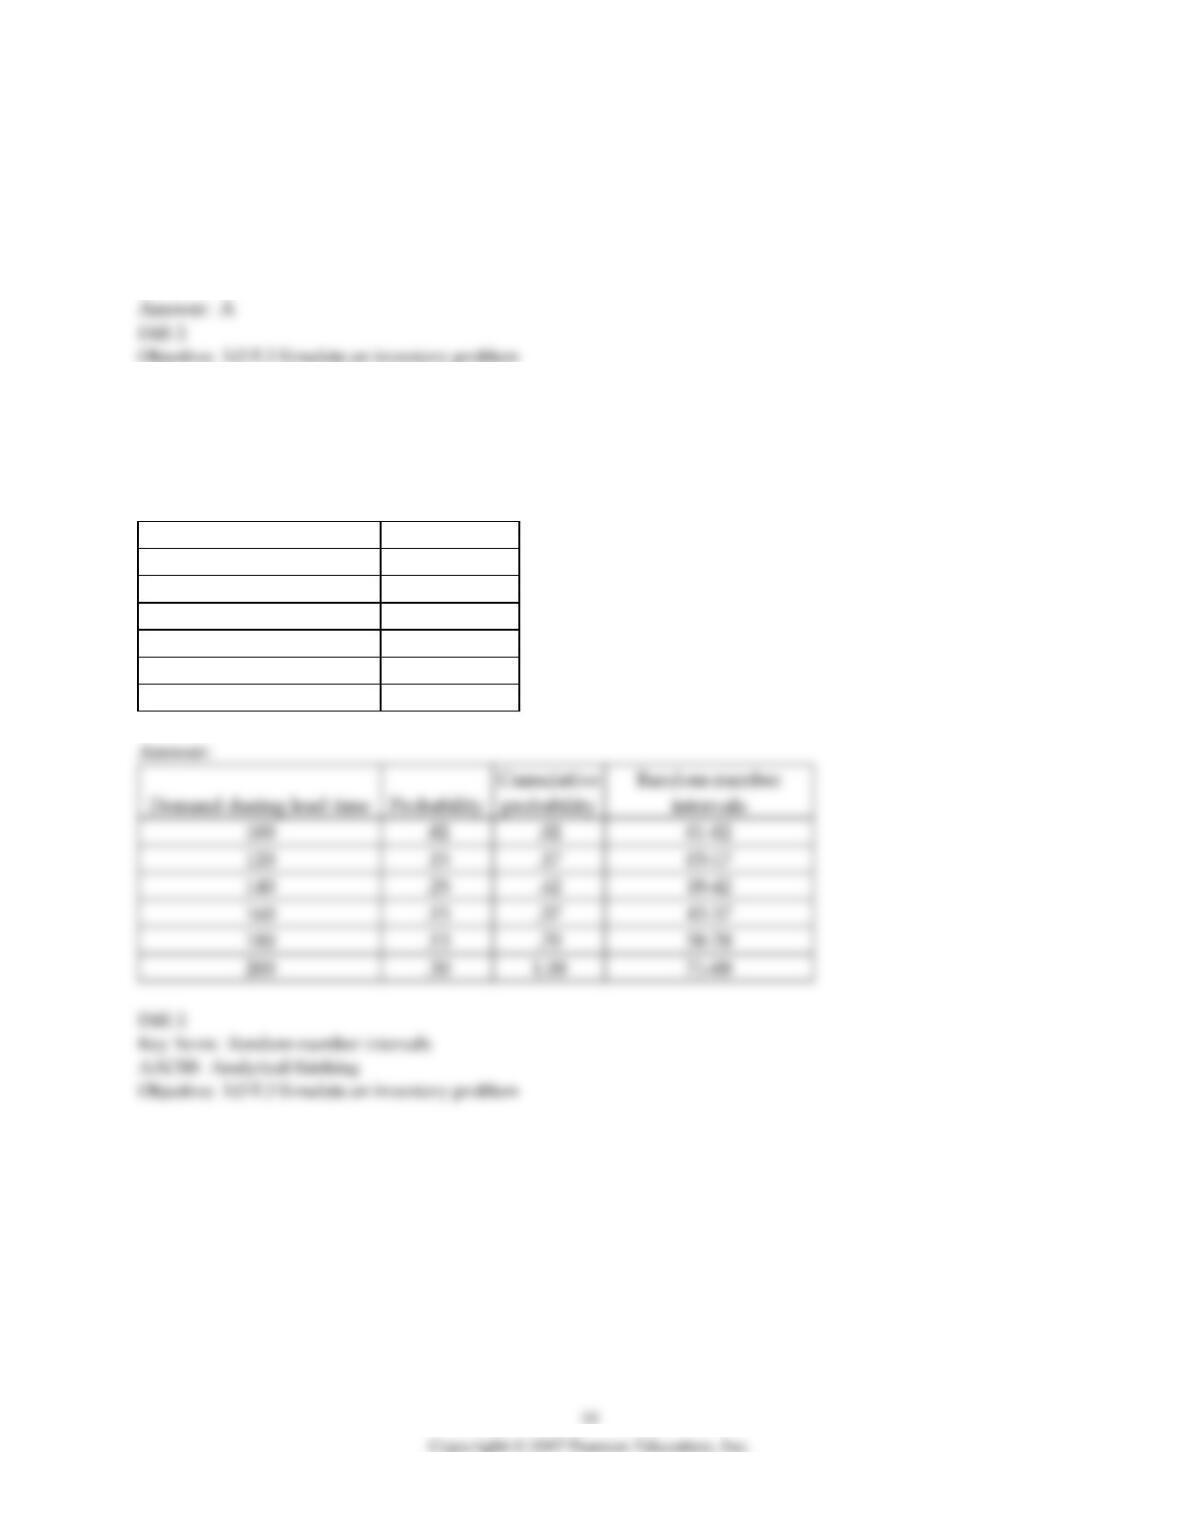
5) A warehouse manager needs to simulate the demand placed on a product that does not fit standard
models. The concept being measured is "demand during lead time," where both lead time and daily
demand are variable. The historical record for this product suggests the following probability
distribution. Convert this distribution into random number intervals.
Demand during lead time
Probability
100
.02
120
.15
140
.25
160
.15
180
.13
200
.30
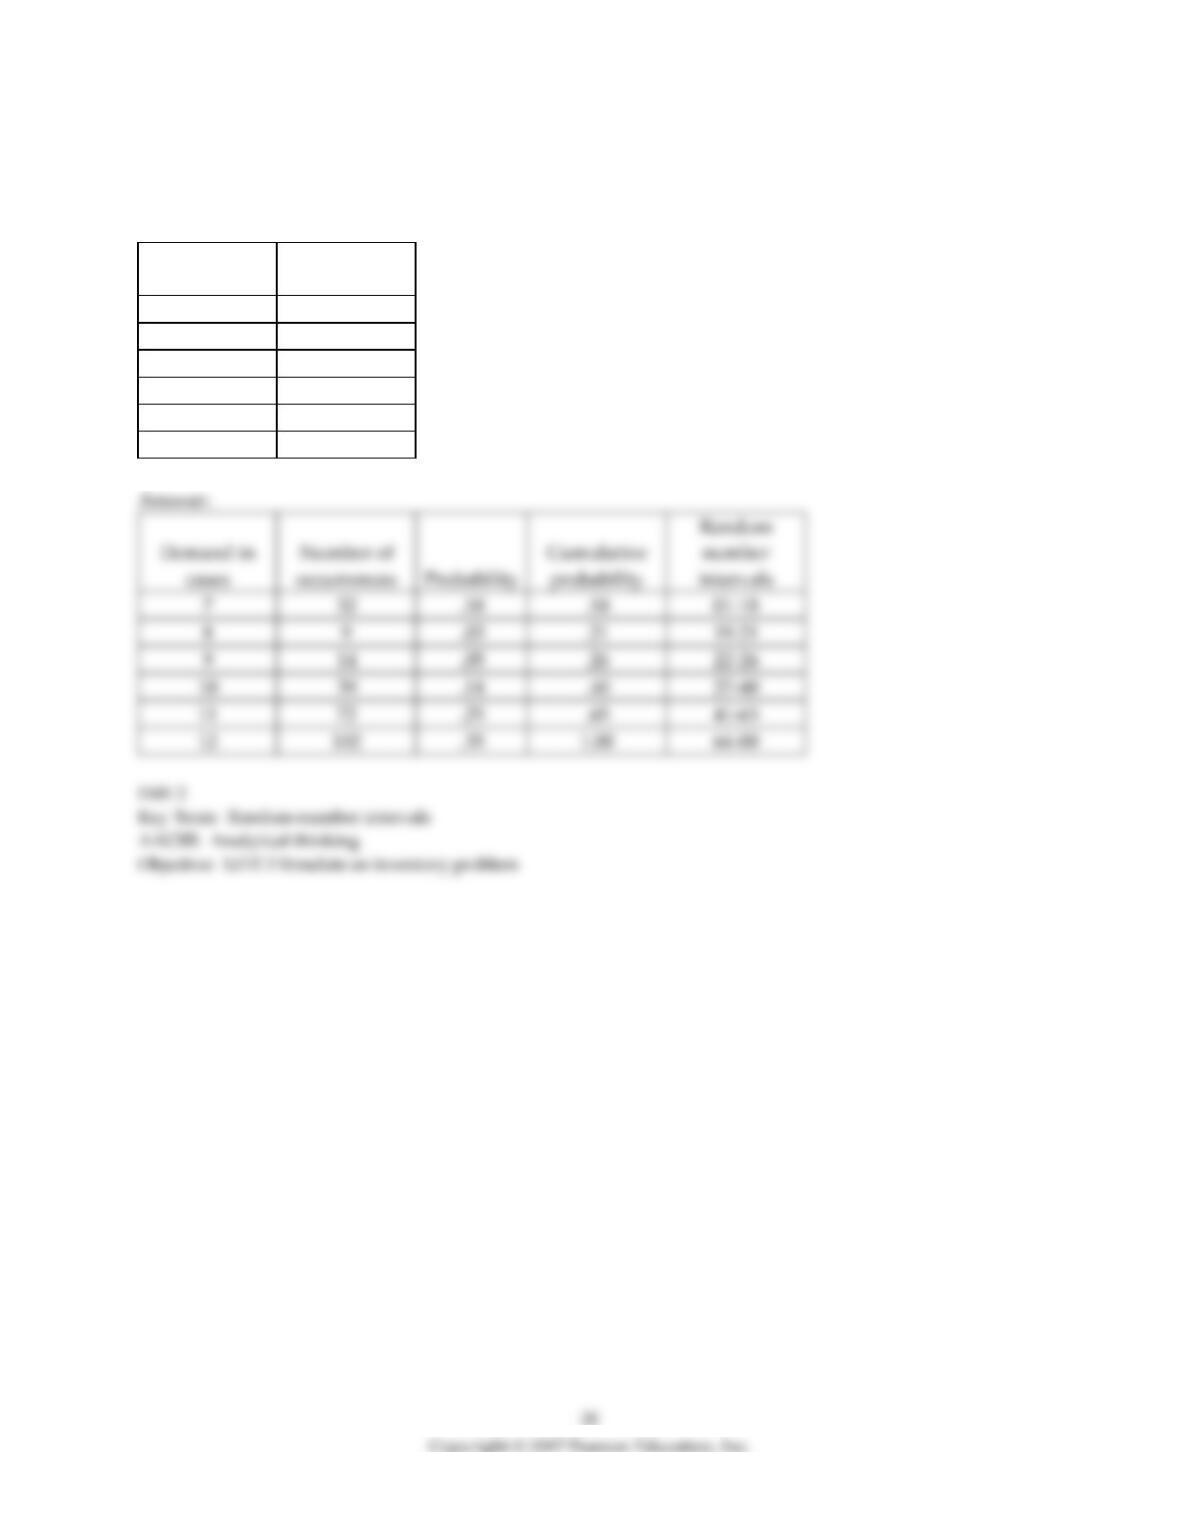
6) Historical records on a certain product indicate the following behavior for demand. The data represent
the 288 days that the business was open during 2000. Convert these data into random number intervals.
(Round each probability used to 2 decimal places, e.g., 0.36.)
Demand in
cases
Number of
occurrences
7
52
8
9
9
14
10
39
11
72
12
102
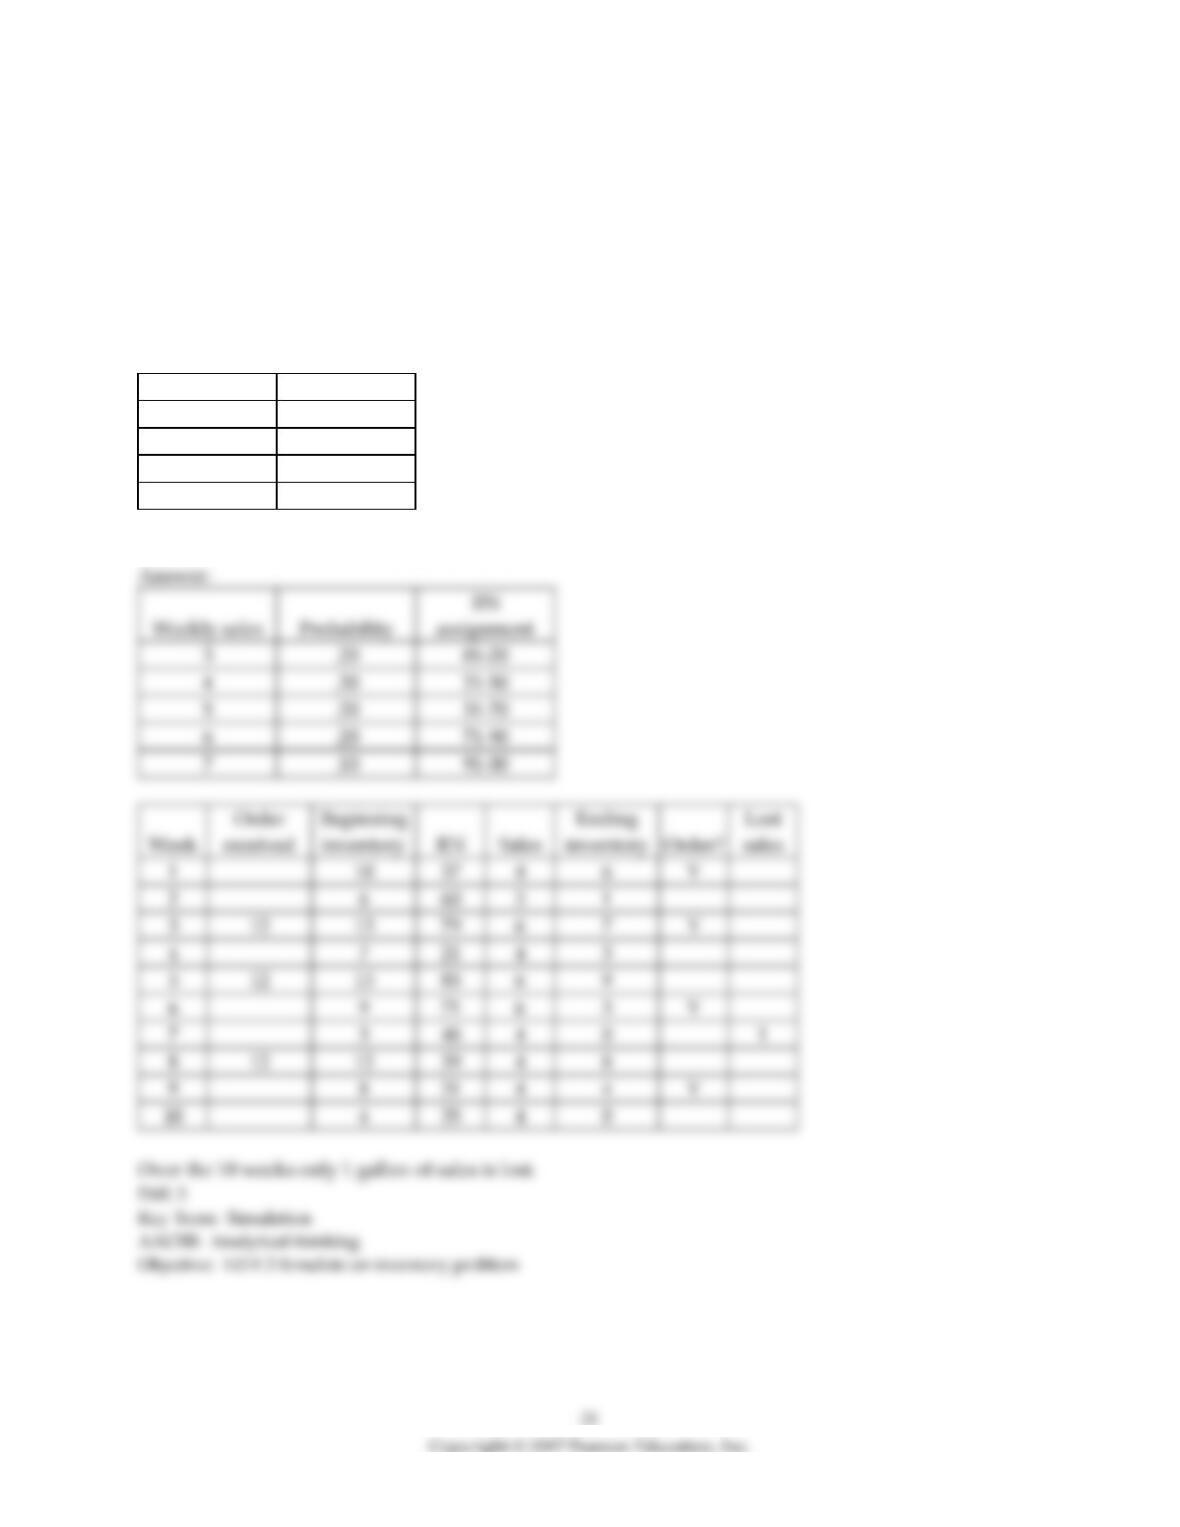
7) Sam's hardware store has an order policy of ordering 12 gallons of a specific primer whenever 7
gallons are on hand (unless there's already an ordered delivery due). The store would like to see how
well their policy works. Assume that beginning inventory in period 1 is 10 gallons and that orders are
placed at the end of the week to be received one week later. (In other words, if an order is placed at the
end of week one, it is available at the beginning of week 3.) Assume that if inventory is not on hand, it
will result in a lost sale. The weekly demand distribution obtained from past sales is found in the table
below. Also, use the random numbers that are provided and simulate 10 weeks' worth of sales. How
many sales are lost?
Weekly sales
Probability
3
.20
4
.30
5
.20
6
.20
Random numbers for sales: 37, 60, 79, 21, 85, 71, 48, 39, 31, 35
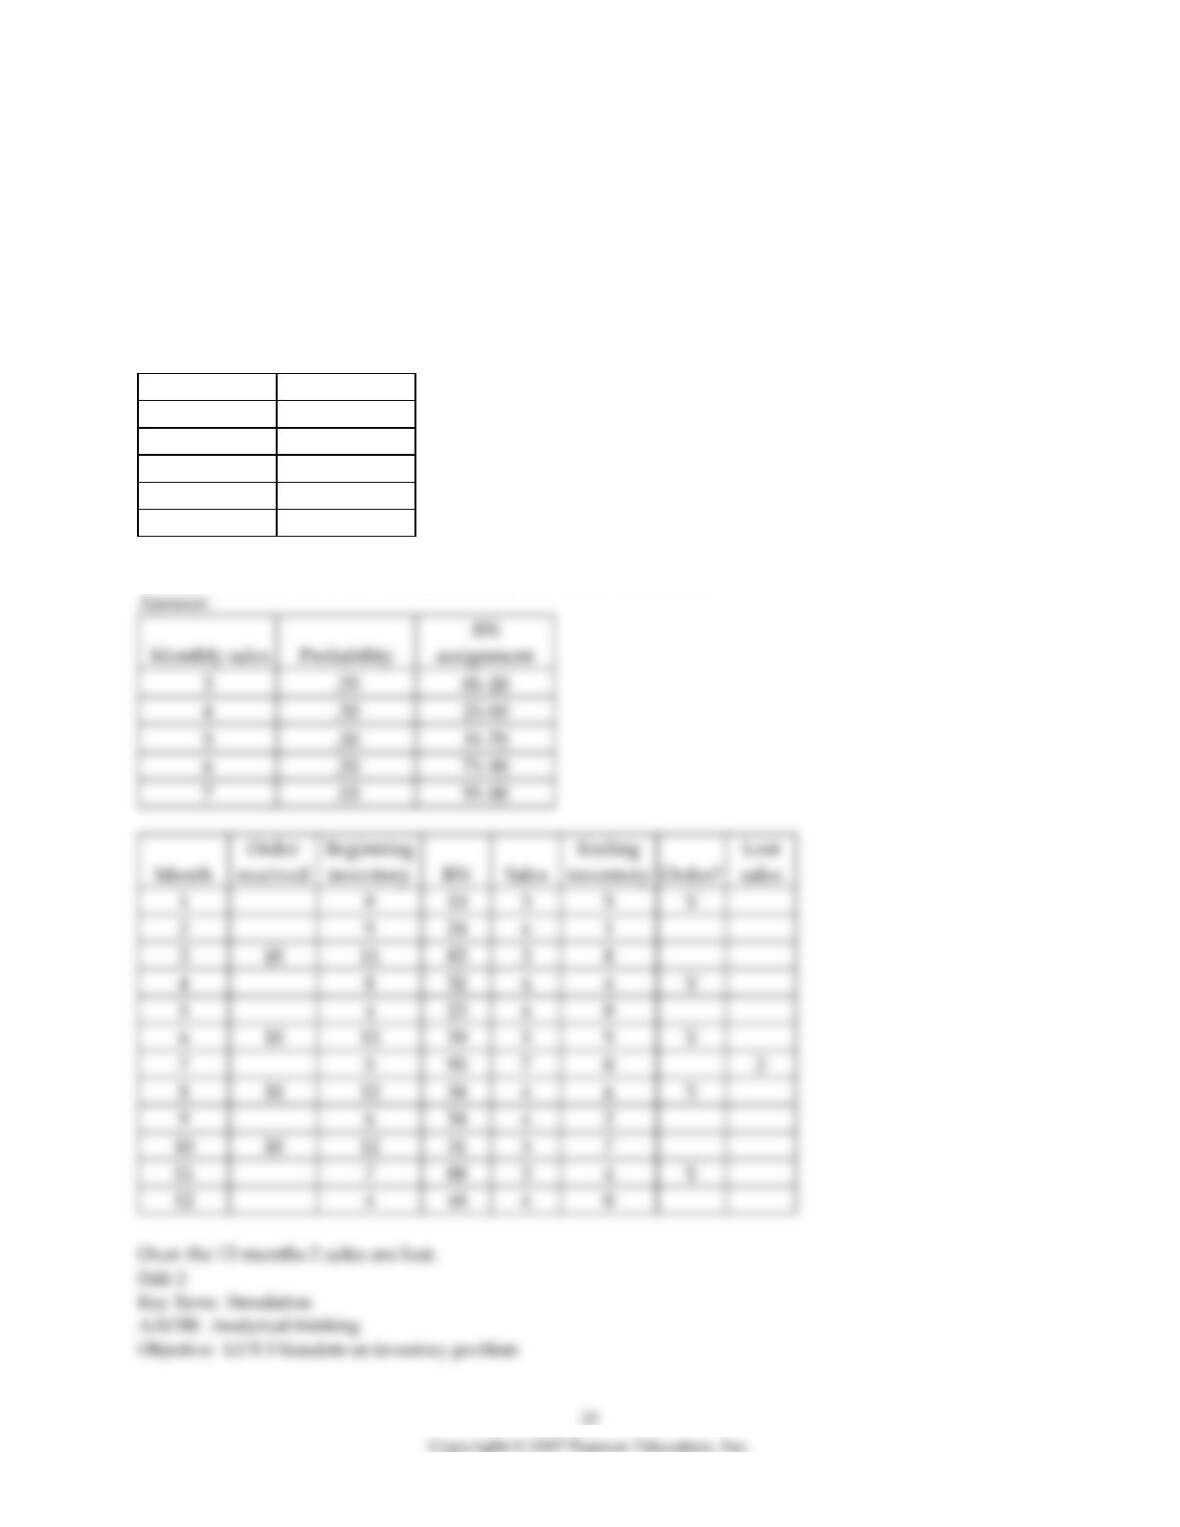
8) Julie's Diamond Boutique is very concerned with its order policies related to one-carat diamond
solitaires. Their current policy is to order 10 diamonds whenever their inventory reaches 6 diamonds
(unless there is already an ordered delivery due). Currently there are 8 diamonds on hand. Orders are
placed at the end of the month and take one month to arrive (e.g., if an order is placed at the end of
month 1, it will be available at the beginning of month 3). The following distribution of monthly sales has
been developed using historical sales. If Julie's Diamond Boutique does not have a diamond on hand, it
will result in a lost sale. Use the following random numbers to determine the number of lost sales of one-
carat solitaires at the store over 12 months.
Monthly sales
Probability
3
.20
4
.30
5
.20
6
.20
7
.10
Random numbers for sales: 10, 24, 03, 32, 23, 59, 95, 34, 34, 51, 08, 48


