Chapter 09 – Quality Control and Improvement
9-1
1. A complete system of quality control:
Difficulty: Hard
2. Sampling inspection by attributes:
Difficulty: Moderate
3. Which of the following statements about process quality control is NOT true?
Difficulty: Moderate
Chapter 09 – Quality Control and Improvement
9-2
4. A process control chart:
Difficulty: Hard
5. A Pareto chart:
Difficulty: Moderate
6. A cause-and-effect diagram:
Difficulty: Easy
7. Which of the following statements about process capability is accurate?
Difficulty: Moderate

Chapter 09 – Quality Control and Improvement
9-3
8. Suppose that a process is in a state of control and we have the following information for a
human weights measurement study.
Average weight of males in the study = 150 lbs.
Average range of the male weights = 100 lbs.
A2 = .577
D3 = 0
D4 = 2.115
What is the upper control limit for the average (mean) chart?
Difficulty: Moderate
9. Using the information from question 8, what is the upper control limit for the range chart?
Difficulty: Moderate
10. Suppose that you have taken 30 samples of 200 units each and calculated the proportion
defective as p = .075. What is the upper control limit for a p-chart?
Difficulty: Hard
Chapter 09 – Quality Control and Improvement
9-4
11. Using the same data as in question 10, what is the lower control limit for a p-chart?
Difficulty: Moderate
12. One of the earliest steps in designing a quality control system is to decide on:
Difficulty: Moderate
13. The appearance of a restaurant meal that is not satisfactory is an example of:
Difficulty: Moderate
14. Which of the following is/are assumption(s) of process control?
Difficulty: Moderate
Chapter 09 – Quality Control and Improvement
9-5
15. Which of the following quality control sample statistics indicates a quality characteristic
that is an attribute?
Difficulty: Moderate
16. For which of the following would a p-chart be used?
Difficulty: Moderate
17. Which of the following techniques are used for continuous improvement?
Difficulty: Moderate
Chapter 09 – Quality Control and Improvement
9-6
18. The ability of the process to meet, or exceed, its specifications can be determined by:
Difficulty: Easy
Difficulty: Hard
20. The Chair of the Quality Department at Motorola University wants to construct a p-chart
for determining whether the four faculty members teaching the course are in a state of control
concerning the number of students who fail in the course. Accordingly, the Chair sampled 500
final grades from last year for each instructor, and computed the number of failures per
instructor as 13, 11, 0, and 16 respectively. Compute the upper and lower standard control
limits for this chart.
Difficulty: Hard
Chapter 09 – Quality Control and Improvement
9-7
21. A process for filling liquid laundry detergent bottles monitors the volume in each bottle.
The Operations Manager has taken 5 samples with 4 observations (bottles) in each sample to
determine if the variation in volume is reasonable. The measurement unit is fluid ounces.
Calculate the center line for a process control chart that indicates whether the variation within
samples is reasonable (in a state of control).
Bottle
Sample 1
Sample 2
Sample 3
Sample 4
Sample 5
1
11.8
12.0
11.8
11.9
10.7
2
12.1
12.0
11.8
12.0
11.2
3
12.0
11.9
11.9
11.8
11.9
4
12.2
11.8
11.7
11.9
11.7
Difficulty: Moderate
22. A machining process is capable of producing a component with an average specification
of 5 inches and a process standard deviation of 0.1 inch. Suppose the customer accepts the
component as long as it falls between 4.8 inches and 5.2 inches, then the process capability
is:
Difficulty: Moderate

Chapter 09 – Quality Control and Improvement
9-8
23. “A production process delivers large amount of scrap products. Top management has
discovered that improper machine maintenance is the reason behind this failure.”
The above statement is an example of a special cause of variation.
Difficulty: Easy
24. Attribute control occurs when the product characteristic is measured on a continuous
scale.
Difficulty: Moderate
25. The central tendency (mean) of the process is the only information needed to determine if
the process is in a state of control.
Difficulty: Hard
26. The Cp measure requires the process to be centered for an accurate measure of process
capability.
Difficulty: Easy
27. The seven tools of quality control are equally applicable to both manufacturing and
service industries.
Difficulty: Moderate
Chapter 09 – Quality Control and Improvement
9-9
28. In process capability analysis, the standard deviation () refers to the standard deviation
of sample measures.
Difficulty: Moderate
29. Six Sigma efforts are aimed at eliminating waste.
Difficulty: Moderate
30. Six Sigma projects are typically managed by workers certified as black belts.
Difficulty: Moderate
31. Lean is another term for Six Sigma process improvement.
Difficulty: Moderate
32. If failure costs were very high, a company would still use inspection.
Difficulty: Moderate
33. There are two indicators of a process shift—points outside the control limits and an
upward or downward trend in the process average.
Difficulty: Moderate

Chapter 09 – Quality Control and Improvement
9-10
34. The quality tool that shows the relationship between two variables is a histogram.
Difficulty: Moderate
35. Lean projects are usually simpler than six sigma projects.
Difficulty: Moderate
36. Surveys indicate that p charts are used more frequently than average (mean) and range
charts are used.
Difficulty: Moderate
Chapter 09 – Quality Control and Improvement
9-11
37. Name the seven tools of quality that are typically used in a manufacturing process. Could
all of these tools be applied to service operations? Suggest some possible service operations
scenarios wherein we could apply all/some of these tools.
Difficulty: Moderate
Chapter 09 – Quality Control and Improvement
9-12
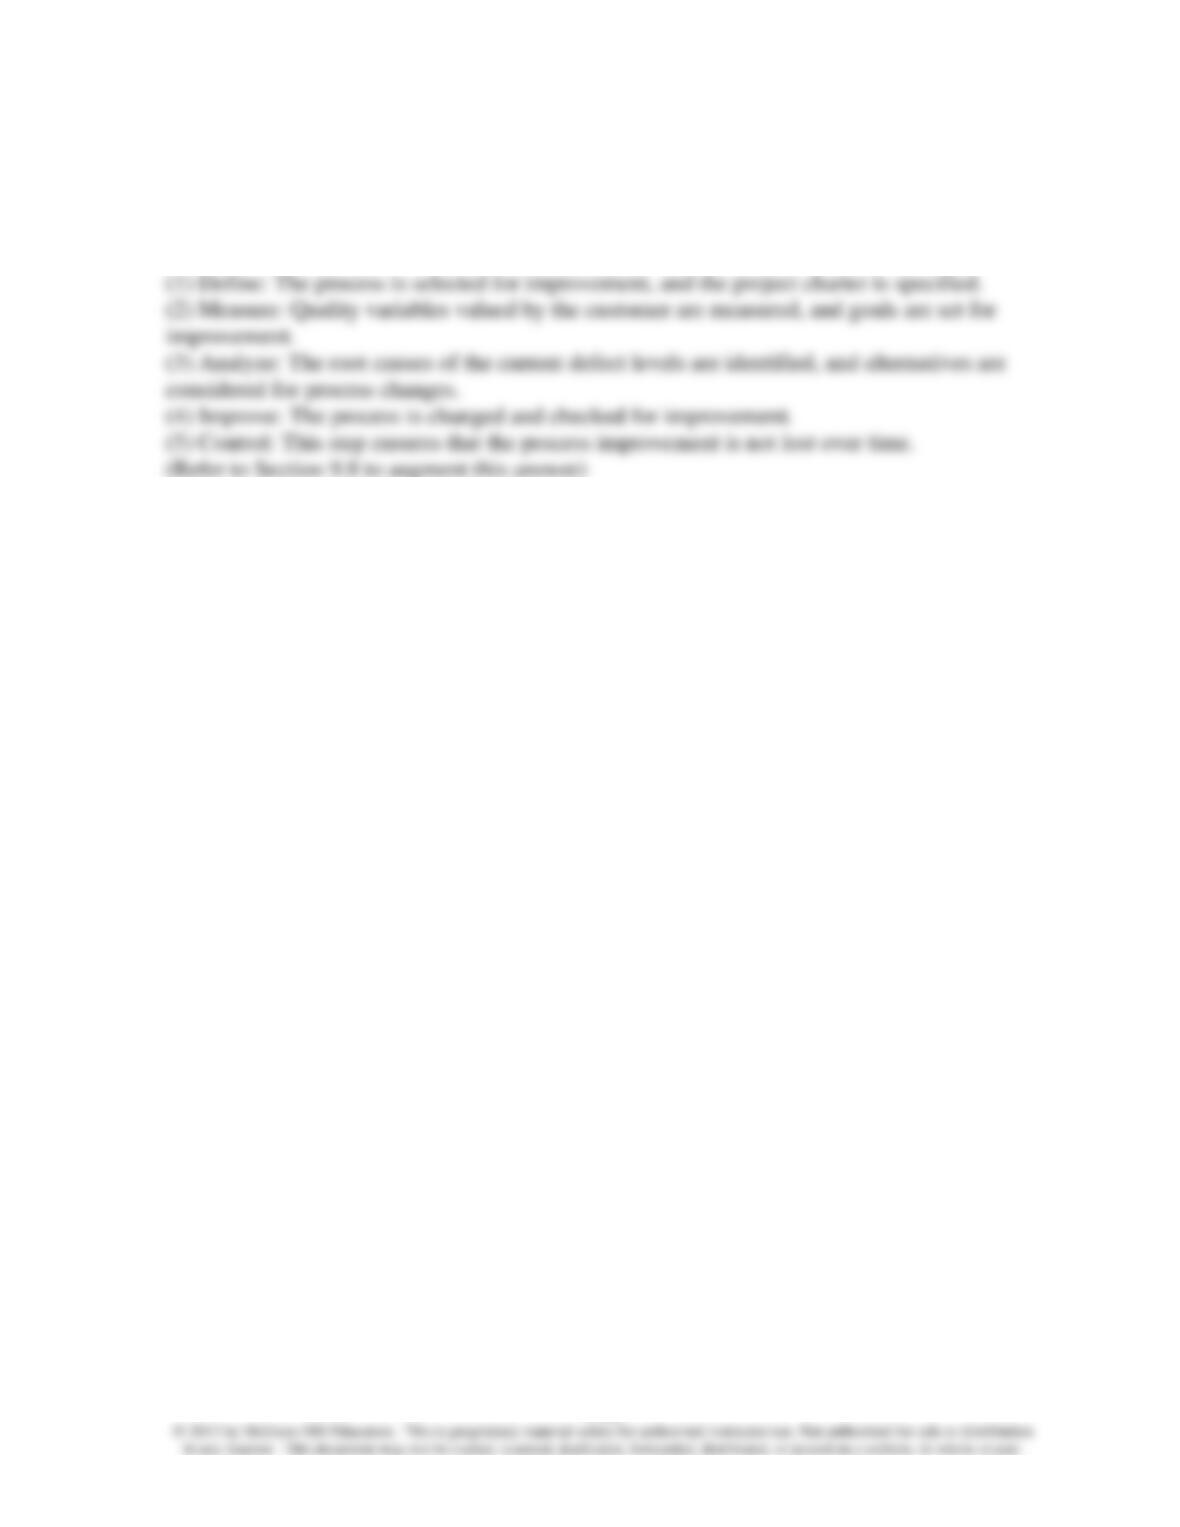
38. List and explain the five steps of the DMAIC process.
Difficulty: Moderate