Unlock document.
This document is partially blurred.
Unlock all pages and 1 million more documents.
Get Access
71) The mean and standard deviations for a process are μ = 90 and σ = 9, respectively. For the variable
control chart, a sample size of 16 will be used. Calculate the standard deviation of the sample means.
72) If μ = 9 ounces, σ = 0.5 ounces, and n = 9, calculate the 3-sigma control limits for the x-bar chart.
73) A hospital-billing auditor has been inspecting patient bills. While almost all bills contain some errors,
the auditor is looking now for large errors (errors in excess of $250). Each day last week, the auditor
examined 100 bills and found an average defect rate of 16%. Calculate the upper and lower limits for the
billing process for 99.73% confidence.
74) A local manufacturer supplies you with parts, and you would like to install a quality monitoring
system at his factory for these parts. Historically, the defect rate for these parts has been 1.25 percent
(You've observed this from your acceptance sampling procedures, which you would like to discontinue).
Develop ± 3σ control limits for this process. Assume the sample size will be 200 items.
22
75) Repeated sampling of a certain process shows the average of all sample ranges to be 1.0 cm. The
sample size has been constant at n = 5. What are the 3-sigma control limits for this R-chart?
76) A woodworker is concerned about the quality of the finished appearance of her work. In sampling
units of a split-willow hand-woven basket, she has found the following number of finish defects in ten
units sampled: 4, 0, 3, 1, 2, 0, 1, 2, 0, 2.
a. Calculate the average number of defects per basket.
b. If 3-sigma control limits are used, calculate the lower control limit and upper control limit.
77) The width of a bronze bar is intended to be one-eighth of an inch (0.125 inches). Inspection samples
contain five bars each. The average range of these samples is 0.01 inches. What are the upper and lower
control limits for the x-bar and R-chart for this process, using 3-sigma limits?
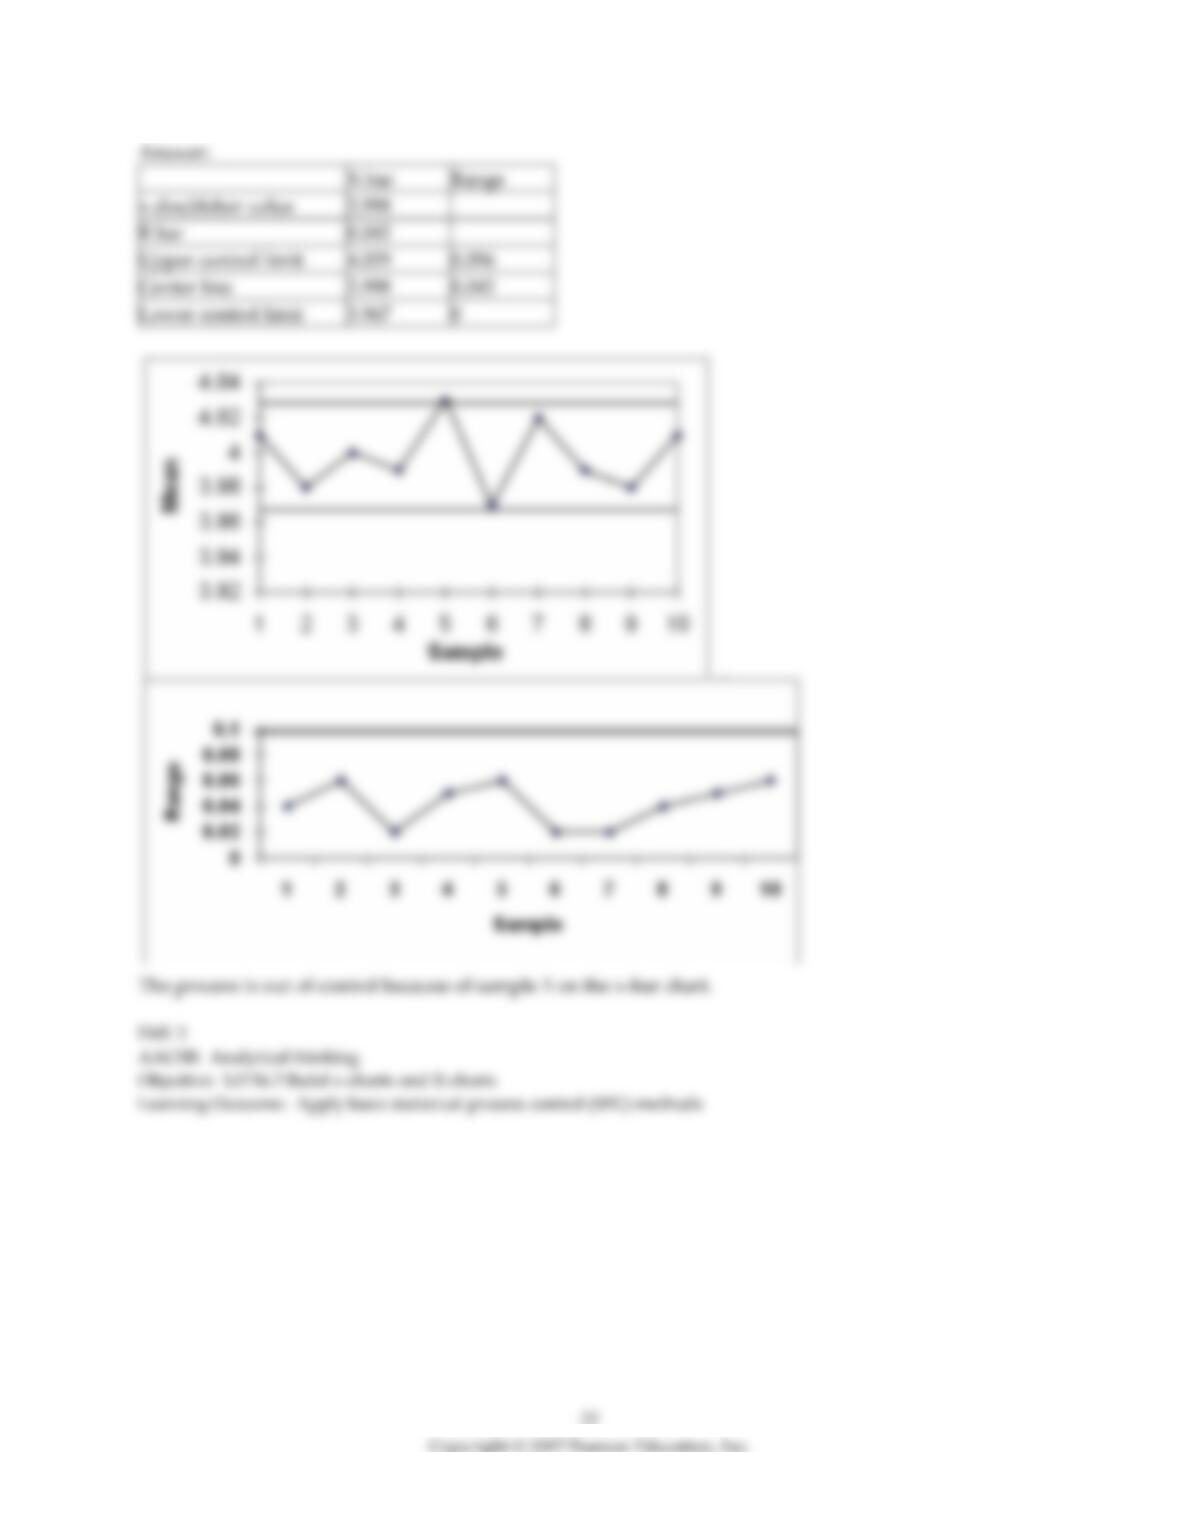
78) A part that connects two levels should have a distance between the two holes of 4". It has been
determined that x-bar and R-charts should be set up to determine if the process is in statistical control.
The following ten samples of size four were collected. Calculate the control limits, plot the control charts,
and determine if the process is in control.
Mean
Range
Sample 1
4.01
0.04
Sample 2
3.98
0.06
Sample 3
4.00
0.02
Sample 4
3.99
0.05
Sample 5
4.03
0.06
Sample 6
3.97
0.02
Sample 7
4.02
0.02
Sample 8
3.99
0.04
Sample 9
3.98
0.05
Sample 10
4.01
0.06
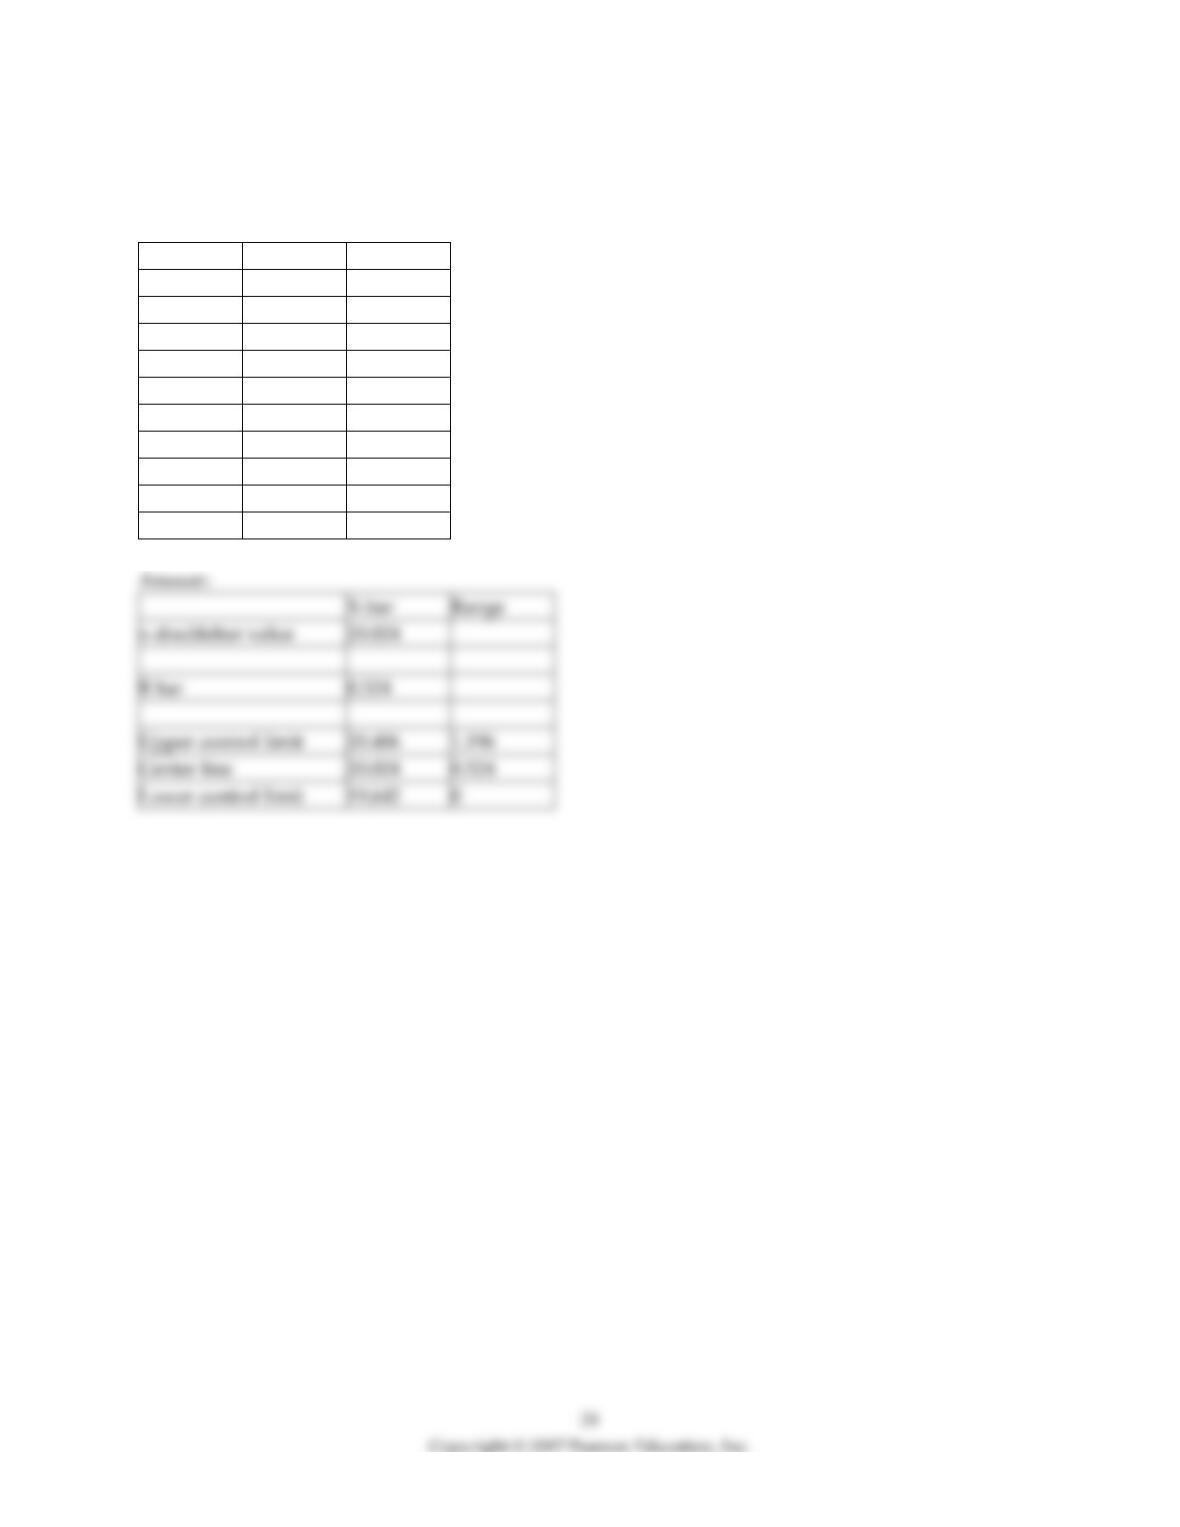
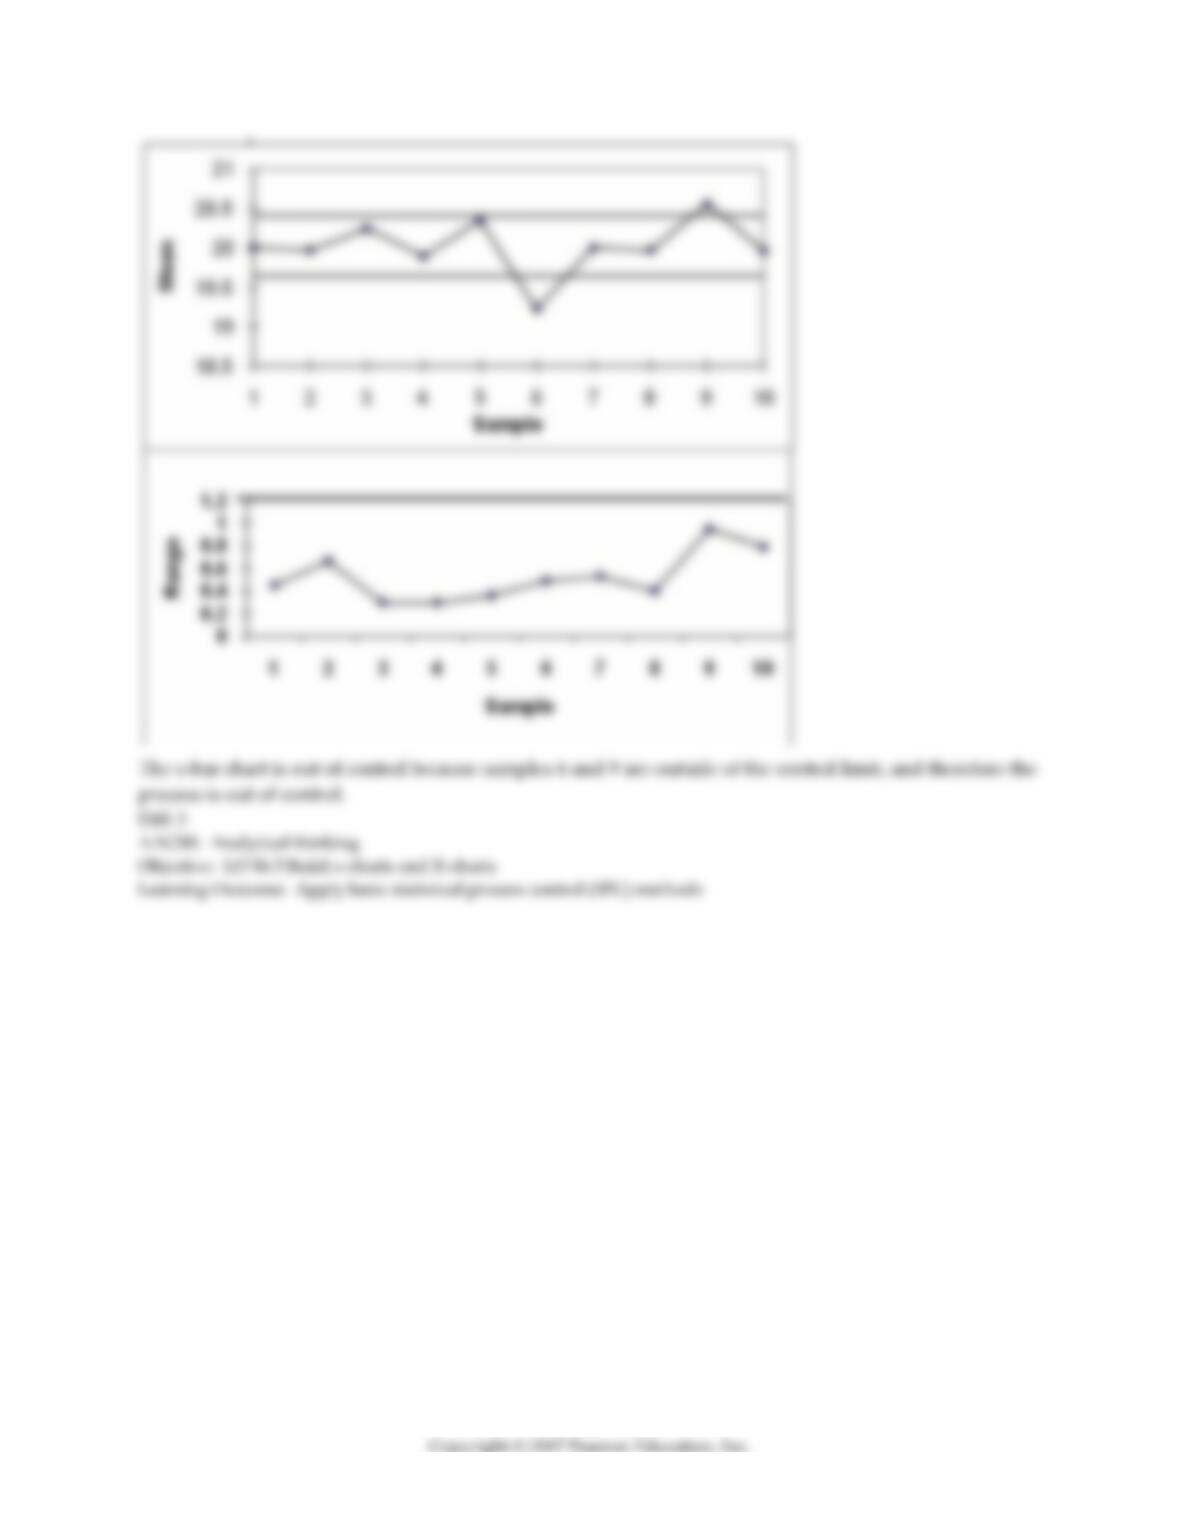
79) Ten samples of size four were taken from a process, and their weights measured. The sample averages
and sample ranges are in the following table. Construct and plot an x-bar and R-chart using these data. Is
the process in control?
Sample
Mean
Range
1
20.01
0.45
2
19.98
0.67
3
20.25
0.30
4
19.90
0.30
5
20.35
0.36
6
19.23
0.49
7
20.01
0.53
8
19.98
0.40
9
20.56
0.95
10
19.97
0.79
25
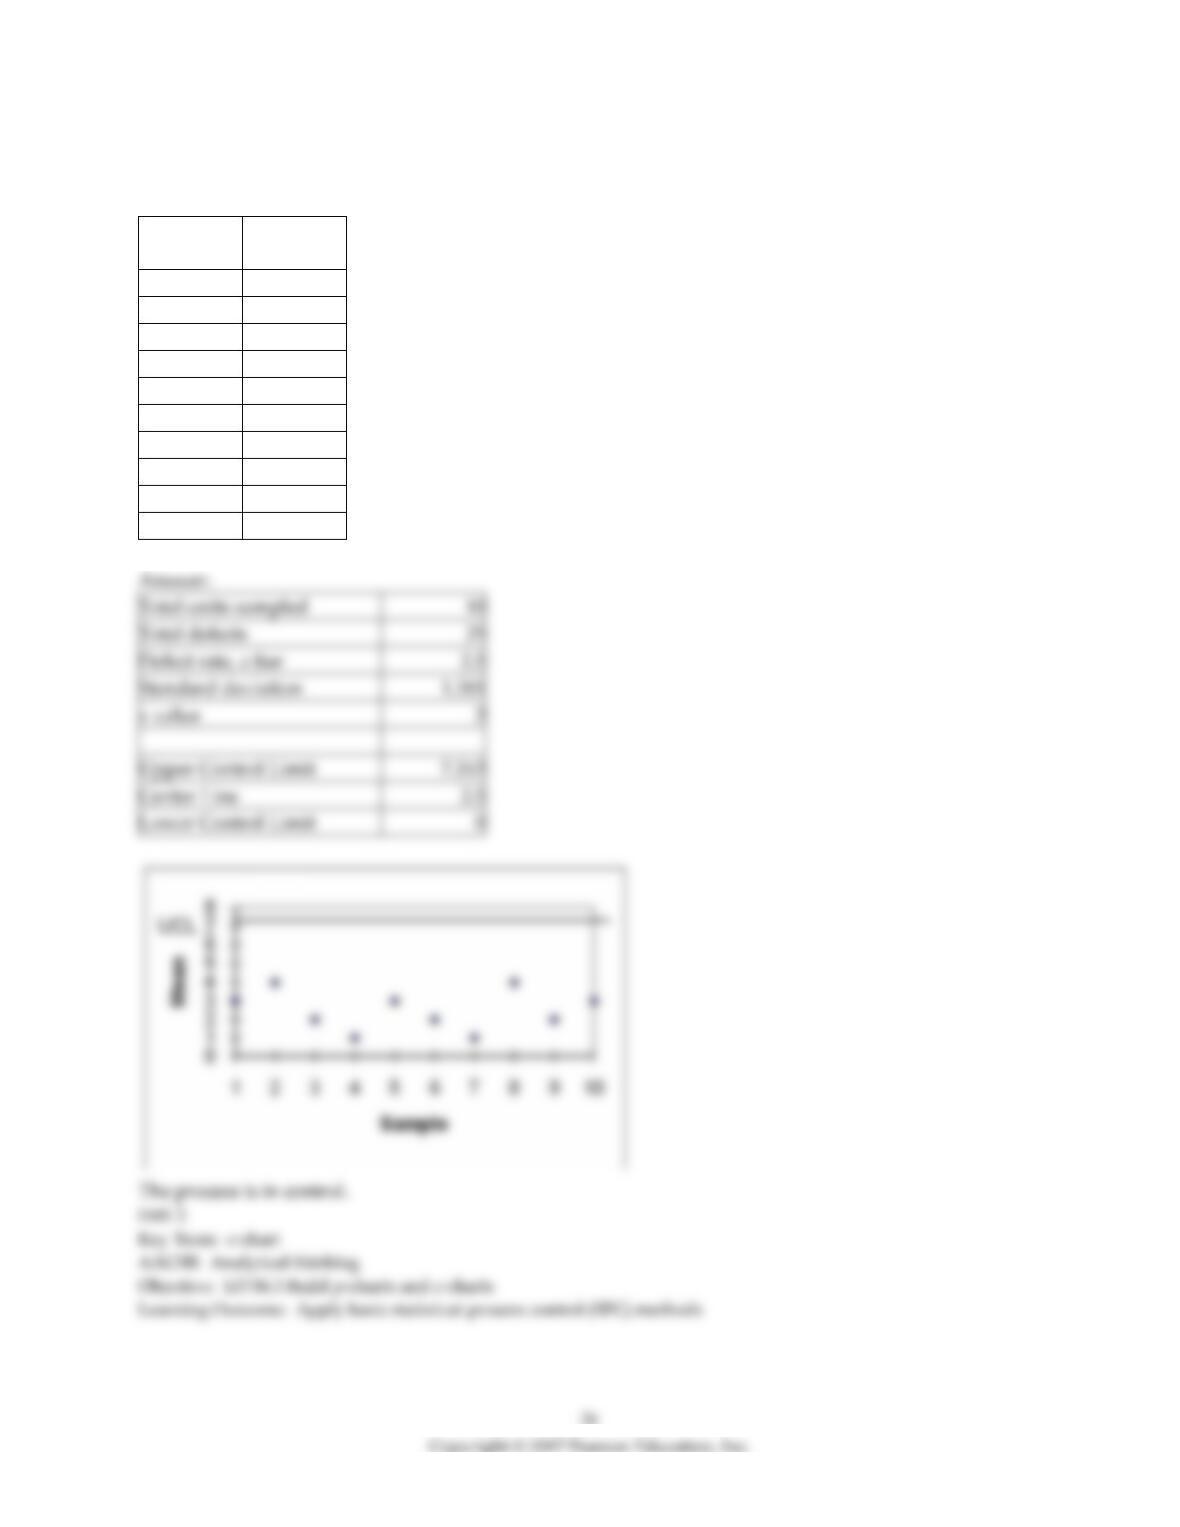
80) Larry's boat shop wants to monitor the number of blemishes in the paint of each boat. Construct a 3-
sigma c-chart to determine if their paint process is in control using the following data.
Sample
Number
Number of
Defects
1
3
2
4
3
2
4
1
5
3
6
2
7
1
8
4
9
2
10
3
81) A bank's manager has videotaped 20 different teller transactions to observe the number of mistakes
being made. Ten transactions had no mistakes, five had one mistake and five had two mistakes. Compute
proper control limits at the 90% confidence level.
82) A department chair wants to monitor the percentage of failing students in classes in her department.
Each class had an enrollment of 50 students last spring. The number of failing students in the 10 classes
offered that term were 1, 4, 2, 0, 0, 0, 0, 0, 0, and 3, respectively. Compute the control limits for a p-chart at
the 95% confidence level. Is the process in control?
83) A city police chief decides to do an annual review of the police department by checking the number of
monthly complaints. If the total number of complaints in each of the 12 months were 15, 18, 13, 12, 16, 20,
5, 10, 9, 11, 8, and 3 and the police chief wants a 90% confidence level, are the complaints in control?
84) A retail store manager is trying to improve and control the rate at which cashiers sign customers up
for store credit cards. Suppose the manager takes 10 samples, each with 100 observations. The p-bar
value is found to be .05, and the manager does not want a lower limit below .0064. What z-value would
this imply, and how confident can she be that the true lower limit is greater than or equal to .0064?
85) A retail store manager is trying to improve and control the rate at which cashiers sign customers up
for store credit cards. The manager takes several samples of size 50. He finds that each sample of 50
contained 5 credit card signups on average. Find p-bar and 99.73% control limits.
Section 2 Process Capability
1) A process that is in statistical control will always yield products that meet their design specifications.
2) The higher the process capability ratio, the greater the likelihood that process will be within design
specifications.
3) The Cpk index measures the difference between the desired and actual dimensions of goods or services
produced.
4) The process capability measures Cp and Cpk differ because:
A) only one ensures the process mean is centered within the limits.
B) Cp values above 1 indicate a capable process, while Cpk values above 2 indicate a capable process.
C) They do not differ: both are identical.
D) Cp values for a given process will always be greater than or equal to Cpk values.
E) Both A and D are correct.
5) A Cp value of 1.33 indicates a standard of how many standard deviations (sigmas)?
A) 6
B) 1.33
C) 2
D) 3
E) 4
6) Which of the following is true regarding the process capability index Cpk?
A) A Cpk index value of 1 is the highest possible.
B) The larger the Cpk, the more units meet specifications.
C) The Cpk index can only be used when the process centerline is also the specification centerline.
D) Positive values of the Cpk index are good; negative values are bad.
E) Its value will always be at least as large as the Cp value for the same process.
7) If the Cpk index exceeds 1:
A) the AQL must be smaller than the LTPD.
B) σ must be less than one-third of the absolute value of the difference between each specification limit
and the process mean.
C) the x-bar chart must indicate that the process is in control.
D) the process is capable of Six Sigma quality.
E) the process is characterized as "not capable."
8) The statistical definition of Six Sigma allows for 3.4 defects per million. This is achieved by what Cpk
index value?
A) 6
B) 1
C) 1.33
D) 1.67
E) 2
9) A Cpk index of 1.00 equates to what defect rate?
A) five percent
B) 3.4 defects per million items
C) 2.7 defects per 1,000 items
D) 97.23 percent
E) one percent
10) The term ________ is used to describe how well a process makes units within design specifications (or
tolerances).
11) A Cpk index greater than ________ is a capable process, one that generates fewer than 2.7 defects per
1000 at the ±3σ level.
12) What does it mean for a process to be "capable"?
13) What is the difference between the process capability ratio Cp and the process capability index Cpk?
14) A process is operating in such a manner that the mean of the process is exactly on the lower
specification limit. What must be true about the two measures of capability for this process?
15) The specifications for a manifold gasket that installs between two engine parts calls for a thickness of
2.500 mm ± .020 mm. The standard deviation of the process is estimated to be 0.004 mm. The process is
currently operating at a mean thickness of 2.50 mm. (a) What are the upper and lower specification limits
for this product? (b) What is the Cp for this process? (c) About what percent of all units of this gasket will
meet specifications? Does this meet the technical definition of Six Sigma?
16) The specifications for a manifold gasket that installs between two engine parts calls for a thickness of
2.500 mm ± .020 mm. The standard deviation of the process is estimated to be 0.004 mm. The process is
currently operating at a mean thickness of 2.50 mm. (a) What are the upper and lower specification limits
for this product? (b) What is the Cp for this process? (c) The purchaser of these parts requires a capability
index of 1.50. Is this process capable? Is this process good enough for the supplier? (d) If the process mean
were to drift from its setting of 2.500 mm to a new mean of 2.497, would the process still be good enough
for the supplier's needs?
17) The specification for a plastic liner for concrete highway projects calls for a thickness of 6.0 mm ± 0.1
mm. The standard deviation of the process is estimated to be 0.02 mm. What are the upper and lower
specification limits for this product? The process is known to operate at a mean thickness of 6.03 mm.
What is the Cp and Cpk for this process? About what percent of all units of this liner will meet
specifications?


