Operations Management, 12e (Heizer/Render/Munson)
Supplement 6 Statistical Process Control
Section 1 Statistical Process Control (SPC)
1) Some degree of variability is present in almost all processes.
2) The purpose of process control is to detect when natural causes of variation are present.
3) A normal distribution is generally described by its two parameters: the mean and the range.
4) A process is said to be in statistical control when assignable causes are the only sources of variation.
5) Mistakes stemming from workers’ inadequate training represent an assignable cause of variation.
6) Averages of small samples, not individual measurements, are generally used in statistical process
control.
7) The x-bar chart indicates that a gain or loss of uniformity has occurred in dispersion of a production
process.
8) The Central Limit Theorem states that when the sample size increases, the distribution of the sample
means will approach the normal distribution.
9) In statistical process control, the range is often used as a substitute for the standard deviation.
10) If the process average is in control, then the process range must also be in control.
11) A process range chart illustrates the amount of dispersion within the samples.
12) Mean charts and range charts complement one another, one detecting shifts in process average, the
other detecting shifts in process dispersion.
13) An x–bar chart is used when we are sampling attributes.
14) To measure the voltage of batteries, one would sample by attributes.
15) A p-chart is appropriate to plot the number of typographic errors per page of text.
16) A c-chart is appropriate to plot the number of flaws in a bolt of fabric.
17) The x–bar chart, like the c-chart, is based on the exponential distribution.
18) If a sample of items is taken and the mean of the sample is outside the control limits, the process is:
A) likely out of control and the cause should be investigated.
B) in control, but not capable of producing within the established control limits.
C) within the established control limits with only natural causes of variation.
D) monitored closely to see if the next sample mean will also fall outside the control limits.
E) producing high quality products.
19) The causes of variation in statistical process control are:
A) cycles, trends, seasonality, and random variations.
B) producer’s causes and consumer’s causes.
C) mean and range.
D) natural causes and assignable causes.
E) Type I and Type II.
20) Natural variations:
A) affect almost every production process.
B) are the many sources of variation that occur when a process is under control.
C) when grouped, form a pattern, or distribution.
D) are tolerated, within limits, when a process is under control.
E) All of the above are true.
21) Natural variations:
A) are variations that are to be identified and investigated.
B) are variations that can be traced to a specific cause.
C) are the same as assignable variations.
D) lead to occasional false findings that processes are out of control.
E) play no role in statistical process control.
22) Assignable variation:
A) is a sign that a process is under control.
B) is to be identified and investigated.
C) is the same as random variation.
D) is variation that cannot be traced to a specific cause.
E) leads to a steep OC curve.
23) Assignable causes:
A) are not as important as natural causes.
B) are within the limits of a control chart.
C) depend on the inspector assigned to the job.
D) are also referred to as “chance” causes.
E) are causes of variation that can be identified and investigated.
24) Control charts for variables are based on data that come from:
A) acceptance sampling.
B) individual items.
C) averages of small samples.
D) averages of large samples.
E) the entire lot.
25) The purpose of an x-bar chart is to determine whether there has been a:
A) change in the dispersion of the process output.
B) change in the percent defective in a sample.
C) change in the central tendency of the process output.
D) change in the number of defects in a sample.
E) change in the AOQ.
26) The number of defects after a hotel room cleaning (sheets not straight, smears on mirror, missed
debris on carpet, etc.) should be measured using what type of control chart?
A) x-bar chart
B) R-chart
C) p-chart
D) c-chart
E) either x-bar chart or R chart
27) The number of late insurance claim payouts per 100 should be measured with what type of control
chart?
A) x-bar chart
B) R-chart
C) p-chart
D) c-chart
E) either p-chart or c-chart
28) The upper and lower limits for diving ring diameters made by John’s Swimming Co. are 40 and 39
cm., respectively. John took 11 samples with the following average diameters (39, 39.1, 39.2, 39.3, 39.4,
39.5 39.6, 39.7, 39.8, 39.9, 40). Is the process in control?
A) Yes, no diameters exceeded the control limits.
B) No, some diameters exceeded the control limits.
C) No, there is a distinguishable pattern to the samples.
D) No, the range is not in control.
E) There is not enough information to make a decision.
29) Red Top Cab Company receives multiple complaints per day about driver behavior. Over 9 days the
owner recorded the number of calls to be 3, 0, 8, 9, 6, 7, 4, 9, and 8. What is the upper control limit for the
3-sigma c-chart?
A) 13.35
B) 8.45
C) 24.00
D) 0.00
E) 9.03
30) A process that is assumed to be in control with limits of 89 ± 2 had sample averages for the x-bar chart
of the following: 87.1, 87, 87.2, 89, 90, 88.5, 89.5, and 88. Is the process in control?
A) Yes.
B) No, one or more averages exceeded the limits.
C) Not enough information to tell.
D) No, there is a distinguishable trend.
E) No, two or more consecutive points are very near the lower (or upper) limit.
31) Ten samples of a process measuring the number of returns per 100 receipts were taken for a local
retail store. The number of returns were 10, 9, 11, 7, 3, 12, 8, 4, 6, and 11. Find the standard deviation of
the sampling distribution for the p-bar chart.
A) There is not enough information to answer the question.
B) .081
C) 8.1
D) .0273
E) .0863
32) An x–bar control chart was examined and no data points fell outside of the limits. Can this process be
considered in control?
A) Not yet, there could be a pattern to the points.
B) Not yet, the R-chart must be checked.
C) Not yet, the number of samples must be known.
D) Yes.
E) Both A and B
33) Statistical process control charts:
A) display the measurements on every item being produced.
B) display upper and lower limits for process variables or attributes and signal when a process is no
longer in control.
C) indicate to the process operator the average outgoing quality of each lot.
D) indicate to the operator the true quality of material leaving the process.
E) are a graphic way of classifying problems by their level of importance, often referred to as the 80-20
rule.
34) The Central Limit Theorem:
A) is the theoretical foundation of the c-chart.
B) states that the average of assignable variations is zero.
C) allows managers to use the normal distribution as the basis for building some control charts.
D) states that the average range can be used as a proxy for the standard deviation.
E) controls the steepness of an operating characteristic curve.
35) For a 3-sigma x-bar chart where the process standard deviation is known, the upper control limit:
A) is 3σ below the mean of sample means for a 3σ control chart.
B) is 3σ above the mean of sample means for a 3σ control chart.
C) is 3σ/ below the mean of sample means for a 3σ control chart.
D) is 3σ/ above the mean of sample means for a 3σ control chart.
E) cannot be calculated unless the average range is known.
36) Up to three standard deviations above or below the centerline is the amount of variation that
statistical process control allows for:
A) Type I errors.
B) about 95.5% variation.
C) natural variation.
D) all types of variation.
E) assignable variation.
37) A manager wants to build 3-sigma x-bar control limits for a process. The target value for the mean of
the process is 10 units, and the standard deviation of the process is 6. If samples of size 9 are to be taken,
what will be the upper and lower control limits, respectively?
A) -8 and 28
B) 16 and 4
C) 12 and 8
D) 4 and 16
E) 8 and 12
38) Jars of pickles are sampled and weighed. Sample measures are plotted on control charts. The ideal
weight should be precisely 11 oz. Which type of chart(s) would you recommend?
A) p-chart
B) c-chart
C) both an x-bar chart and an R-chart
D) an x-bar chart, but not an R-chart
E) both a p-chart and a c-chart
39) If = 23 ounces, σ = 0.4 ounces, and n = 16, what will be the ±3σ control limits for the x-bar chart?
A) 21.8 to 24.2 ounces
B) 23 ounces
C) 22.70 to 23.30 ounces
D) 22.25 to 23.75 ounces
E) 22.90 to 23.10 ounces
40) The usual purpose of an R-chart is to signal whether there has been a:
A) gain or loss in dispersion.
B) change in the percent defective in a sample.
C) change in the central tendency of the process output.
D) change in the number of defects in a sample.
E) change in the consumer‘s risk.
41) A manager wishes to build a 3-sigma range chart for a process. The sample size is five, the mean of
sample means is 16.01, and the average range is 5.3. From Table S6.1, the appropriate value of D3 is 0, and
D4 is 2.115. What are the UCL and LCL, respectively, for this range chart?
A) 33.9 and 11.2
B) 33.9 and 0
C) 11.2 and 0
D) 6.3 and 0
E) 31.91 and 0.11
42) Plots of sample ranges indicate that the most recent value is below the lower control limit. What
course of action would you recommend?
A) Since there is no obvious pattern in the measurements, variability is in control.
B) One value outside the control limits is insufficient to warrant any action.
C) Lower than expected dispersion is a desirable condition; there is no reason to investigate.
D) The process is out of control; reject the last units produced.
E) Variation is not in control; investigate what created this condition.
43) To set x–bar chart upper and lower control limits, one must know the process central line, which is
the:
A) average of the sample means.
B) total number of defects in the population.
C) percent defects in the population.
D) size of the population.
E) average range.
44) According to the text, what is the most common choice of limits for control charts?
A) ±1 standard deviation
B) ±2 standard deviations
C) ±3 standard deviations
D) ±3 standard deviations for means and ± 2 standard deviations for ranges
E) ±6 standard deviations
45) Which of the following is true of a p-chart?
A) The lower control limit is found by subtracting a fraction from the average number of defects.
B) The lower control limit indicates the minimum acceptable number of defects.
C) The lower control limit equals D3 times p-bar.
D) The lower control limit may be at zero.
E) The lower control limit is the same as the lot tolerance percent defective.
46) The normal application of a p-chart is in:
A) process sampling by variables.
B) acceptance sampling by variables.
C) process sampling by attributes.
D) acceptance sampling by attributes.
E) process capability ratio computations.
47) What is the statistical process chart used to control the number of defects per unit of output?
A) x-bar chart
B) R-chart
C) p-chart
D) AOQ chart
E) c-chart
48) The c–chart signals whether there has been a:
A) gain or loss in uniformity.
B) change in the number of defects per unit.
C) change in the central tendency of the process output.
D) change in the percent defective in a sample.
E) change in the AOQ.
49) The local newspaper receives several complaints per day about typographic errors. Over a seven-day
period, the publisher has received calls from readers reporting the following total daily number of errors:
4, 3, 2, 6, 7, 3, and 9. Based on these data alone, what type of control chart(s) should the publisher use?
A) p-chart
B) c-chart
C) x-bar chart
D) R-chart
E) x-bar chart and R-chart
50) A manufacturer uses statistical process control to control the quality of the firm’s products. Samples of
50 of Product A are taken, and a defective/acceptable decision is made on each unit sampled. For Product
B, the number of flaws per unit is counted. What type(s) of control charts should be used?
A) p-charts for both A and B
B) p-chart for A, c-chart for B
C) c-charts for both A and B
D) p-chart for A, mean and range charts for B
E) c-chart for A, mean and range charts for B
51) A nationwide parcel delivery service keeps track of the number of late deliveries (more than 30
minutes past the time promised to clients) per day. They plan on using a control chart to plot their results.
Which type of control chart(s) would you recommend?
A) both x-bar chart and R-chart
B) p-chart
C) c-chart
D) x-bar chart
E) both p-chart and c-chart
52) A run test is used:
A) to examine variability in acceptance sampling plans.
B) in acceptance sampling to establish control.
C) to examine points in a control chart to check for natural variability.
D) to examine points in a control chart to check for nonrandom variability.
E) to test the validity of the Central Limit Theorem.
53) ________ is variation in a production process that can be traced to specific causes.
54) The ________ -chart is the chief way to control attributes.
55) If a process has only natural variations, ________ percent of the time the sample averages will fall
inside the ±3-sigma control limits.
56) The ________ is a quality control chart that indicates when changes occur in the central tendency of a
production process.
57) The ________ is a quality control chart used to control the number of defects per unit of output.
58) What is the basic objective of a process control system?
59) Briefly explain what the Central Limit Theorem has to do with control charts.
60) What are the three possible results (or findings) from the use of control charts?
61) Why do range charts exist? Aren’t x-bar charts enough?
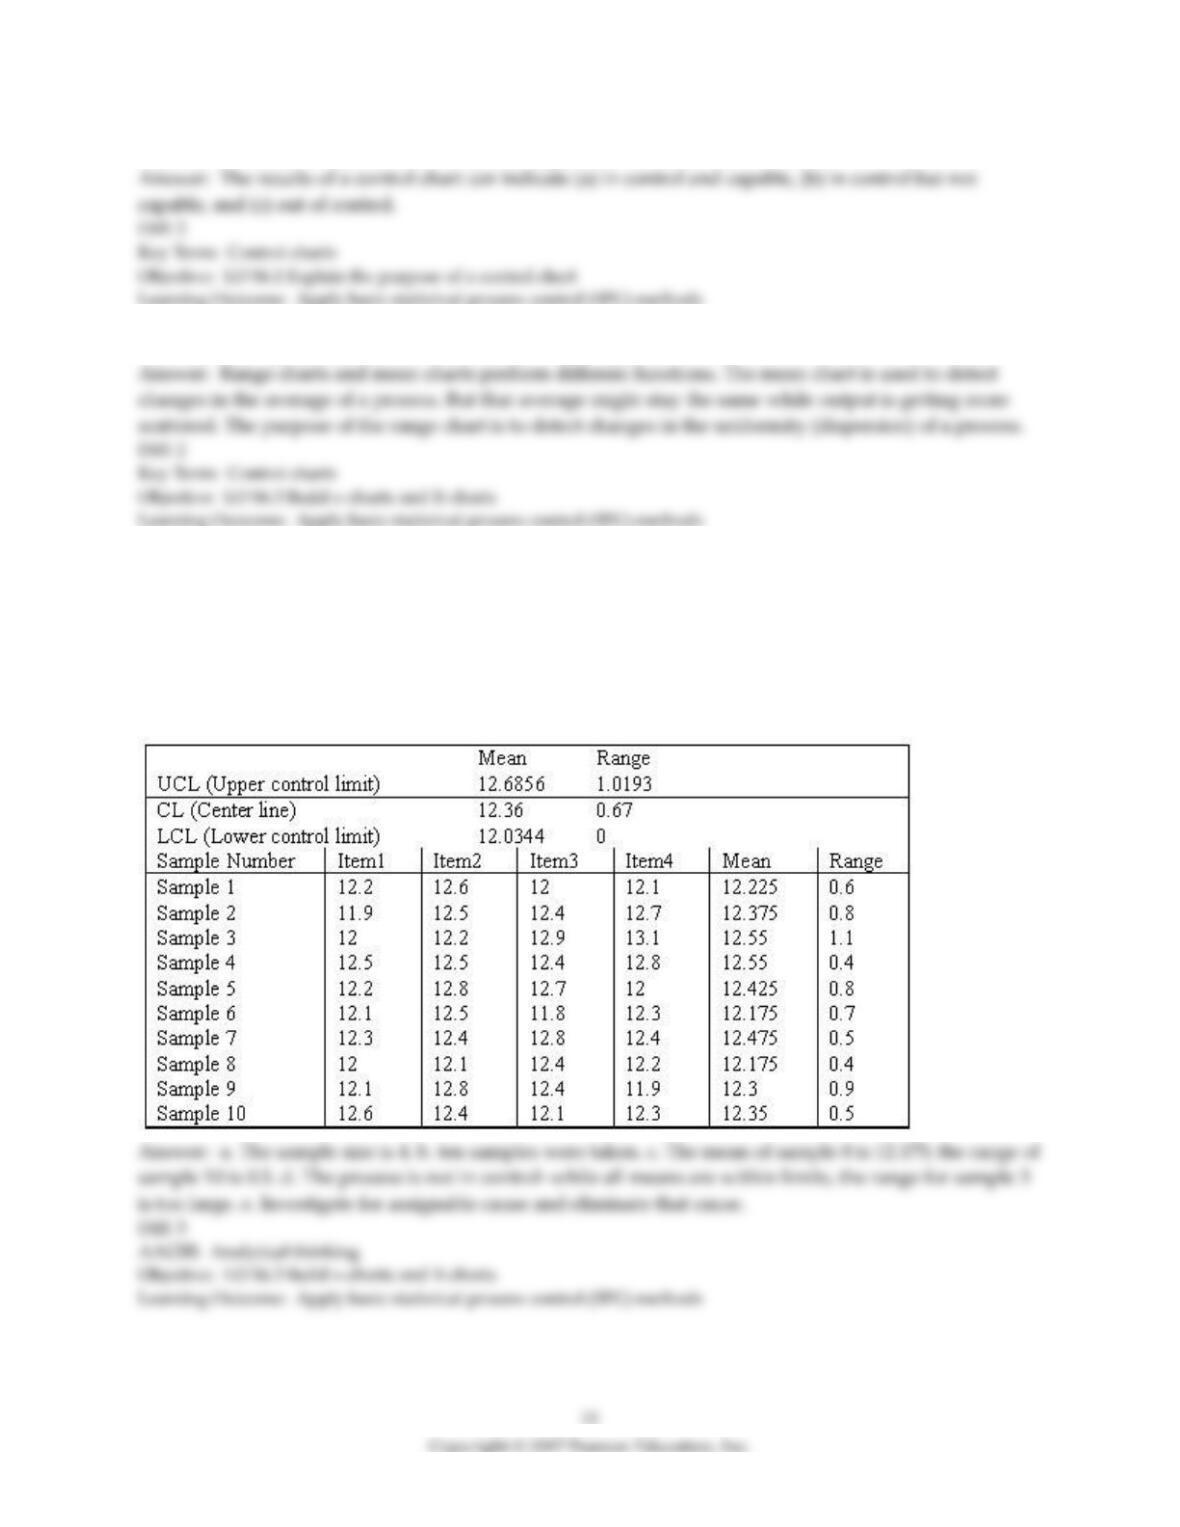
62) Examine the Statistical Process Control outputs below. Answer the following questions.
a. What is the sample size?
b. What is the number of samples?
c. What is the mean of sample 8; what is the range of sample 10?
d.. Is this process in control? Explain—a simple Yes or No is insufficient.
e. What additional steps should the quality assurance team take?
63) What is the difference between natural and assignable causes of variation?
64) A quality analyst wants to construct a sample mean chart for controlling a packaging process. He
knows from past experience that the process standard deviation is two ounces. Each day last week, he
randomly selected four packages and weighed each. The data from that activity appear below.
Weight
Day
Package 1
Package 2
Package 3
Package 4
Monday
23
22
23
24
Tuesday
23
21
19
21
Wednesday
20
19
20
21
Thursday
18
19
20
19
Friday
18
20
22
20
(a) Calculate all sample means and the mean of all sample means.
(b) Calculate upper and lower 2-sigma x-bar chart control limits that allow for natural variations.
(c) Based on the x-bar chart, is this process in control?
65) A quality analyst wants to construct a sample mean chart for controlling a packaging process. He
knows from past experience that when the process is operating as intended, packaging weight is
normally distributed with a mean of twenty ounces, and a process standard deviation of two ounces.
Each day last week, he randomly selected four packages and weighed each. The data from that activity
appear below.
Weight
Day
Package 1
Package 2
Package 3
Package 4
Monday
23
22
23
24
Tuesday
23
21
19
21
Wednesday
20
19
20
21
Thursday
18
19
20
19
Friday
18
20
22
20
(a) If he sets an upper control limit of 21 and a lower control limit of 19 around the target value of twenty
ounces, the control chart is based on what value of z?
(b) With the UCL and LCL of part a, what do you conclude about this process–is it in control?
66) An operator trainee is attempting to monitor a filling process that has an overall average of 705 cc.
The average range is 17 cc. If you use a sample size of 6, what are the upper and lower control limits for
the x-bar chart and R-chart?
67) The defect rate for a product has historically been about 1.6%. What are the upper and lower control
chart limits for a p-chart, if you wish to use a sample size of 100 and 3-sigma limits?
68) A small, independent amusement park collects data on the number of cars with out–of-state license
plates. The sample size is fixed at n=25 each day. Data from the previous 10 days indicate the following
number of out-of–state license plates:
Day
Out-of-state
Plates
1
6
2
4
3
5
4
7
5
8
6
3
7
4
8
5
9
3
10
11
(a) Calculate the overall proportion of “tourists” (cars with out–of–state plates) and the standard
deviation of proportions.
(b) Using ±3σ limits, calculate the LCL and UCL for these data.
(c) Is the process under control? Explain.
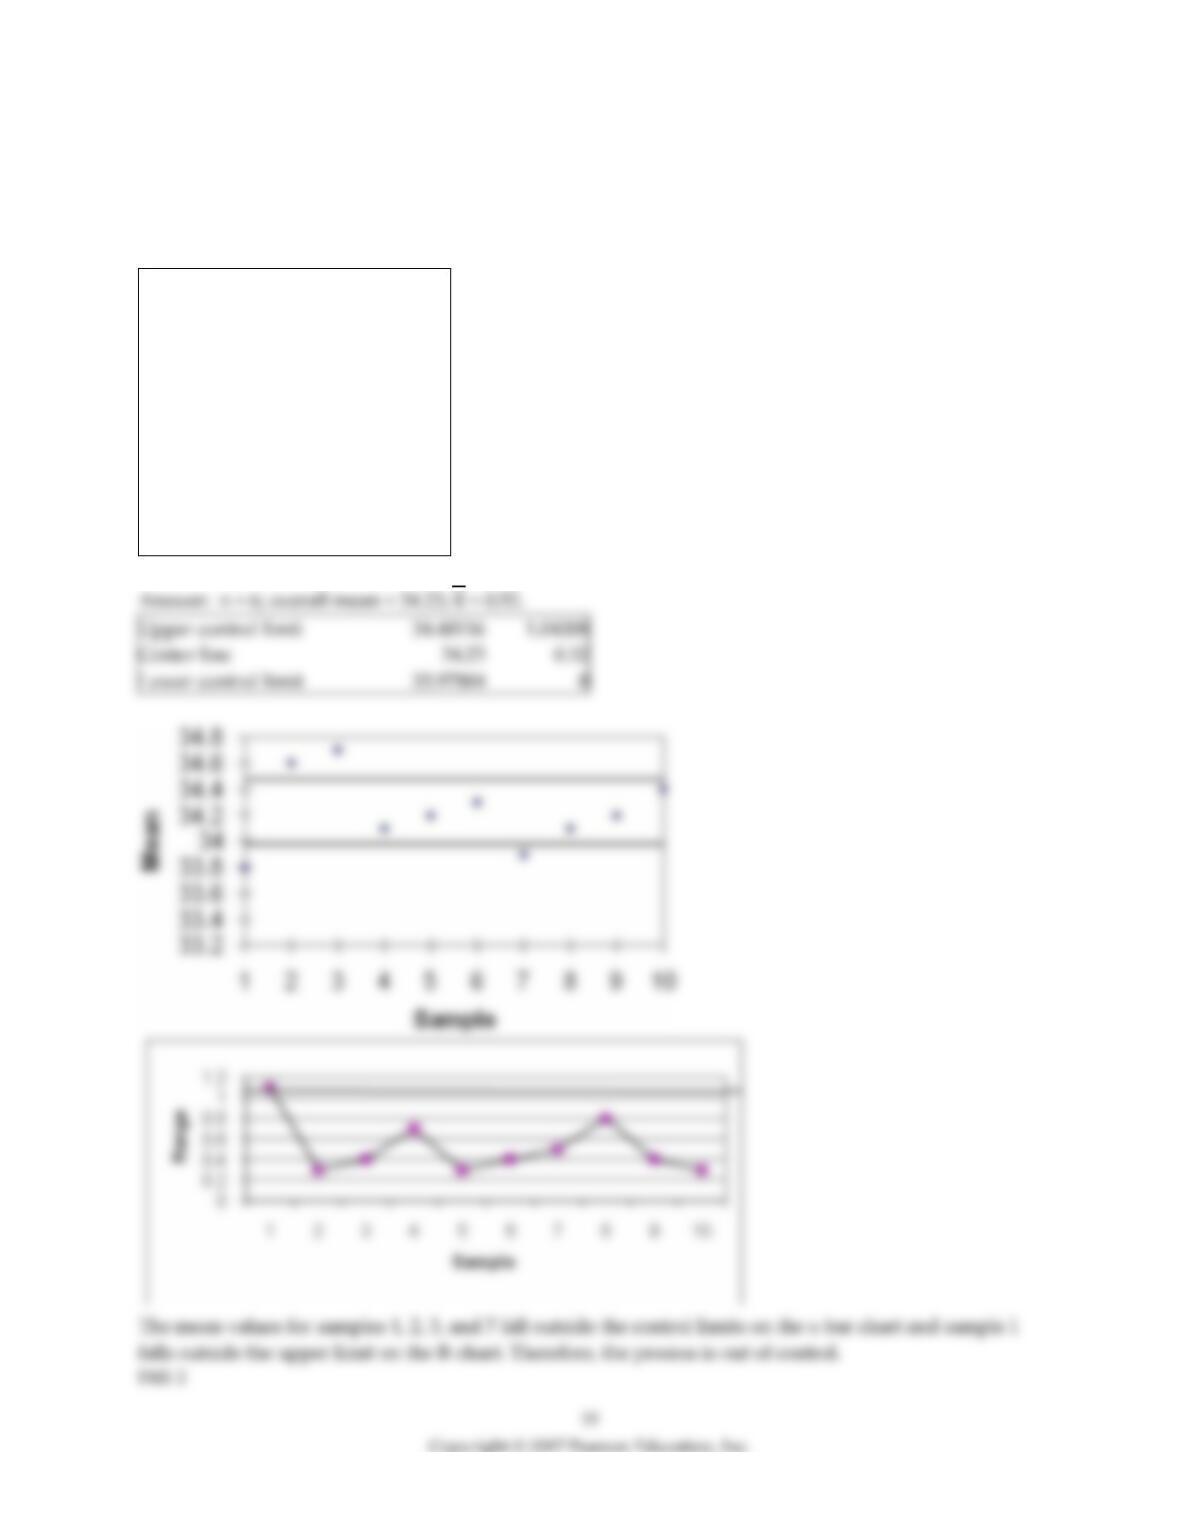
69) Cartons of Plaster of Paris are supposed to weigh exactly 32 oz. Inspectors want to develop process
control charts. They take ten samples of six boxes each and weigh them. Based on the following data,
compute the lower and upper control limits and determine whether the process is in control.
Sample
Mean
Range
1
33.8
1.1
2
34.6
0.3
3
34.7
0.4
4
34.1
0.7
5
34.2
0.3
6
34.3
0.4
7
33.9
0.5
8
34.1
0.8
9
34.2
0.4
10
34.4
0.3
Upper control limit
Center line
Lower control limit
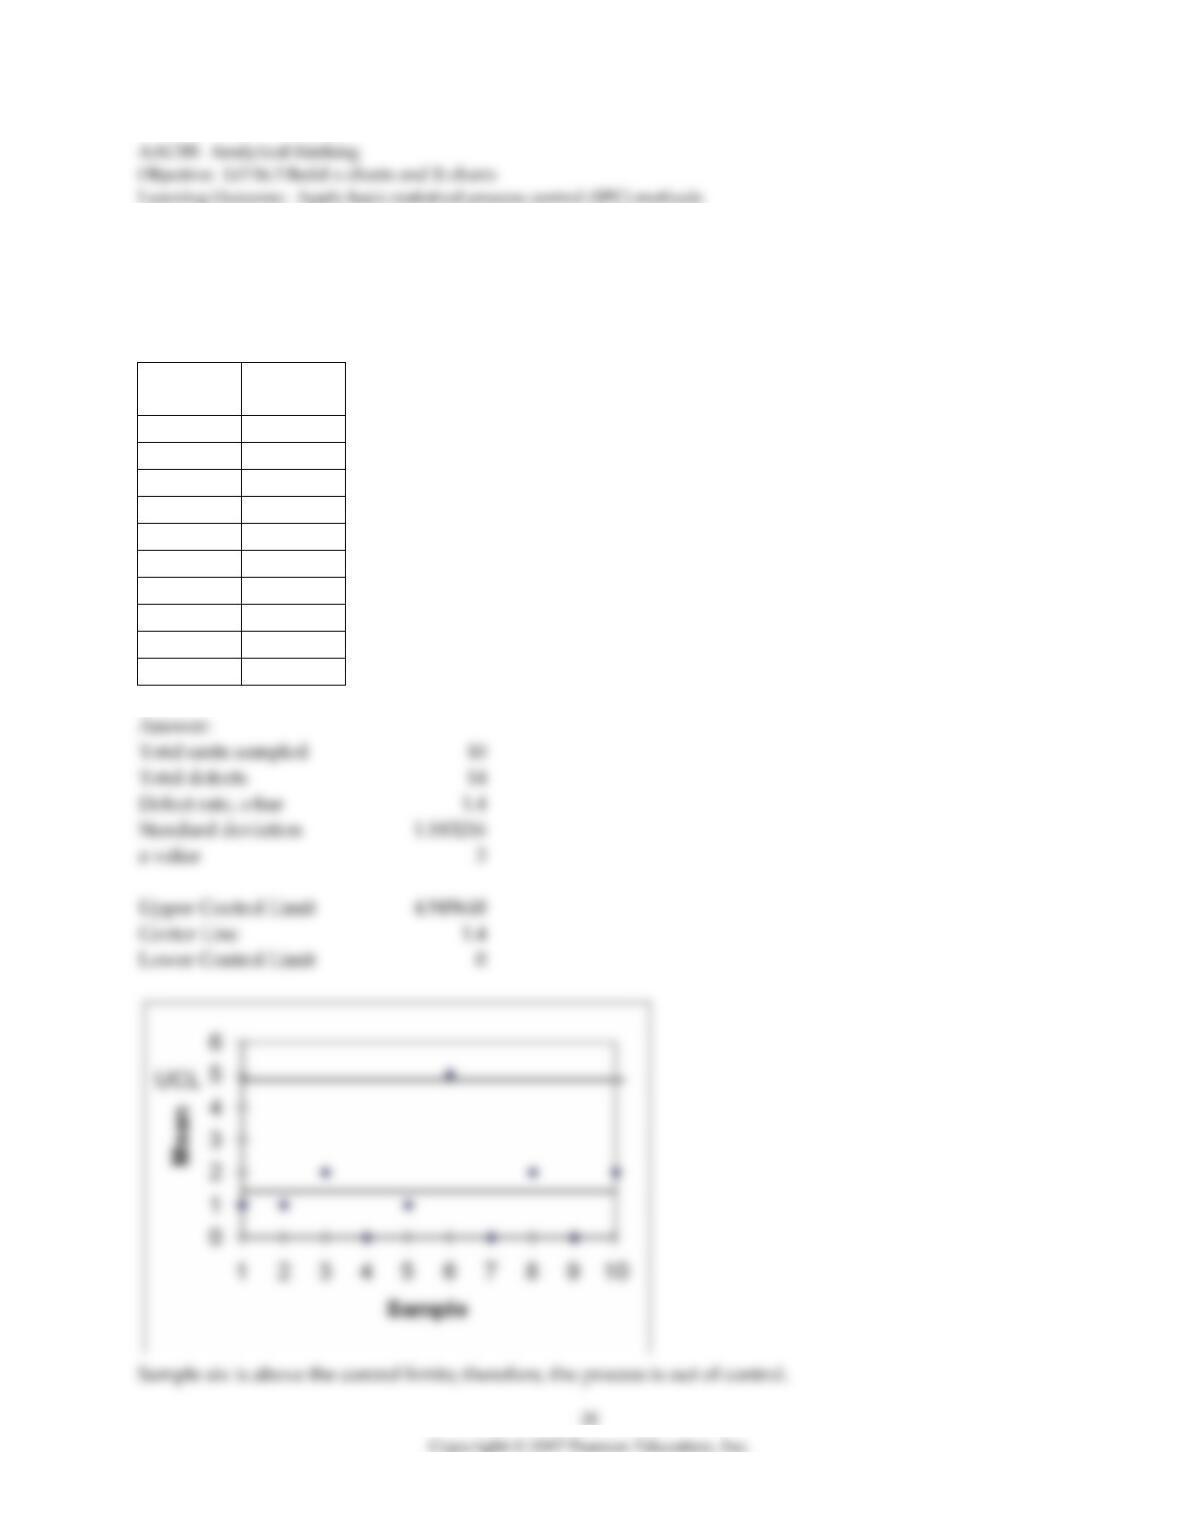
70) McDaniel Shipyards wants to develop a control chart to assess the quality of its steel plate. They take
ten sheets of 1″ steel plate and compute the number of cosmetic flaws on each roll. Each sheet is 20′ by
100′. Based on the following data, develop limits for the 3-sigma control chart, plot the control chart, and
determine whether the process is in control.
Sheet
Number of
flaws
1
1
2
1
3
2
4
0
5
1
6
5
7
0
8
2
9
0
10
2