39) What is the difference between conformance-oriented quality and target-oriented quality?
40) Identify the seven major concepts of TQM.
41) What is the quality loss function (QLF)?
1) Pareto charts are a graphical way of identifying the few critical items from the many less important
ones.
2) A cause-and-effect diagram helps identify the sources of a problem.
3) Pareto charts are used to:
A) identify inspection points in a process.
B) outline production schedules.
C) organize errors, problems, or defects.
D) show material flow.
E) show the range of values of a measurement and the frequency with which each value occurs.
4) The “four Ms” of cause-and-effect diagrams are:
A) material, machinery/equipment, manpower, and methods.
B) material, methods, men, and mental attitude.
C) named after four quality experts.
D) material, management, manpower, and motivation.
E) mentality, motivation, management, and manpower.
5) Among the tools of TQM, the tool ordinarily used to aid in understanding the sequence of events
through which a product travels is a:
A) Pareto chart.
B) flowchart.
C) check sheet.
D) Taguchi map.
E) poka-yoke.
6) The process improvement technique that sorts the vital few from the trivial many is:
A) Taguchi analysis.
B) Pareto analysis.
C) benchmarking.
D) Deming analysis.
E) Yamaguchi analysis.
7) A production manager at a pottery factory has noticed that about 70 percent of defects result from
impurities in raw materials, 15 percent result from human error, 10 percent from machine malfunctions,
and 5 percent from a variety of other causes. This manager is most likely using:
A) a Pareto chart.
B) a scatter diagram.
C) a quality loss function.
D) a cause-and-effect diagram.
E) a flowchart.
8) A customer service manager at a retail clothing store has collected numerous customer complaints
from the forms they fill out on merchandise returns. To analyze trends or patterns in these returns, she
has organized these complaints into a small number of sources or factors. This is most closely related to
the ________ tool of TQM.
A) quality loss function
B) cause-and-effect diagram
C) scatter diagram
D) histogram
E) process control chart
9) A fishbone chart is also known as a:
A) cause-and-effect diagram.
B) poka-yoke diagram.
C) Kaizen diagram.
D) Kanban diagram.
E) Taguchi diagram.
10) If a sample of parts is measured and the mean of the measurements is outside the control limits, the
process is:
A) in control, but not capable of producing within the established control limits.
B) out of control and the process should be investigated for assignable variation.
C) within the established control limits with only natural causes of variation.
D) monitored closely to see if the next sample mean will also fall outside the control limits.
E) none of the above.
11) A quality circle holds a brainstorming session and attempts to identify the factors responsible for
flaws in a product. Which tool do you suggest they use to organize their findings?
A) Ishikawa diagram
B) Pareto chart
C) flowchart
D) control charts
E) activity chart
12) When sample measurements falls inside the control limits, it means that:
A) each unit manufactured is good enough to sell.
B) the process limits cannot be determined statistically.
C) the process output exceeds the requirements.
D) if there is no other pattern in the samples, the process is in control.
E) the process output does not fulfill the requirements.
13) Which of the following is FALSE regarding control charts?
A) Values above the upper control limits imply that the product’s quality is exceeding expectations.
B) Control charts are built so that new data can be quickly compared to past performance data.
C) Control charts graphically present data.
D) Control charts plot data over time.
E) None of the above is false.
14) ________ diagrams use a schematic technique to discover possible locations of quality problems.
15) ________ are graphical presentations of data over time that show upper and lower control limits for
processes we want to control.
16) Explain how a Pareto chart can identify the most important causes of errors in a process.
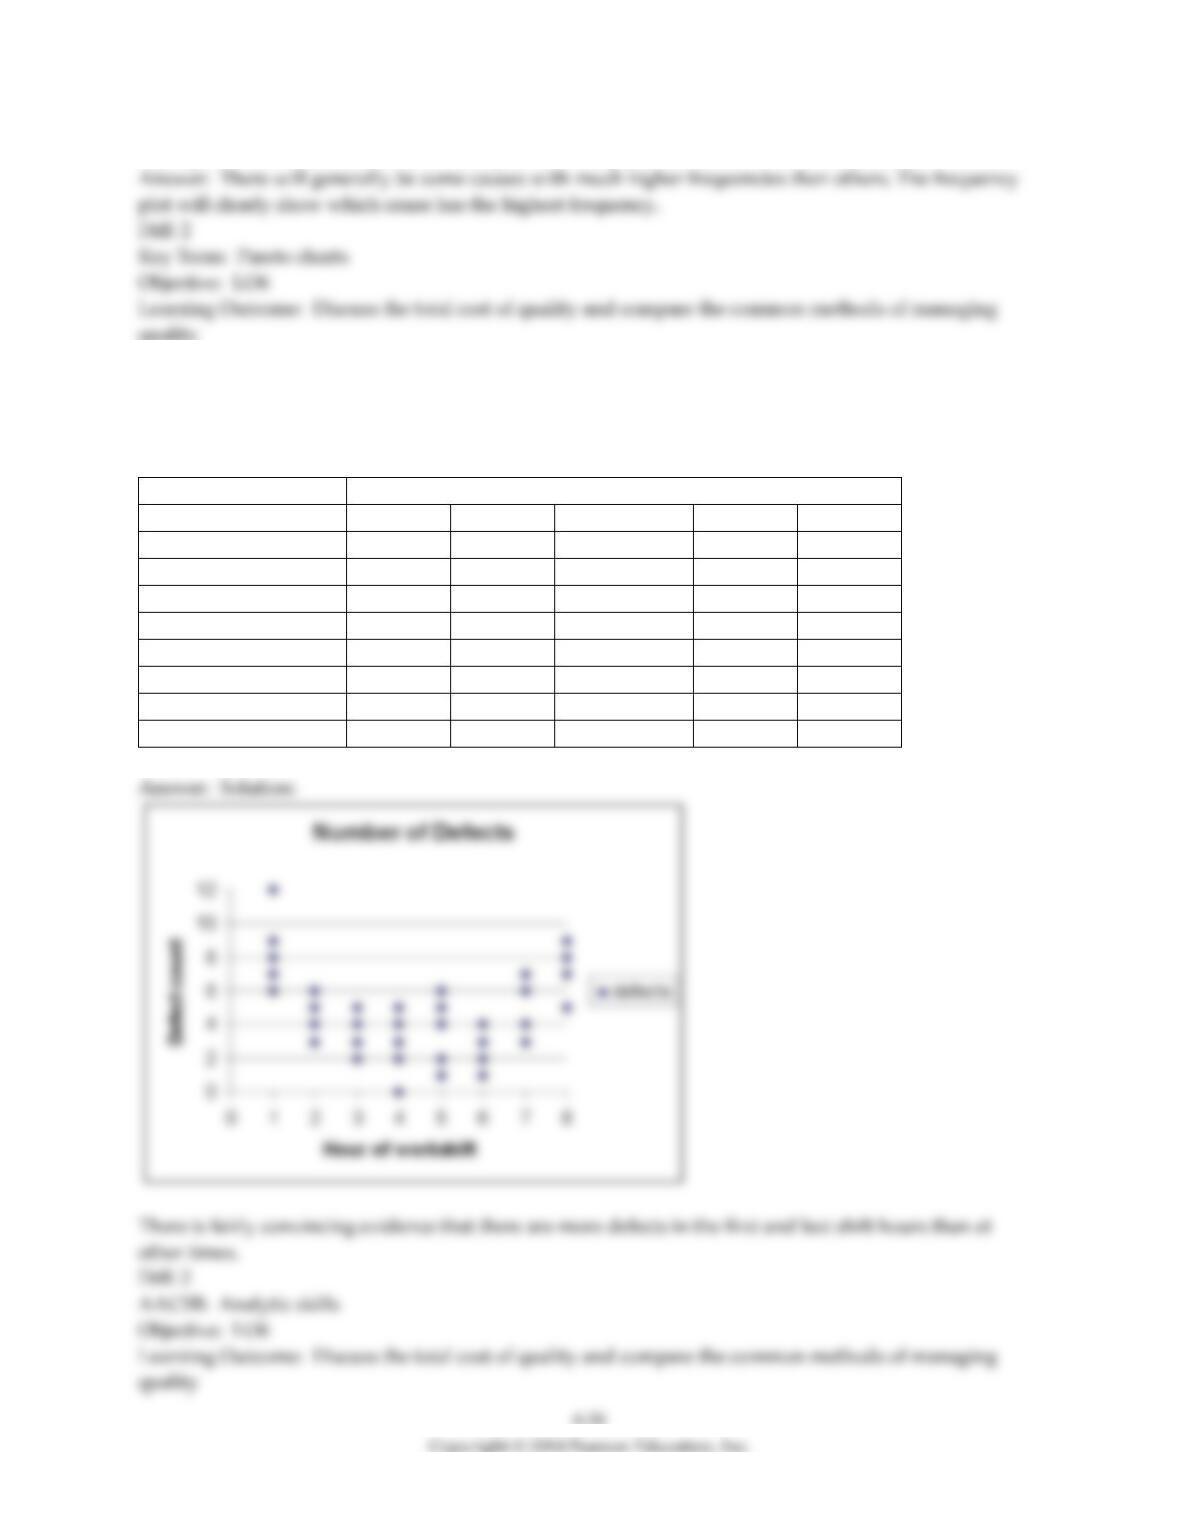
17) Management is concerned that workers create more product defects at the very beginning and end of
a work shift than at other times of their eight-hour workday. Construct a scatter diagram with the
following data collected last week. Is management justified in its belief?
Number of Defects
Monday
Tuesday
Wednesday
Thursday
Friday
First hour at work
12
9
6
8
7
Second hour at work
6
5
3
4
5
Third hour at work
5
2
4
3
3
Fourth hour at work
4
0
5
2
3
Fifth hour at work
1
6
2
4
5
Sixth hour at work
4
3
3
2
1
Seventh hour at work
7
4
4
6
3
Eighth hour at work
5
7
8
5
9
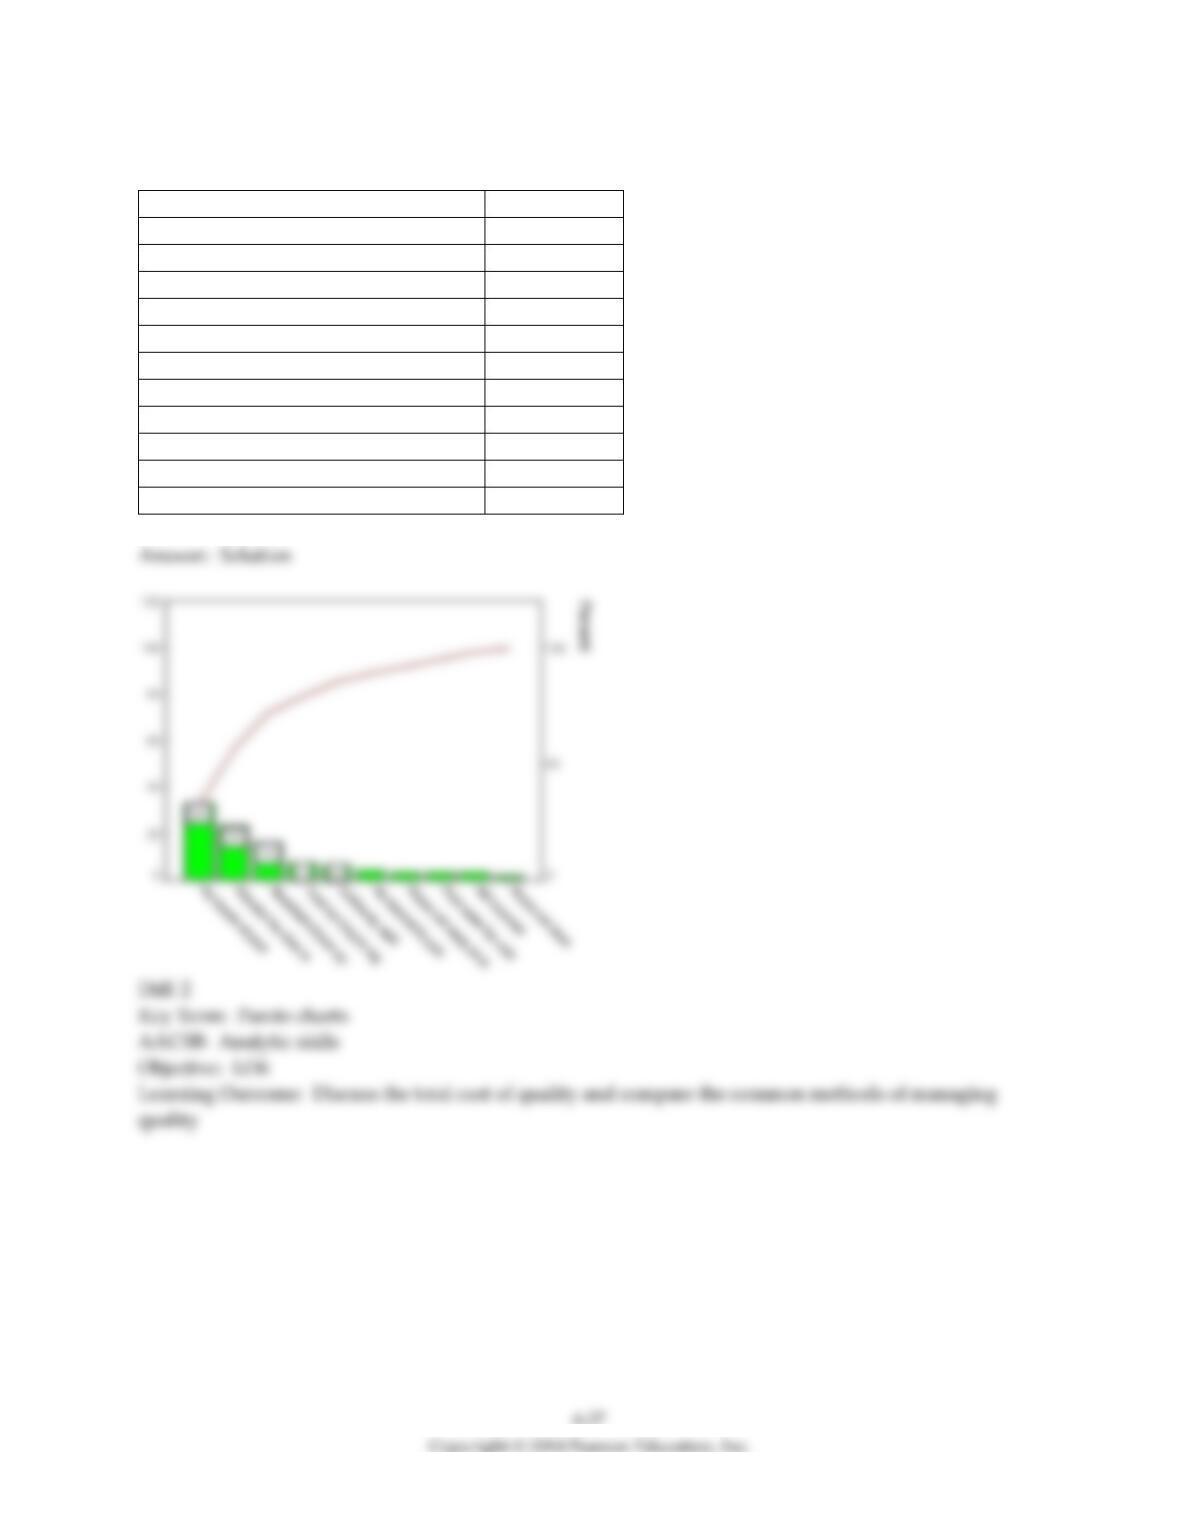
18) Perform a Pareto analysis on the following information:
Reason for unsatisfying stay at hotel
Frequency
Unfriendly staff
6
Room not clean
2
Room not ready at check–in
3
No towels at pool
33
No blanket for pull-out sofa
4
Pool water too cold
3
Breakfast of poor quality
16
Elevator too slow or not working
23
Took too long to register
7
Bill incorrect
3
Total
100
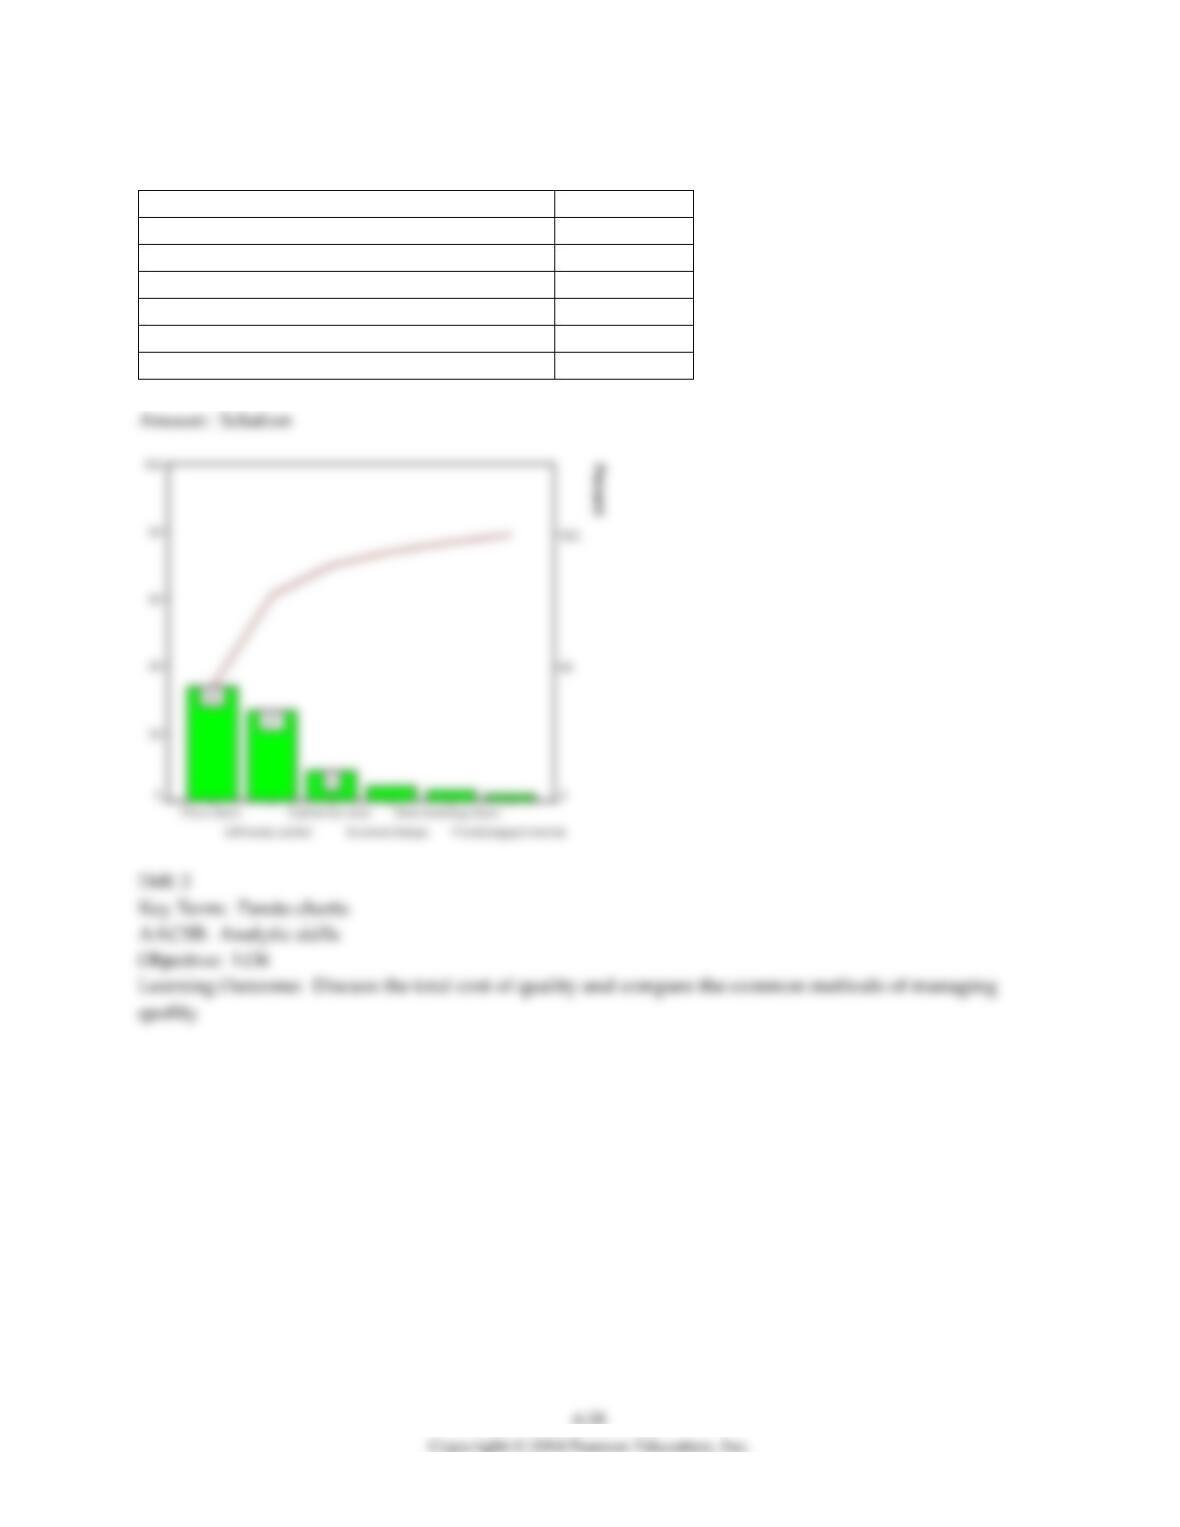
19) Perform a Pareto analysis on the following information:
Reason for unsatisfying check-out at store
Frequency
Unfriendly cashier
27
Incorrect change
4
Cashier too slow
9
Price check
34
Poorly bagged merchandise
2
Slow receiving check approval
3
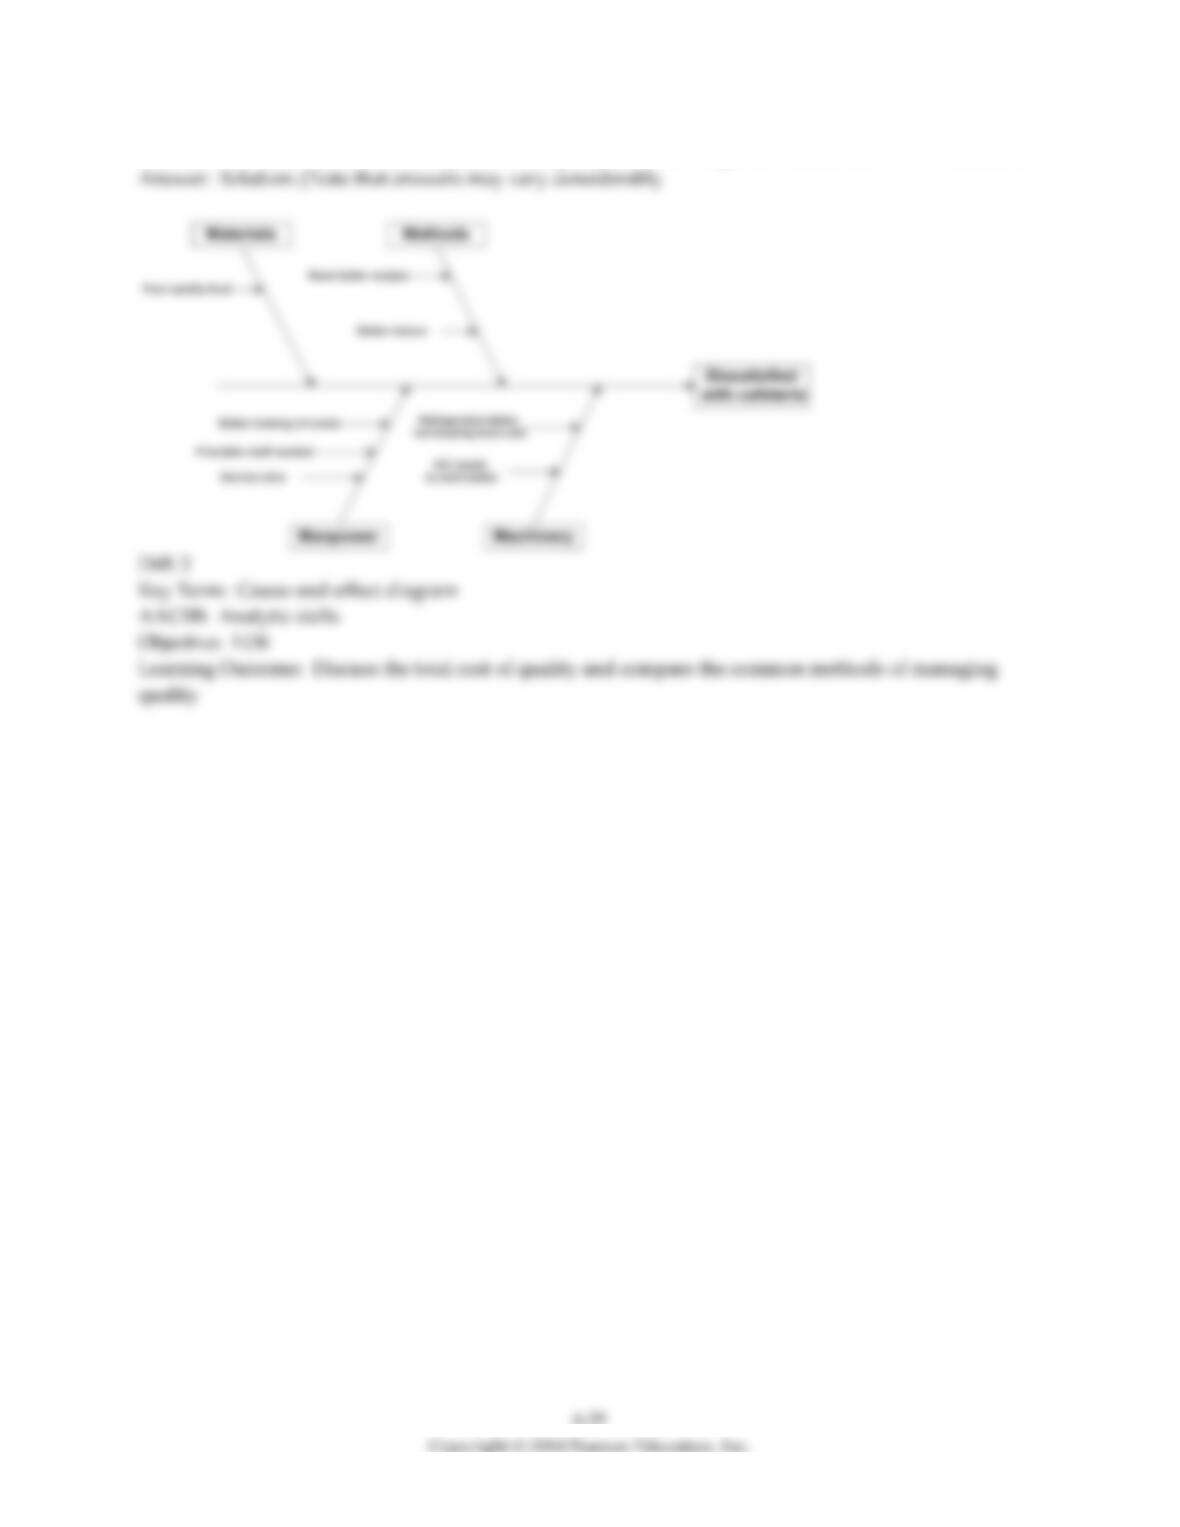
20) Construct a cause-and-effect diagram showing why a student might be dissatisfied with the cafeteria.
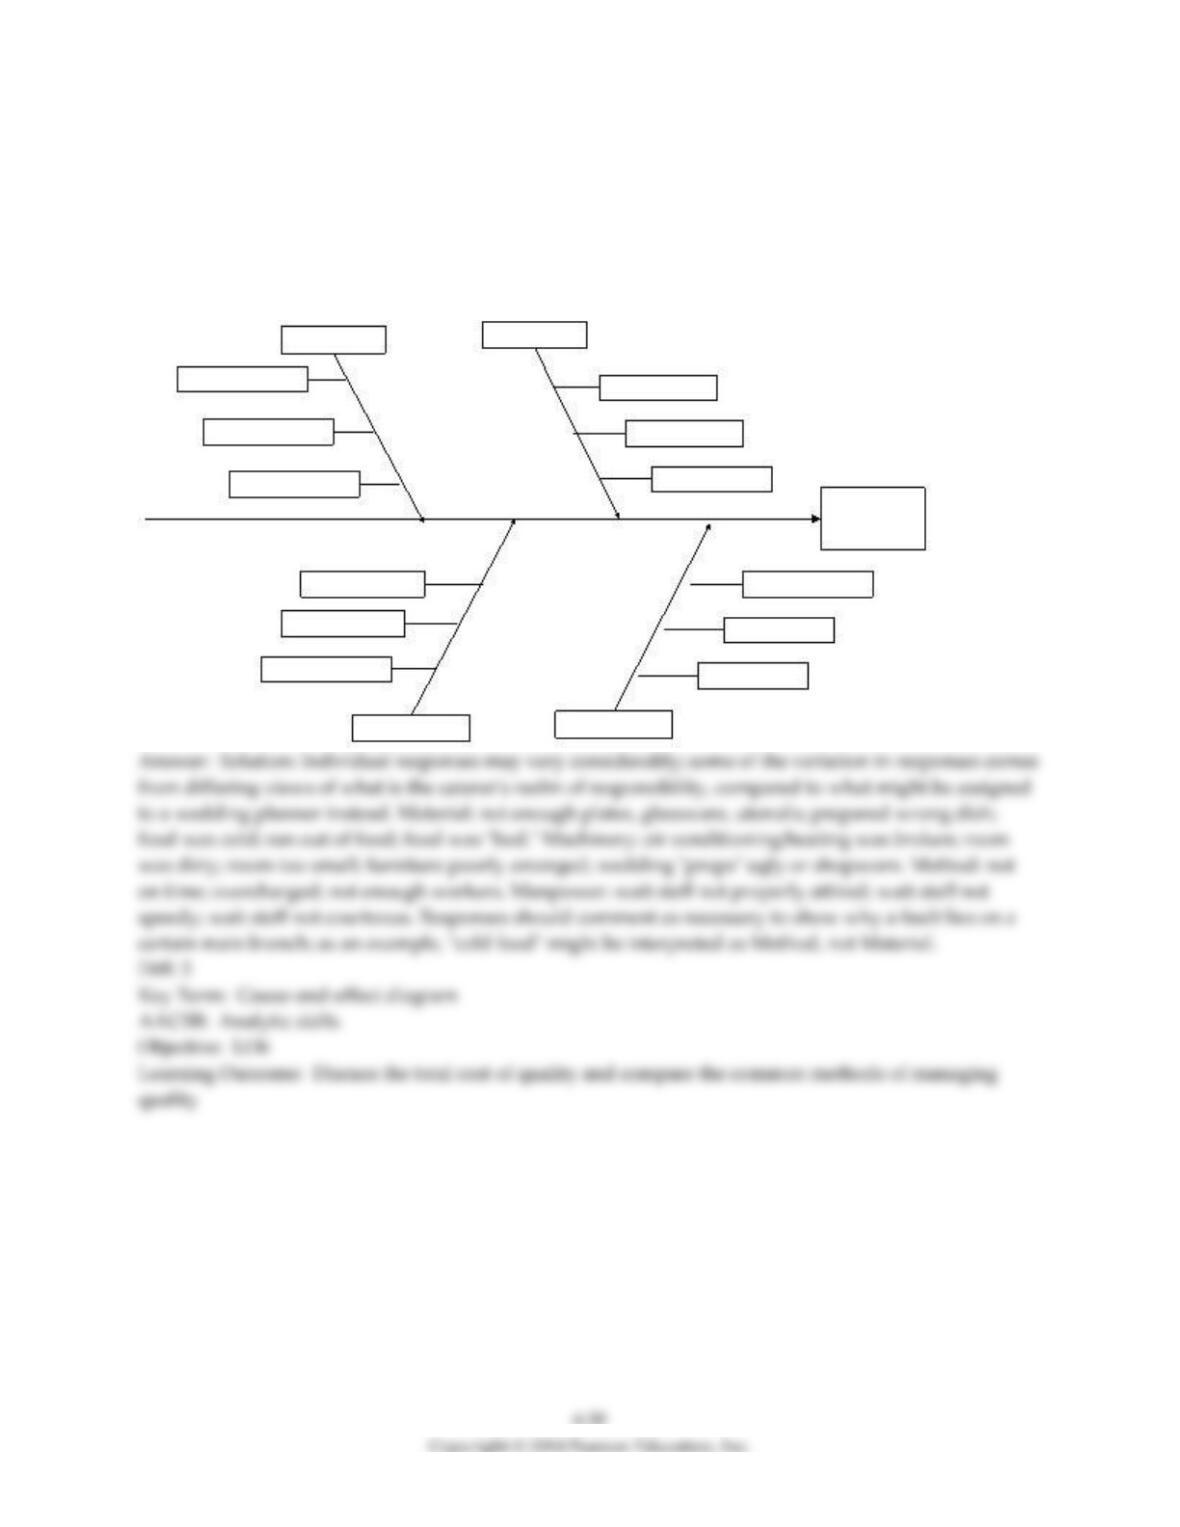
21) Pretend that you have just come from a relative’s wedding reception. It didn’t turn out as well as it
should have, and the bride’s parents are pretty mad at how things turned out. Use the supplied template
to construct a conventional cause-and-effect diagram. Identify twelve sources of defects for the issue
“dissatisfied customer of wedding reception caterer.” (Your dozen need not be exactly three per main
cause, but should be a balanced treatment.) Categorize each cause onto a main cause. Provide brief
support for each of your choices.
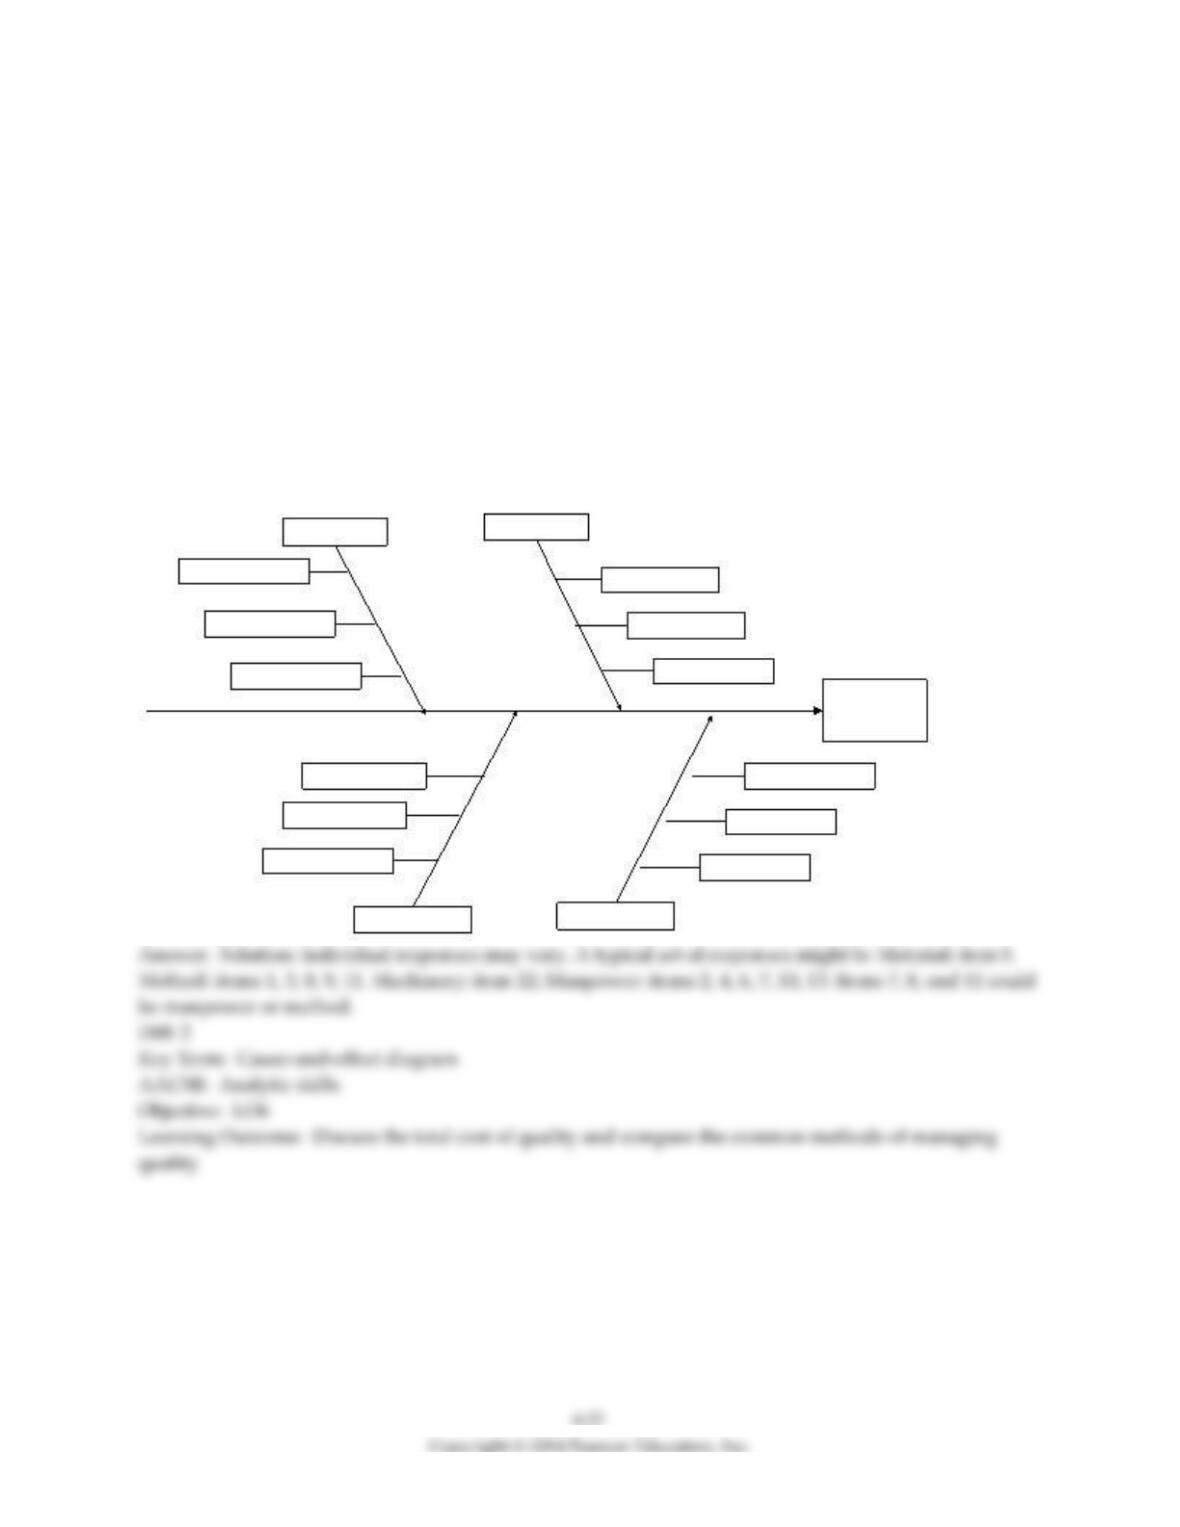
22) A refrigeration and heating company–one that installs and repairs home central air and heating
systems–has asked your advice on how to analyze their service quality. They have logged customer
complaints. Here’s a recent sampling. Use the supplied template to construct a conventional cause-and-
effect diagram. Place each of the complaints onto a main cause; justify your choice with a brief comment
as necessary. 1. “I was overcharged–your labor rates are too high.” 2. “The repairman left trash where he
was working.” 3. “You weren’t here when you said you would be. You should call when you must be
late.” 4. “Your repairman smoked in my house.”5. “The part you installed is not as good as the factory
original.” 6. “Your repairman was here for over two hours, but he wasn’t taking his work seriously.”7.
“You didn’t tighten some of the fittings properly–the system’s leaking.” 8. “Your estimate of repair costs
was WAY off.” 9. “I called you to do an annual inspection, but you’ve done more–work that I didn’t
authorize.”10. “Your mechanic is just changing parts–he doesn’t have a clue what’s really wrong.” 11.
“Your bill has only a total–I wanted to see detail billing.” 12. “Your testing equipment isn’t very new–are
you sure you’ve diagnosed the problem?”13. “One of the workmen tracked mud into my living room.”