Unlock document.
This document is partially blurred.
Unlock all pages and 1 million more documents.
Get Access
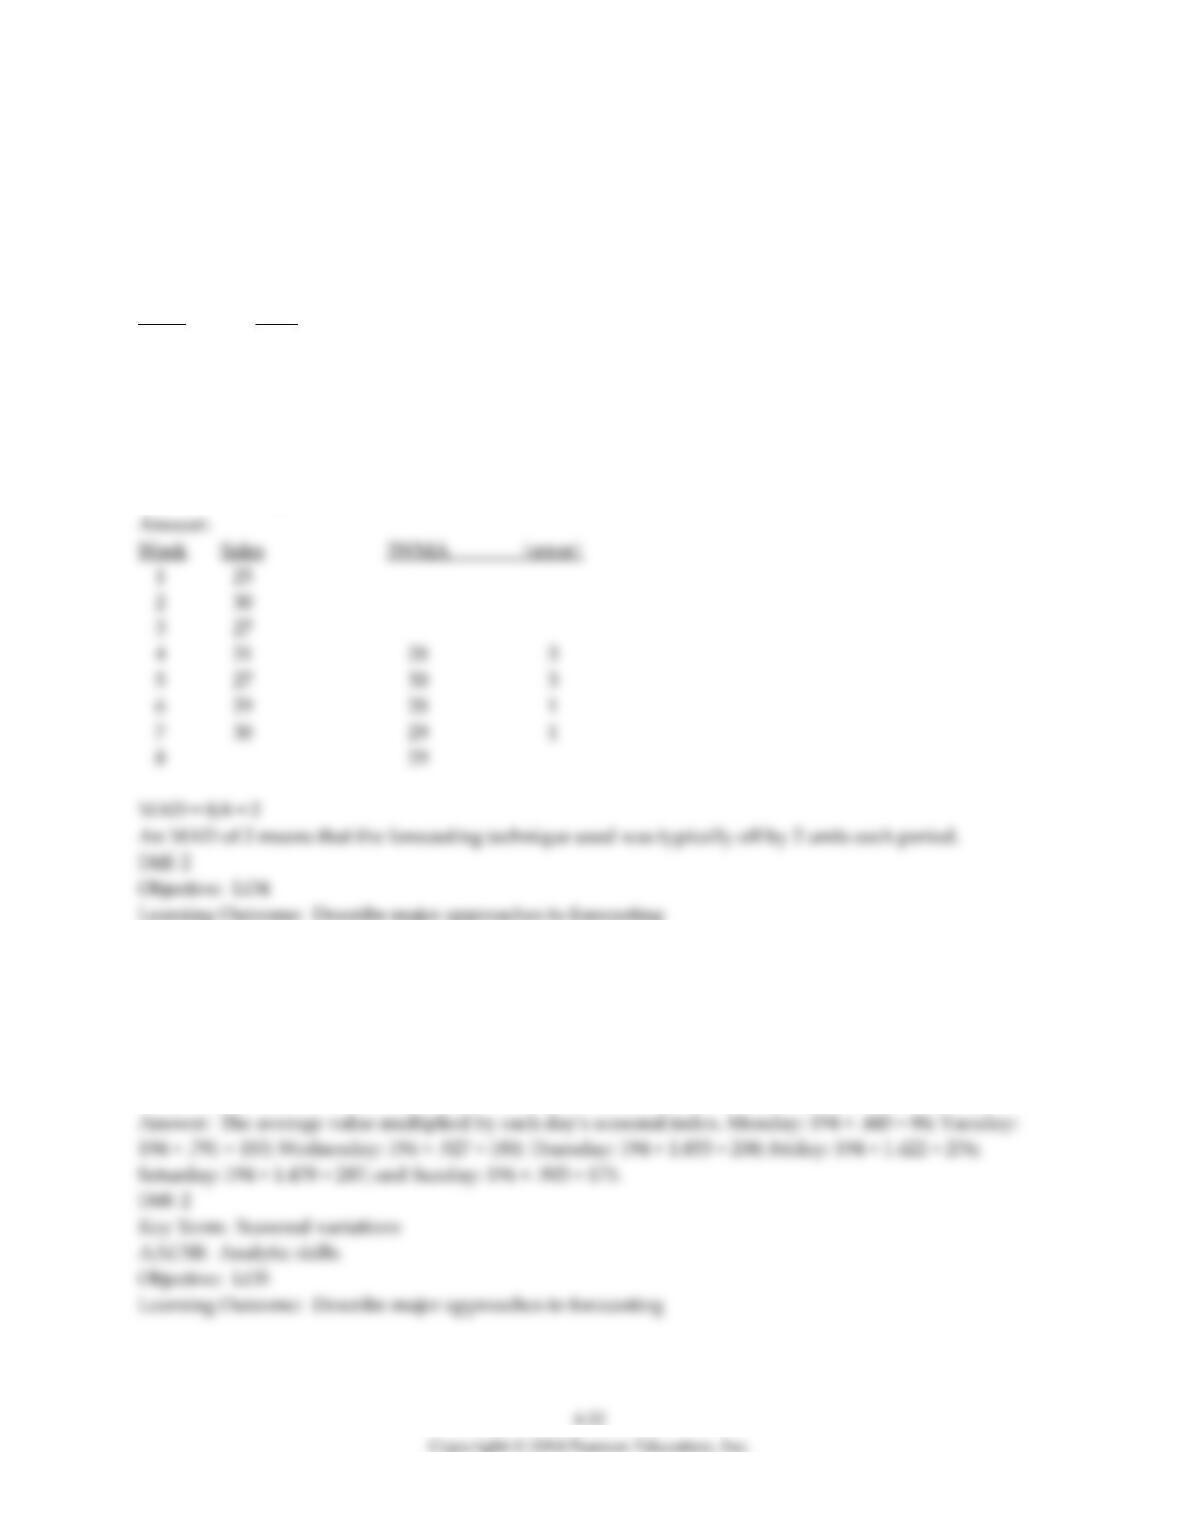
74) The last seven weeks of demand at a new car dealer are shown below. Use a three-period weighted-
moving average forecast to determine a forecast for the 8th week using weights of 3, 2, and 1 (where the
most recent week receives the highest weight). (Round all forecasts to the nearest whole unit.) Calculate
the MAD for this forecast (covering all weeks in which error comparisons can be made). What does the
MAD indicate?
Week Sales
1 25
2 30
3 27
4 31
5 27
6 29
7 30
75) A small family-owned restaurant uses a seven-day moving average model to determine manpower
requirements. These forecasts need to be seasonalized because each day of the week has its own demand
pattern. The seasonal indices for each day of the week are: Monday 0.445; Tuesday 0.791; Wednesday
0.927; Thursday 1.033; Friday 1.422; Saturday 1.478; and Sunday 0.903. Average daily demand based on
the most recent moving average is 194 patrons. What is the seasonalized forecast for each day of next
week?
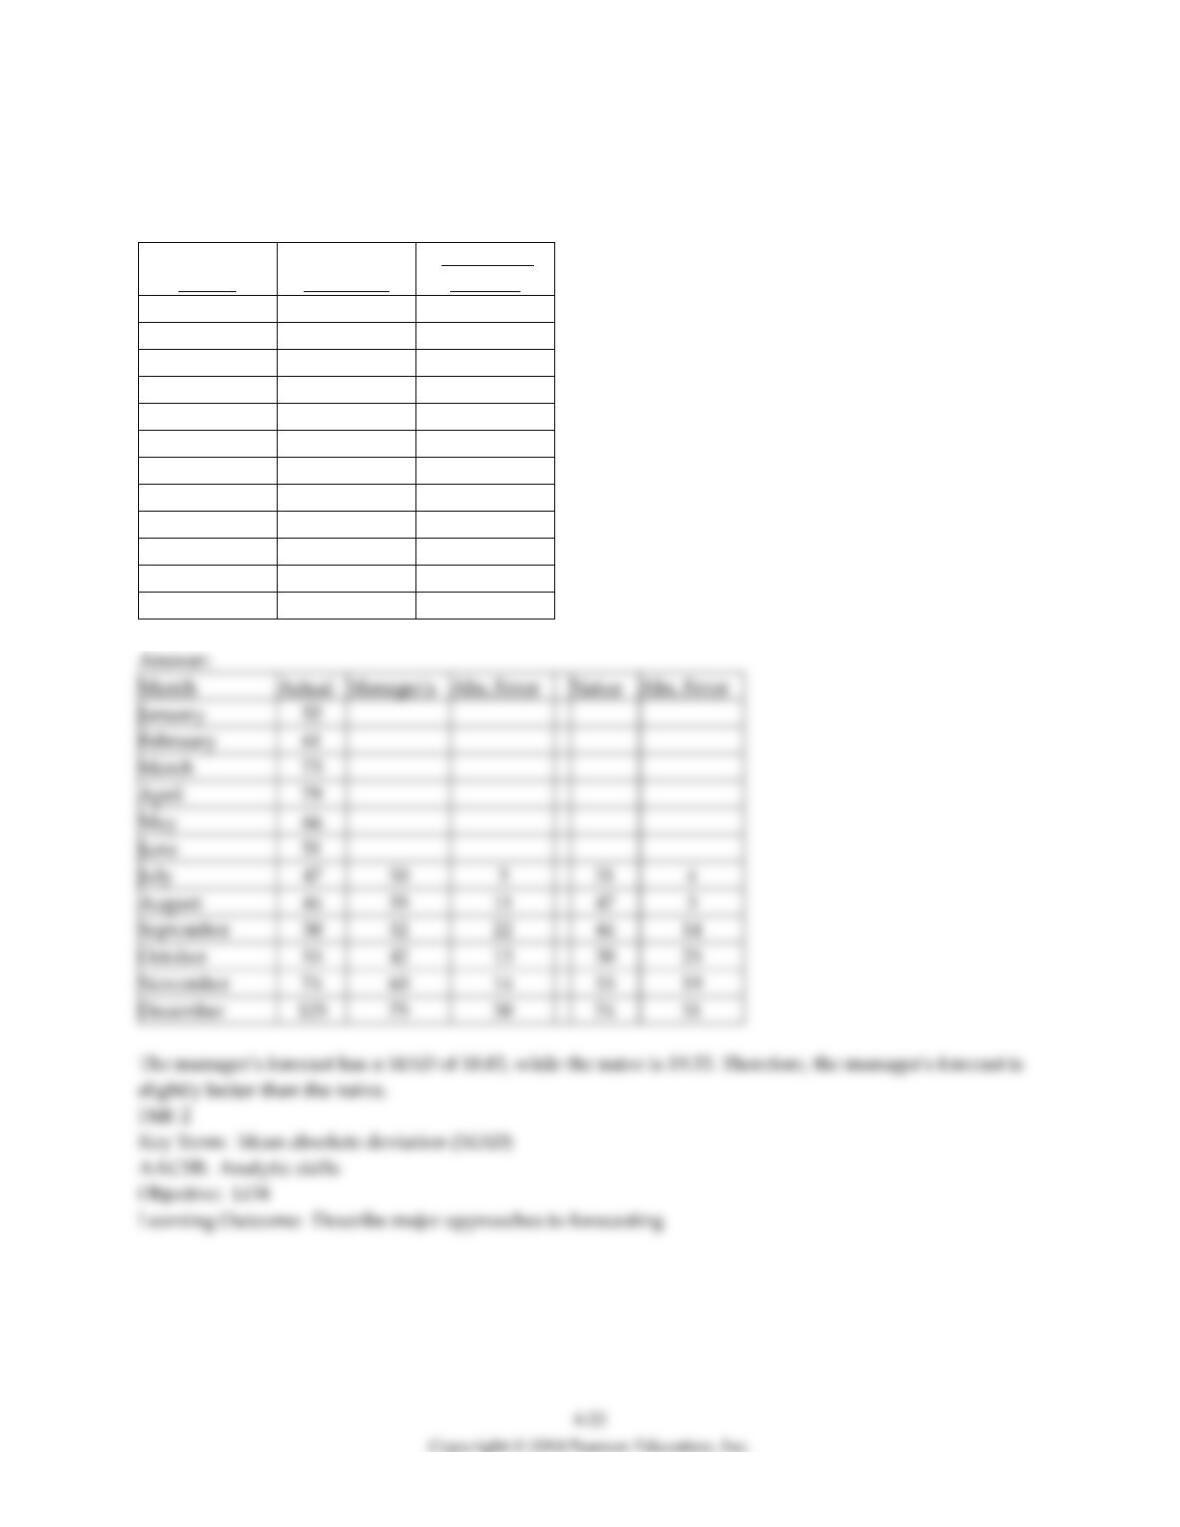
76) The department manager using a combination of methods has forecast sales of toasters at a local
department store. Calculate the MAD for the manager's forecast. Compare the manager's forecast against
a naive forecast covering the same time period. Which is better?
Month
Unit Sales
Manager's
Forecast
January
52
February
61
March
73
April
79
May
66
June
51
July
47
50
August
44
55
September
30
52
October
55
42
November
74
60
December
125
75
Section 6 Associative Forecasting Methods: Regression and Correlation Analysis
1) Linear-regression analysis is a straight-line mathematical model to describe the functional relationships
between independent and dependent variables.
2) The larger the standard error of the estimate, the more accurate the forecasting model.
3) In a regression equation where y-hat is demand and x is advertising, a coefficient of determination (R2)
of .70 means that 70% of the variance in advertising is explained by demand.
4) Regression lines graphically depict "cause-and-effect" relationships.
5) A fundamental distinction between trend projection and linear regression is that:
A) trend projection uses least squares while linear regression does not.
B) only linear regression can have a negative slope.
C) in trend projection the independent variable is time; in linear regression the independent variable need
not be time, but can be any variable with explanatory power.
D) trend projection can be a function of several variables, while linear regression can only be a function of
one variable.
E) trend projection uses two smoothing constants, not just one.
6) The degree or strength of a relationship between two variables is shown by the:
A) alpha.
B) mean.
C) mean absolute deviation.
D) coefficient of correlation.
E) cumulative error.
7) If two variables were perfectly correlated, what would the coefficient of correlation r equal?
A) 0
B) -1
C) 1
D) B or C
E) none of the above
8) Linear regression is known as a(n) ________ model because it incorporates variables or factors that
might influence the quantity being forecast.
9) The ________ measures the strength of the relationship between two variables.
10) Distinguish a dependent variable from an independent variable.
11) Explain, in your own words, the meaning of the coefficient of determination.
12) A firm has modeled its experience with industrial accidents and found that the number of accidents
per year (y-hat) is related to the number of employees (x) by the regression equation:
y-hat = 3.3 + 0.049x. The r-squared value is 0.68. The regression is based on 20 annual observations. The
firm intends to employ 480 workers next year. How many accidents do you project? How much
confidence do you have in that forecast?
13) An innovative restaurateur owns and operates a dozen "Ultimate Low-Carb" restaurants in northern
Arkansas. His signature item is a cheese-encrusted beef medallion wrapped in lettuce. Sales (x, in
millions of dollars) is related to Profits (y-hat, in hundreds of thousands of dollars) by the regression
equation y-hat = 8.21 + 0.76 x. What is your forecast of profit for a store with sales of $40 million? $50
million?
14) Arnold Tofu owns and operates a chain of 12 vegetable protein "hamburger" restaurants in northern
Louisiana. Sales figures and profits for the stores are provided in the table below. Sales are given in
millions of dollars; profits are in hundreds of thousands of dollars. Calculate a regression line for the
data. What is your forecast of profit for a store with sales of $24 million? $30 million?
Store
Profits
Sales
1
14
6
2
11
3
3
15
5
4
16
5
5
24
15
6
28
18
7
22
17
8
21
12
9
26
15
10
43
20
11
34
14
12
9
5
Section 7 Monitoring and Controlling Forecasts
1) If a forecast is consistently greater than (or less than) actual values, the forecast is said to be biased.
2) Focus forecasting tries a variety of computer models and selects the best one for a particular
application.
3) The last four weekly values of sales were 80, 100, 105, and 90 units. The last four forecasts were 60, 80,
95, and 75 units. These forecasts illustrate:
A) qualitative methods.
B) adaptive smoothing.
C) slope.
D) bias.
E) trend projection.
4) The tracking signal is the:
A) standard error of the estimate.
B) absolute deviation of the last period's forecast.
C) MAD.
D) ratio of cumulative error / MAD.
E) MAPE.
5) Computer monitoring of tracking signals and self-adjustment if a signal passes a preset limit is
characteristic of:
A) exponential smoothing including trend.
B) adaptive smoothing.
C) trend projection.
D) focus forecasting.
E) multiple regression analysis.
6) ________ forecasting tries a variety of computer models and selects the best one for a particular
application.
7) An approach to exponential smoothing in which the smoothing constant is automatically changed to
keep errors to a minimum is called ________.
8) What is a tracking signal? Explain the connection between adaptive smoothing and tracking signals.
9) What is focus forecasting?
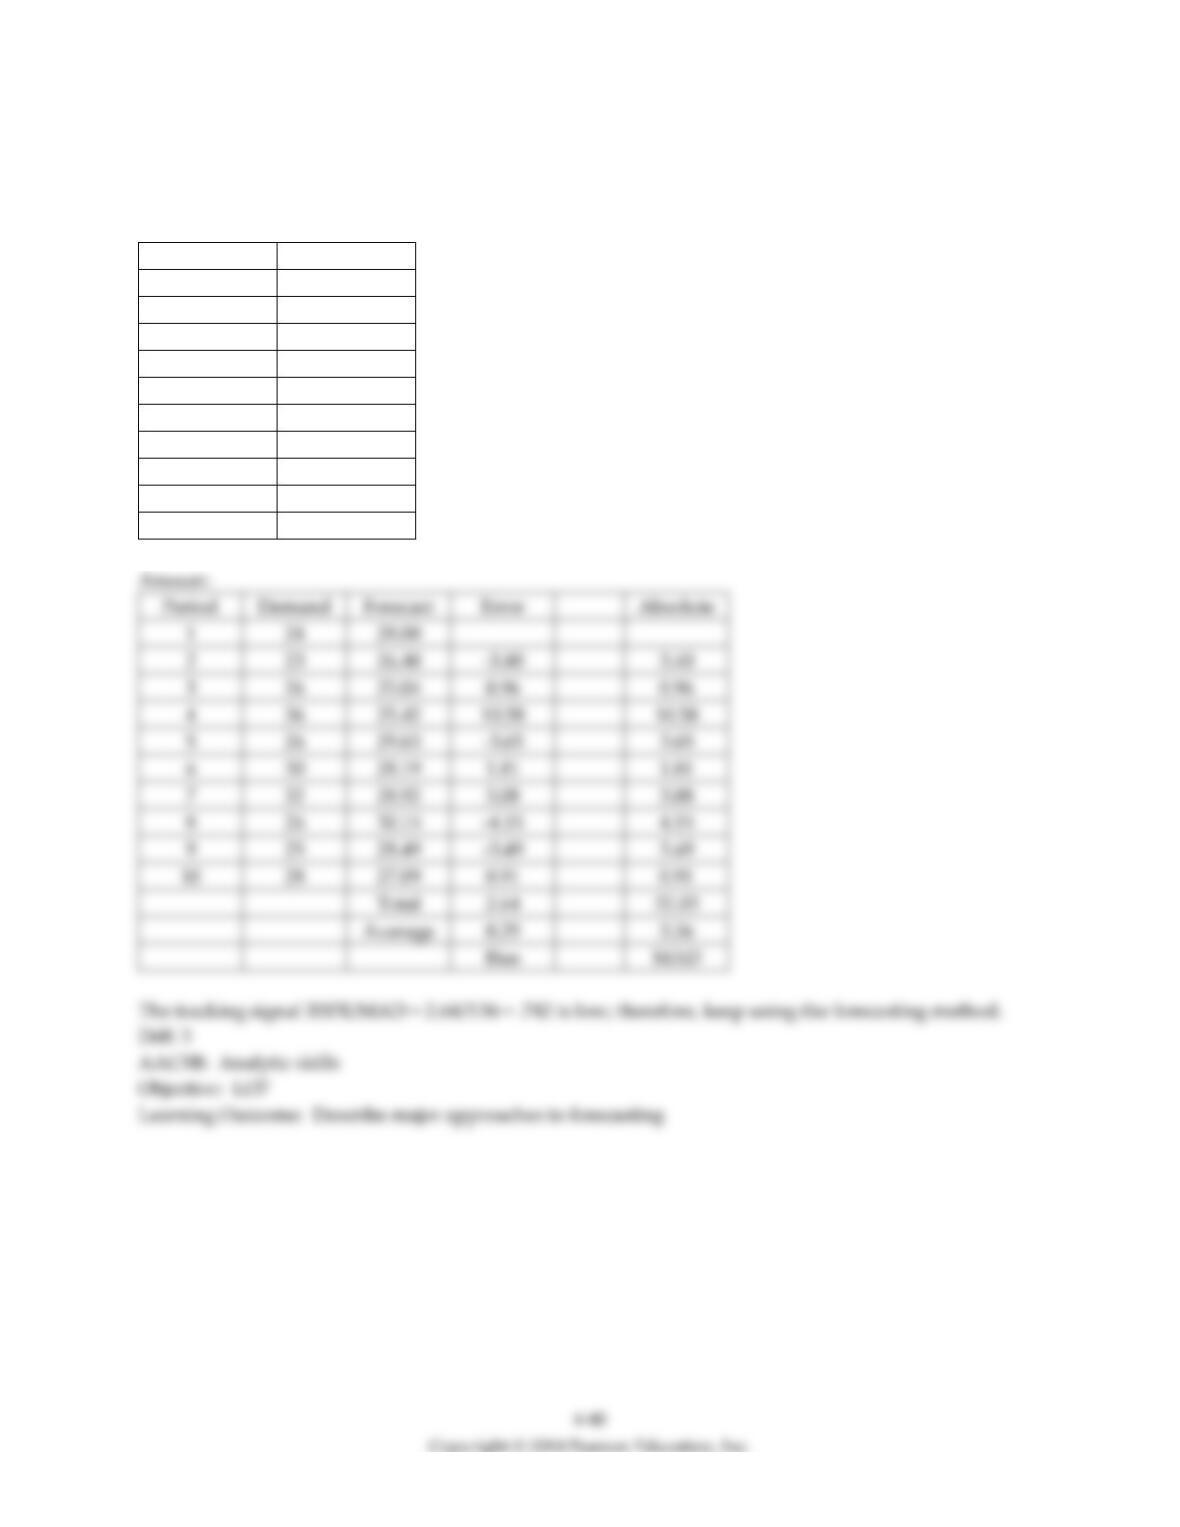
10) Jim's department at a local department store has tracked the sales of a product over the last ten weeks.
Forecast demand using exponential smoothing with an alpha of 0.4, and an initial forecast of 28.0 for
period 1. Calculate the MAD. Calculate the tracking signal. What do you recommend?
Period
Demand
1
24
2
23
3
26
4
36
5
26
6
30
7
32
8
26
9
25
10
28
Section 8 Forecasting in the Service Sector
1) Many services maintain records of sales noting:
A) the day of the week.
B) unusual events.
C) the weather.
D) holiday impacts.
E) all of the above.
2) Taco Bell's unique employee scheduling practices are partly the result of using:
A) point-of-sale computers to track food sales in 15 minute intervals.
B) focus forecasting.
C) a six-week moving average forecasting technique.
D) multiple regression.
E) A and C are both correct.


