47) When one constant is used to smooth the forecast average and a second constant is used to smooth the
trend, the forecasting method is ________.
48) ________ is a time-series forecasting method that fits a trend line to a series of historical data points
and then projects the line into the future for forecasts.
49) Simple ________ forecasts only work well if we can assume that market demands will stay fairly
steady over time.
50) If a barbershop operator noted that Tuesday’s business was typically twice as heavy as Wednesday’s,
and that Friday’s business was typically the busiest of the week, business at the barbershop is subject to
________.
51) Identify the four components of a time series. Which one of these is rarely forecast? Why is this so?
52) Compare seasonal effects and cyclical effects.
53) Distinguish between a weighted moving average model and an exponential smoothing model.
54) Describe three popular measures of forecast accuracy.
55) Give an example, other than a restaurant or other food-service firm, of an organization that
experiences an hourly seasonal pattern. (That is, each hour of the day has a pattern that tends to repeat
day after day.) Explain.
56) Explain the role of regression models (time series and otherwise) in forecasting. That is, how is trend
projection able to forecast? How is regression used for causal forecasting?
57) Identify two advantages of the moving average forecasting model. Identify two disadvantages of the
moving average forecasting model.
58) What does it mean to “decompose” a time series?
59) What is the key difference between weighted moving average and simple moving average approaches
to forecasting?
60) Weekly sales of ten-grain bread at the local organic food market are provided in the table below.
Based on these data, forecast week 9 using a five-week moving average.
Week Sales
1 415
2 389
3 420
4 382
5 410
6 432
7 405
8 421
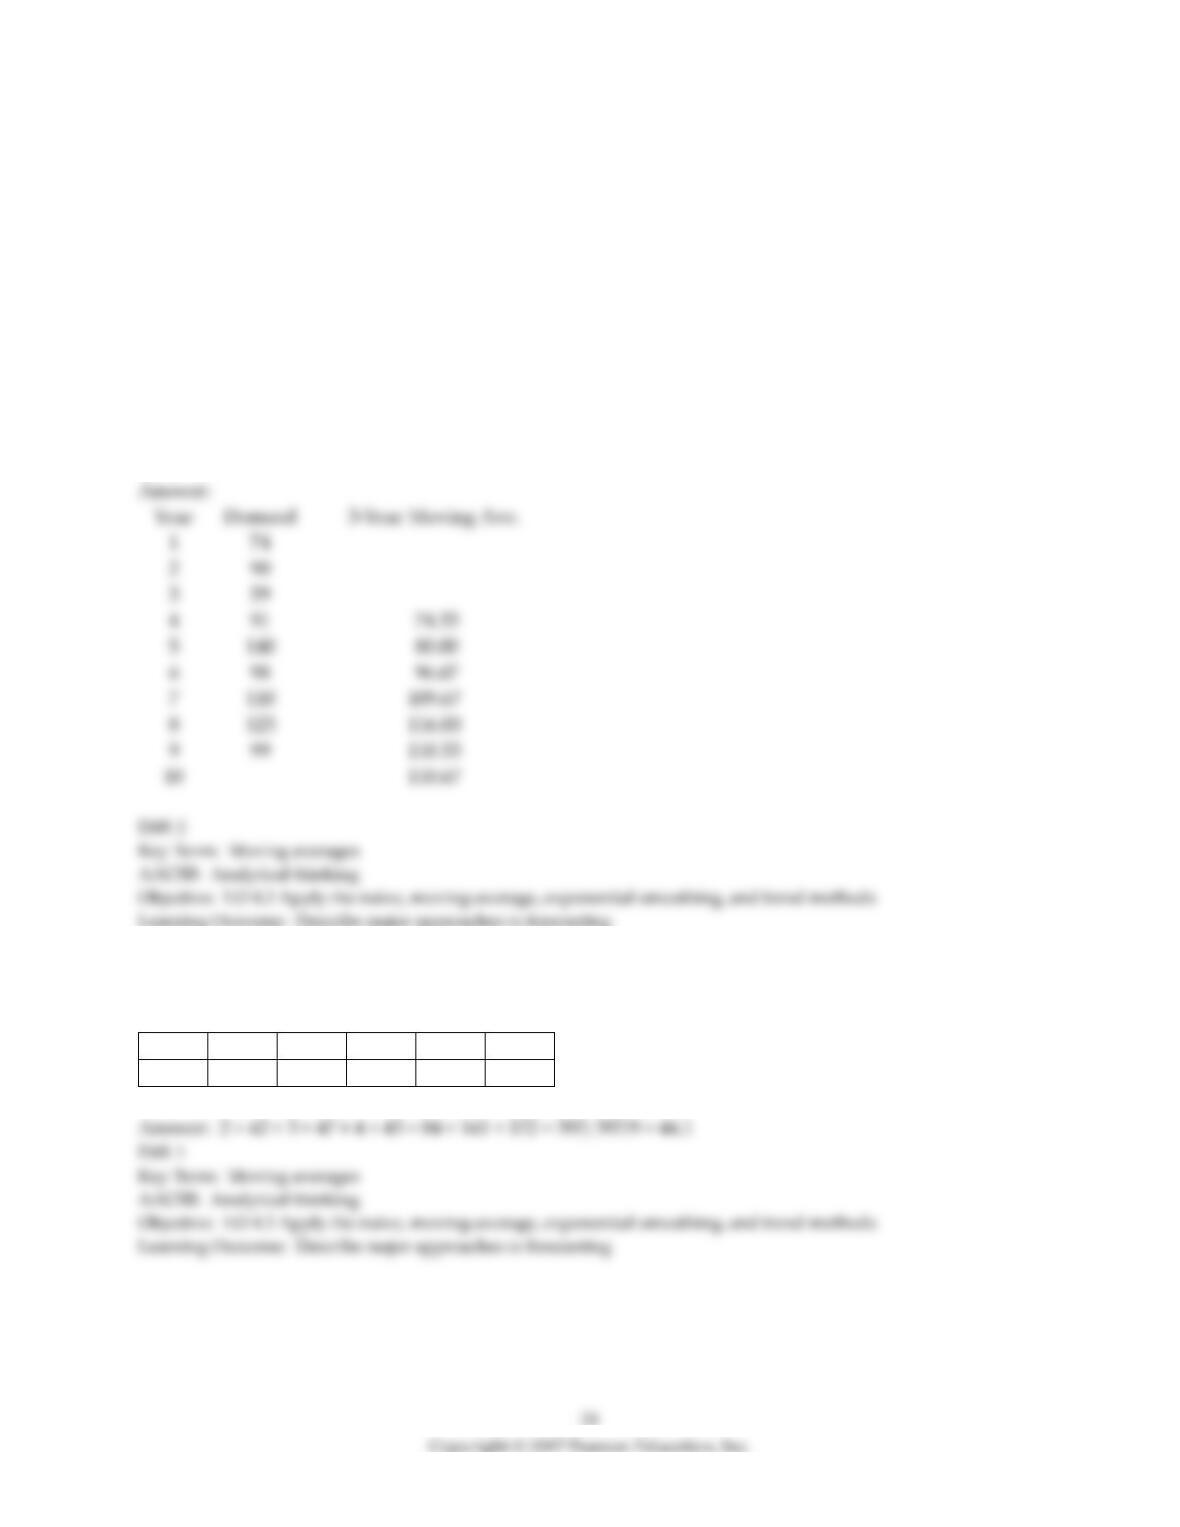
61) Given the following data, calculate the three-year moving averages for years 4 through 10.
Year
Demand
1
74
2
90
3
59
4
91
5
140
6
98
7
110
8
123
9
99
62) What is the forecast for May based on a weighted moving average applied to the following past
demand data and using the weights: 4, 3, 2 (largest weight is for most recent data)?
Nov.
Dec.
Jan.
Feb.
Mar.
April
37
36
40
42
47
43
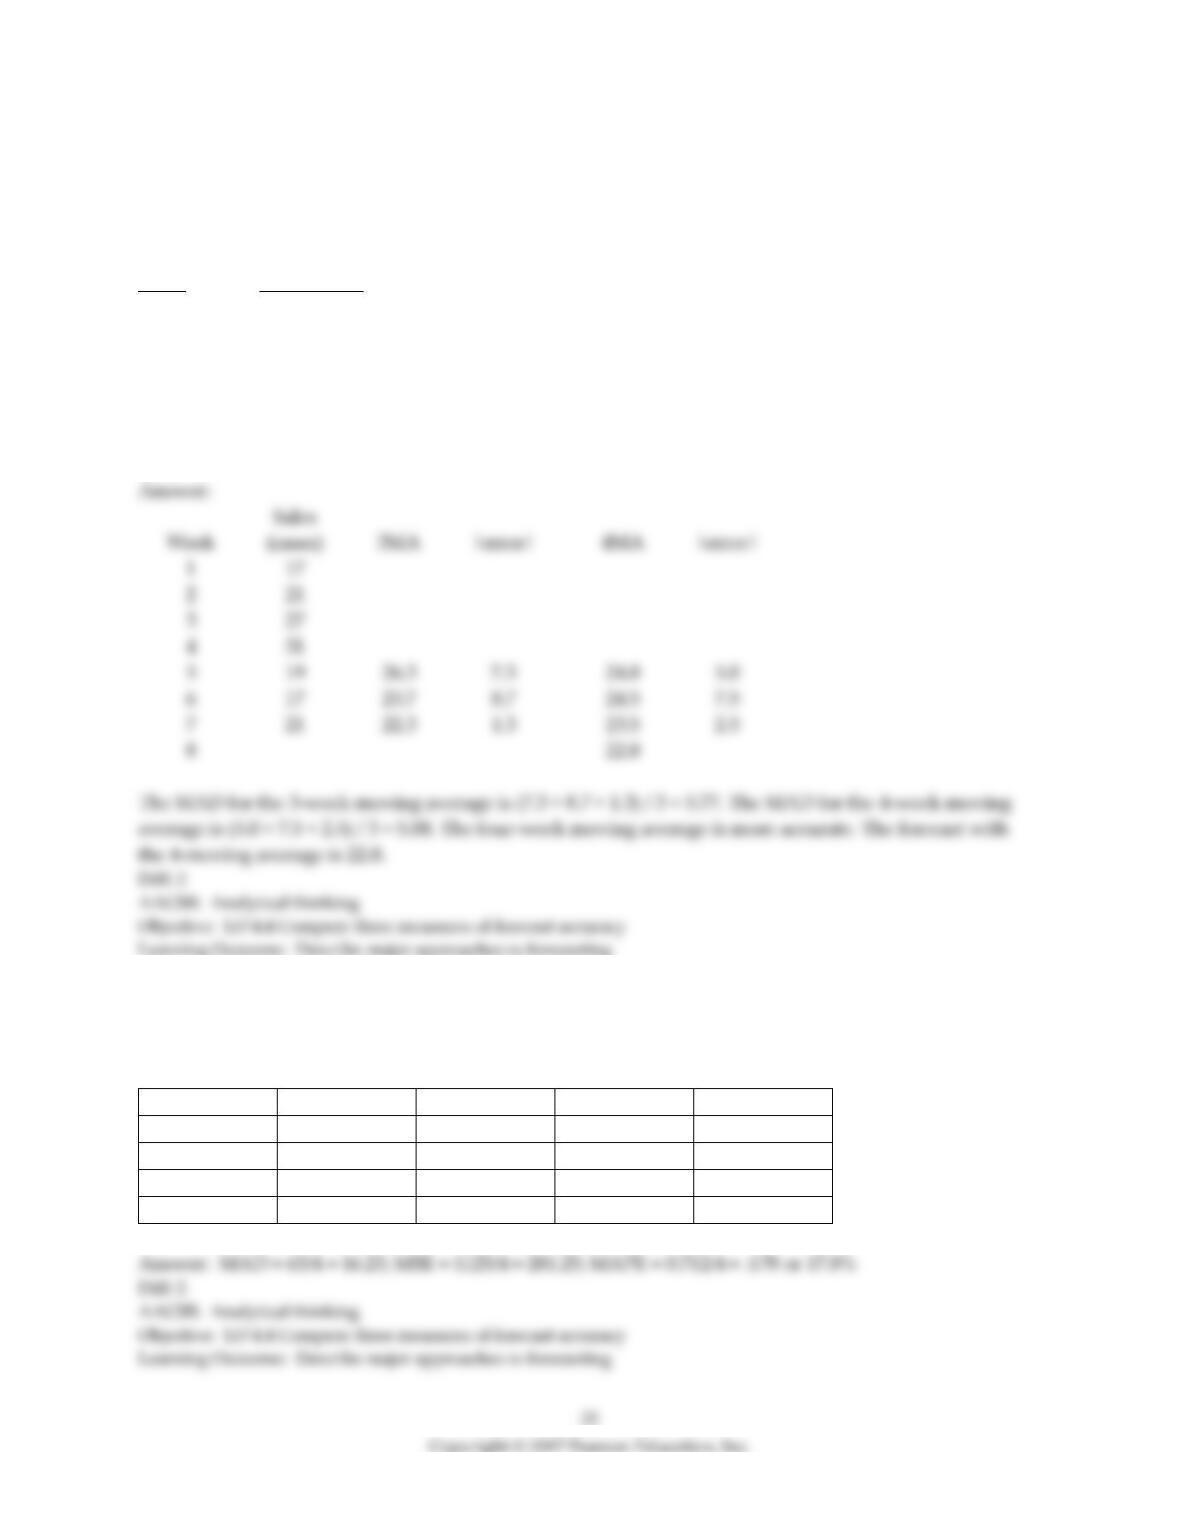
63) Weekly sales of copy paper at Cubicle Suppliers are provided in the table below. Compute a three–
period moving average and a four-period moving average for weeks 5, 6, and 7. Compute the MAD for
both forecasting methods. Which model is more accurate? Forecast week 8 with the more accurate
method.
Week Sales (cases)
1 17
2 21
3 27
4 31
5 19
6 17
7 21
1
3
5
6
8
64) The last four weekly values of sales were 80, 100, 105, and 90 units, respectively. The last four
forecasts (for the same four weeks) were 60, 80, 95, and 75 units, respectively. Calculate the MAD, MSE,
and MAPE for these four weeks.
Sales
Forecast
Error
Error squared
Pct. error
80
60
20
400
.25
100
80
20
400
.20
105
95
10
100
.095
90
75
15
225
.167
65) A management analyst is using exponential smoothing to predict merchandise returns at an upscale
branch of a department store chain. Given an actual number of returns of 154 items in the most recent
period completed, a forecast of 172 items for that period, and a smoothing constant of 0.3, what is the
forecast for the next period? How would the forecast be changed if the smoothing constant were 0.6?
Explain the difference in terms of alpha and responsiveness.
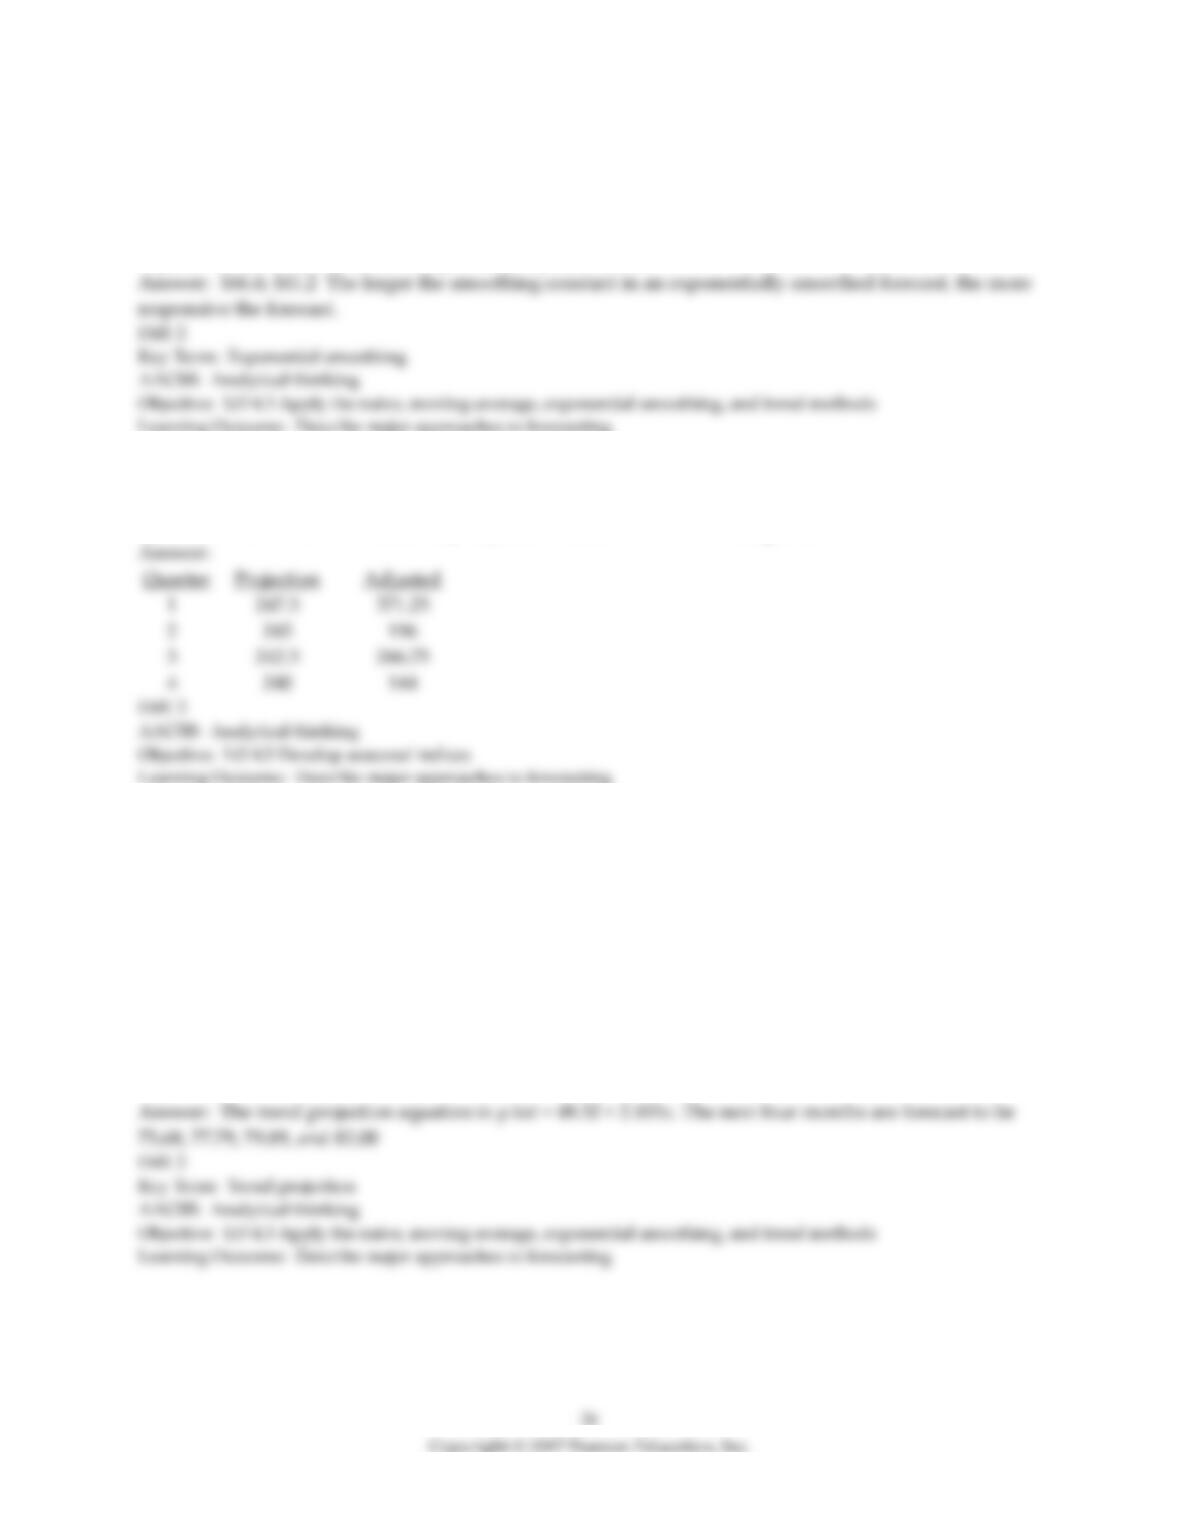
66) The following trend projection is used to predict quarterly demand: y-hat = 250 – 2.5x, where x = 1 in
the first quarter. Seasonal (quarterly) indices are Quarter 1 = 1.5; Quarter 2 = 0.8; Quarter 3 = 1.1; and
Quarter 4 = 0.6. What is the seasonally adjusted forecast for the next four quarters?
67) Favors Distribution Company purchases small imported trinkets in bulk, packages them, and sells
them to retail stores. The managers are conducting an inventory control study of all their items. The
following data are for one such item, which is not seasonal.
a. Use a trend projection to estimate the relationship between time and sales (state the equation).
b. Calculate forecasts for the first four months of the next year.
1
2
3
4
5
6
7
8
9
10
11
12
Month
Jan
Feb
Mar
Apr
May
Jun
Jul
Aug
Sep
Oct
Nov
Dec
Sales
51
55
54
57
50
68
66
59
67
69
75
73
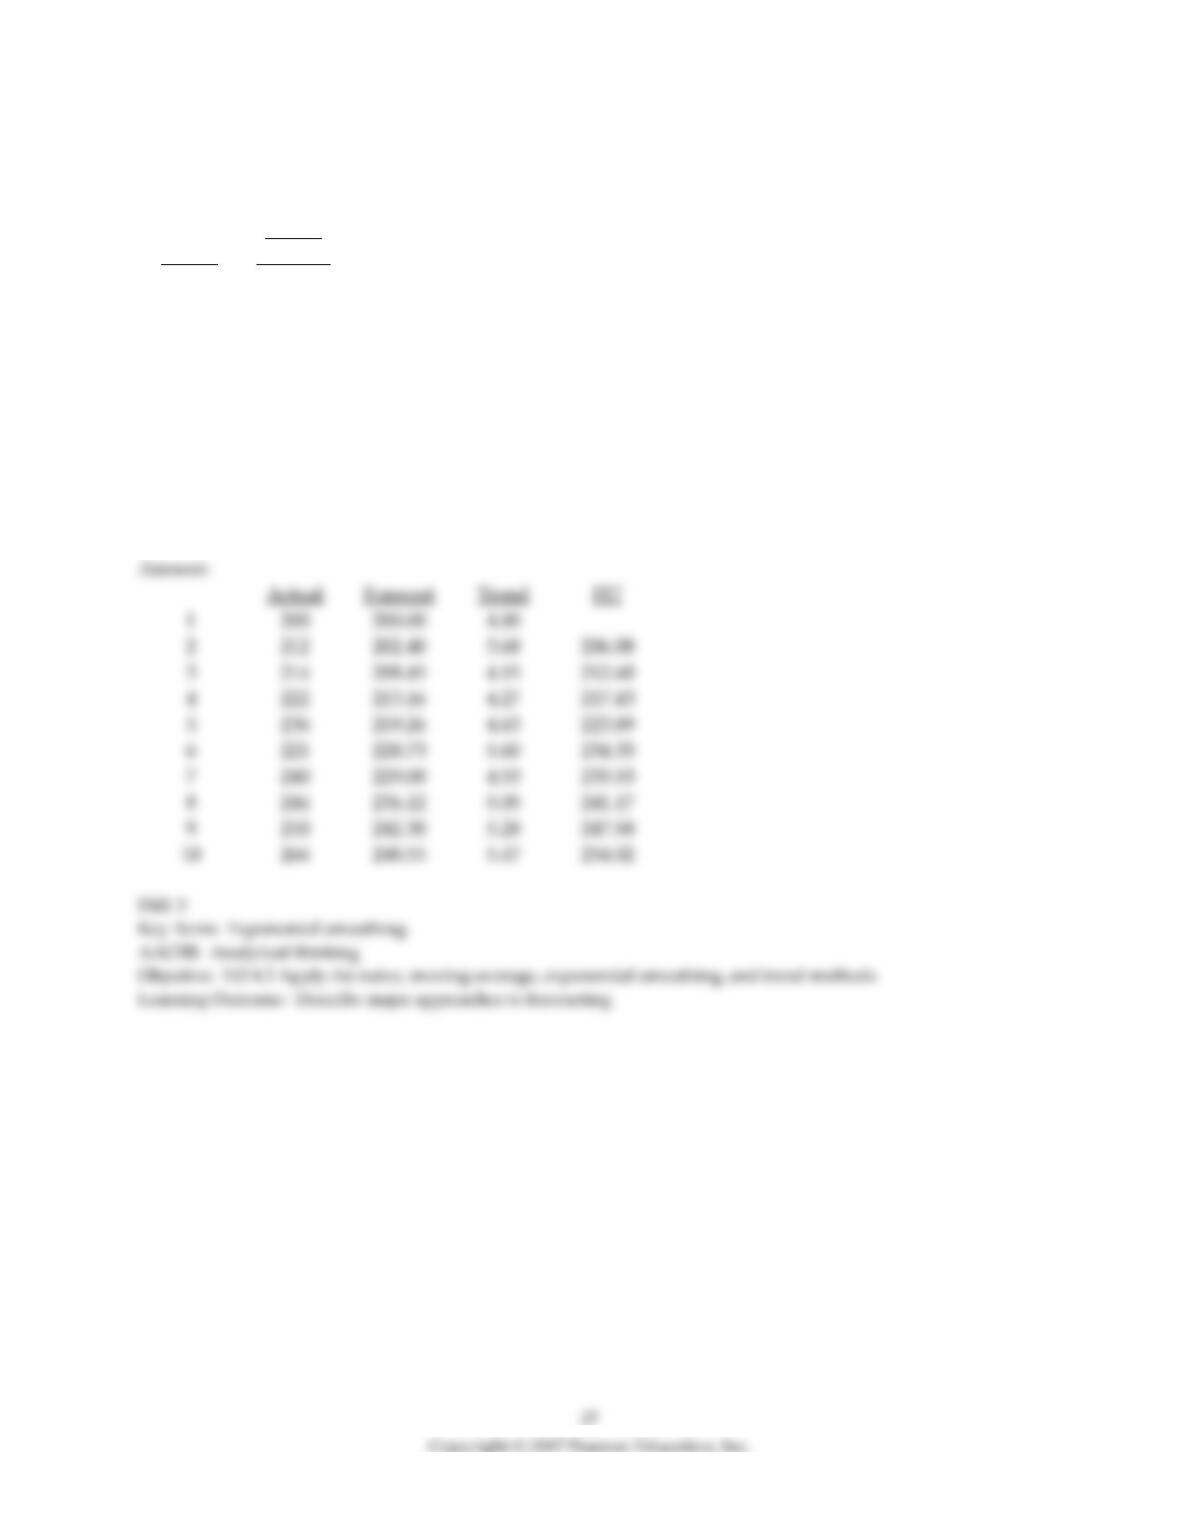
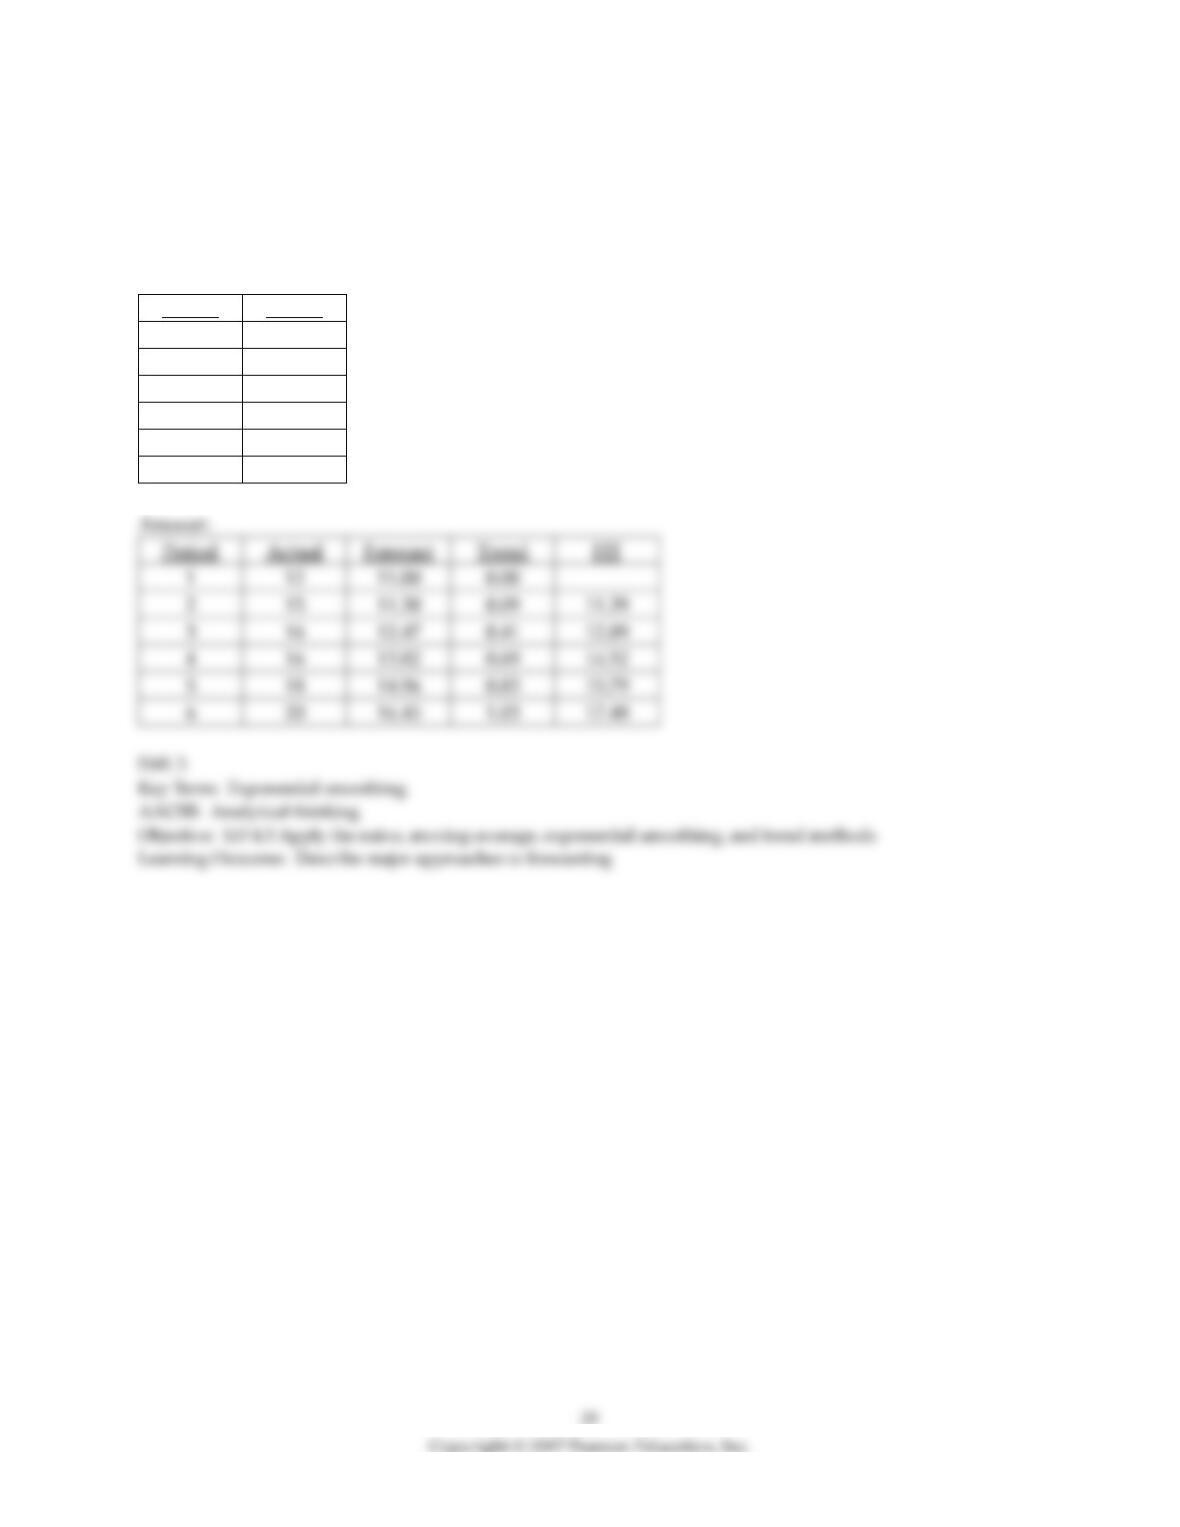
68) Use exponential smoothing with trend adjustment to forecast deliveries for period 10. Let alpha = 0.4,
beta = 0.2, and let the initial trend value be 4 and the initial forecast be 200.
Period
Actual
Demand
1
200
2
212
3
214
4
222
5
236
6
221
7
240
8
244
9
250
10
266
1
200
2
212
3
214
4
222
5
236
6
221
7
240
8
244
9
250
10
266
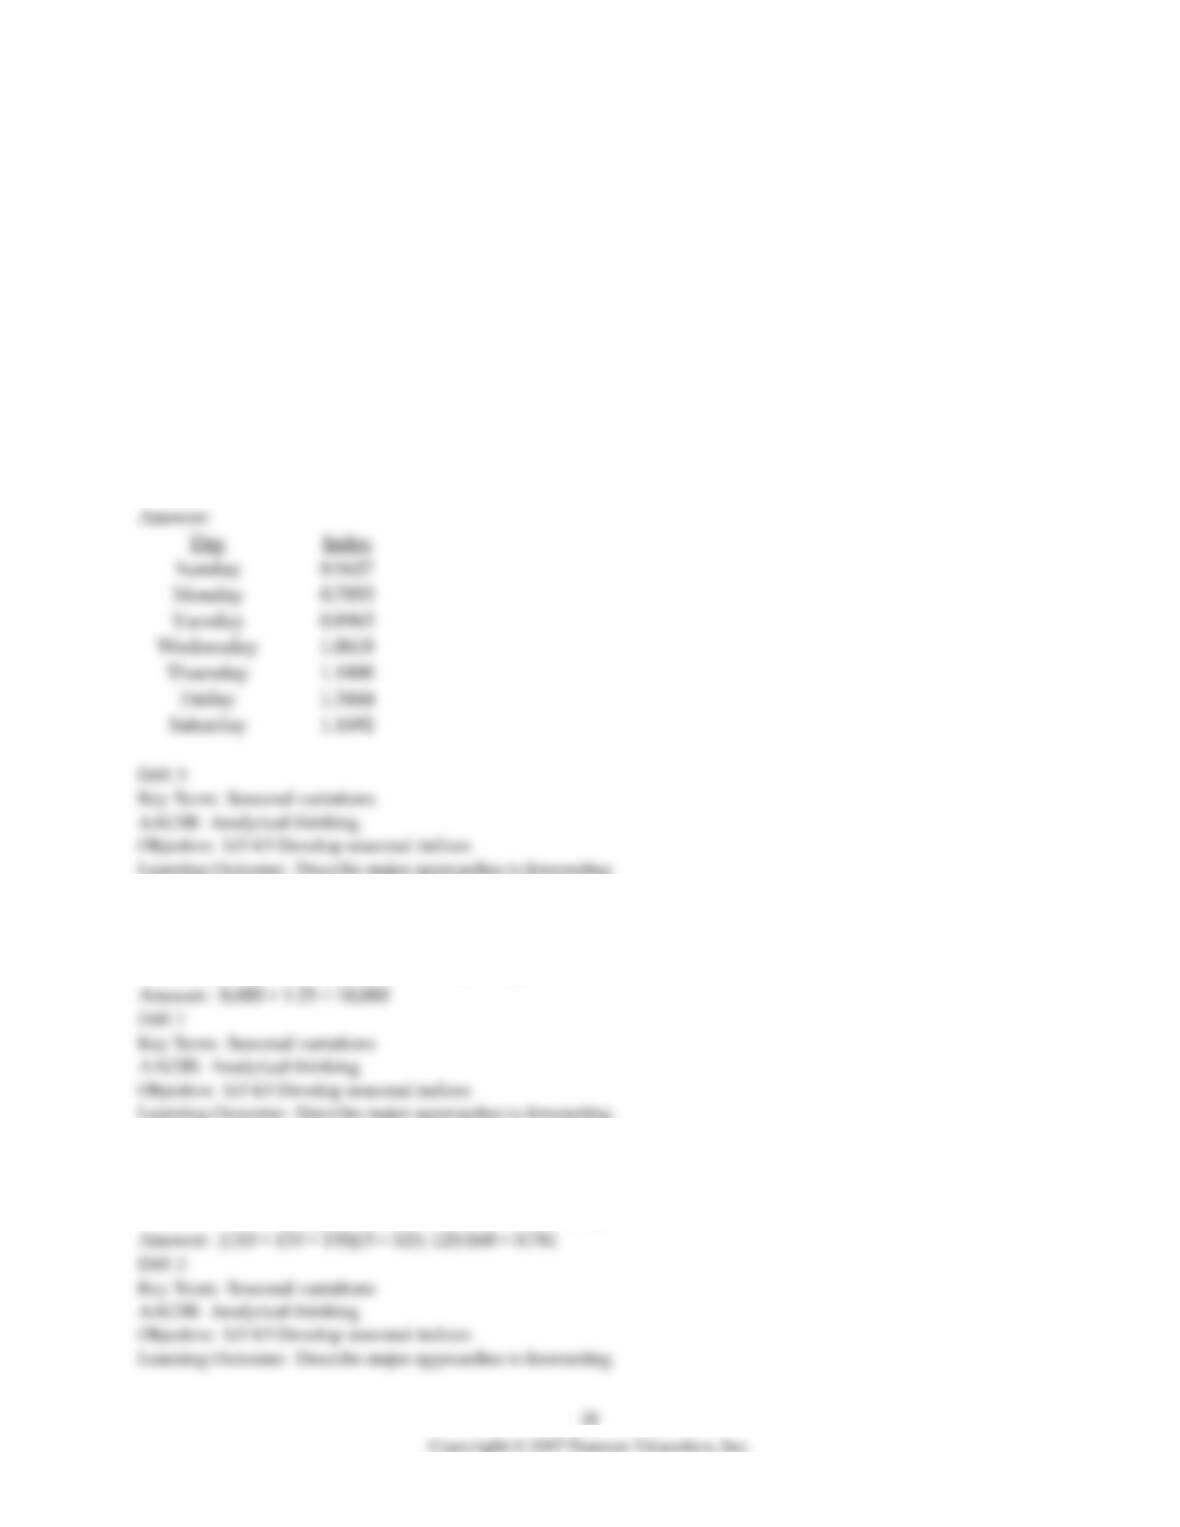
69) A restaurant has tracked the number of meals served at lunch over the last four weeks. The data show
little in terms of trends, but do display substantial variation by day of the week. Use the following
information to determine the seasonal (daily) indices for this restaurant.
Week
Day
1
2
3
4
Sunday
40
35
39
43
Monday
54
55
51
59
Tuesday
61
60
65
64
Wednesday
72
77
78
69
Thursday
89
80
81
79
Friday
91
90
99
95
Saturday
80
82
81
83
70) Demand for a certain product is forecast to be 8,000 units per month, averaged over all 12 months of
the year. The product follows a seasonal pattern, for which the January monthly index is 1.25. What is the
seasonally-adjusted sales forecast for January?
71) A seasonal index for a monthly series is about to be calculated on the basis of three years’
accumulation of data. The three previous July values were 110, 135, and 130. The average over all months
is 160. What is the approximate seasonal index for July?
72) Marie Bain is the production manager at a company that manufactures hot water heaters. Marie needs
a demand forecast for the next few years to help decide whether to add new production capacity. The
company’s sales history (in thousands of units) is shown in the table below. Use exponential smoothing
with trend adjustment to forecast demand for period 6. The initial forecast for period 1 was 11 units; the
initial estimate of trend was 0. The smoothing constants are α = .3 and β = .3
Period
Actual
1
12
2
15
3
16
4
16
5
18
6
20
Period
Actual
1
12
2
15
3
16
4
16
5
18
6
20
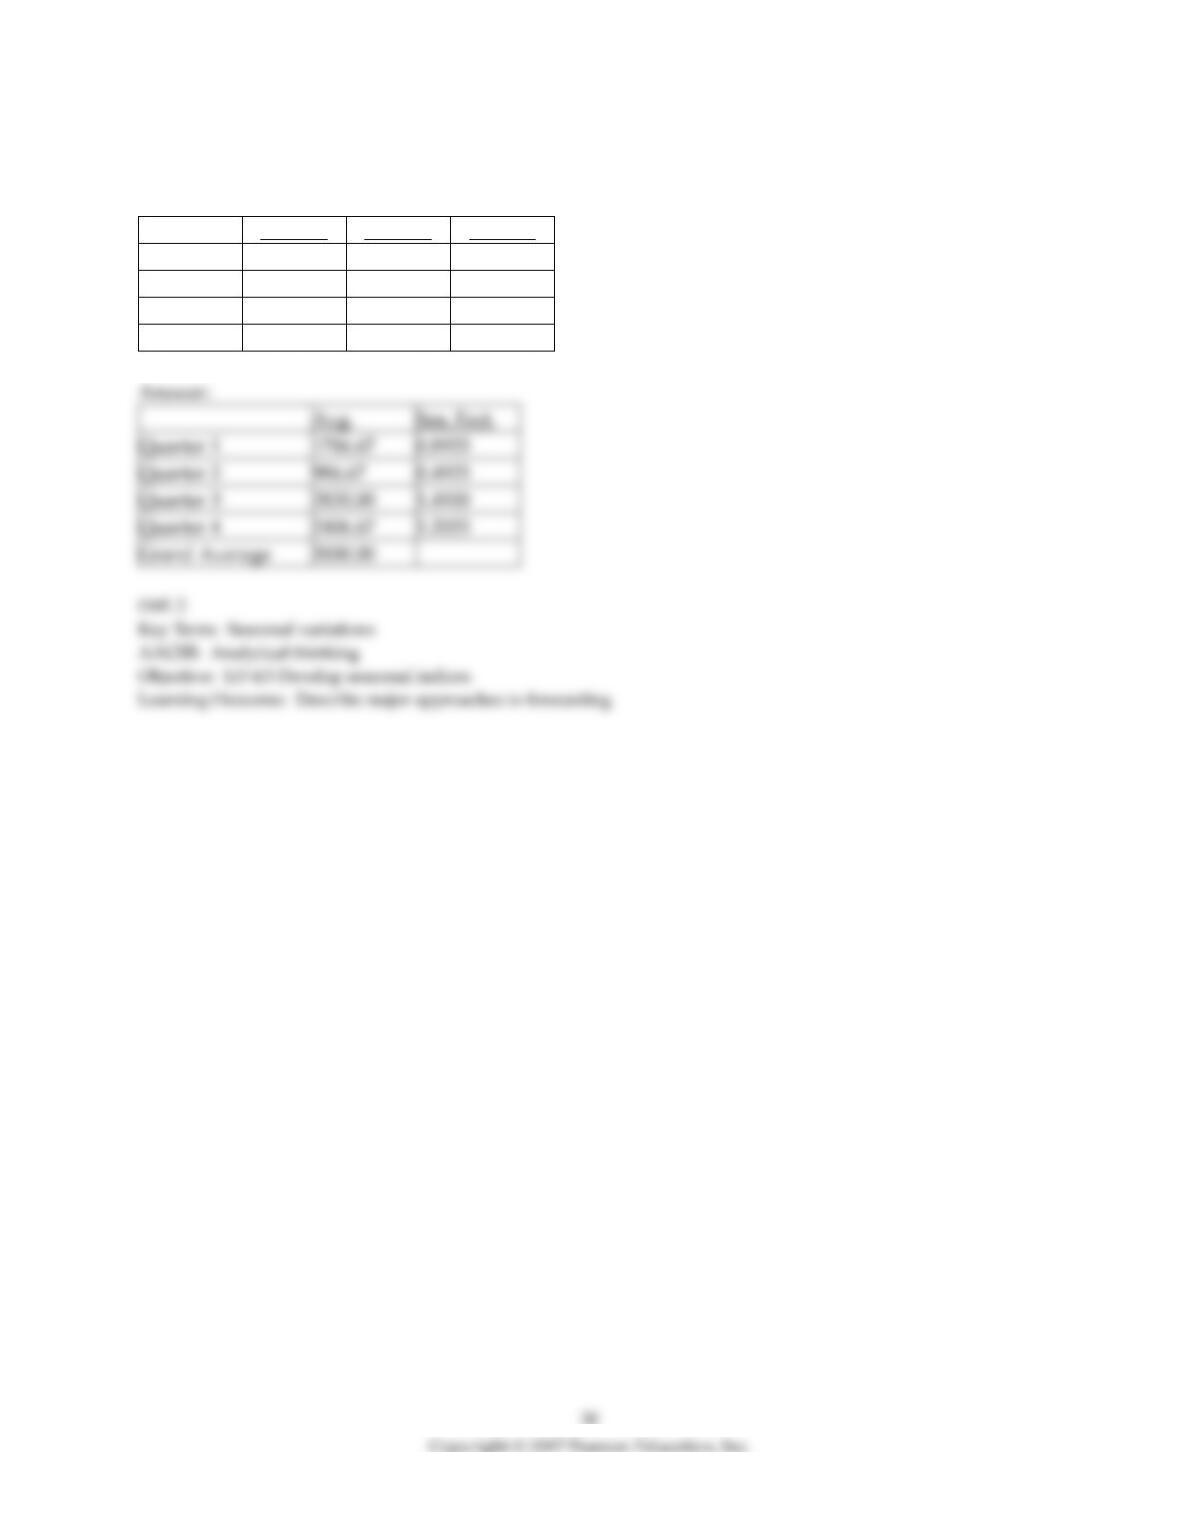
73) The quarterly sales for specific educational software over the past three years are given in the
following table. Compute the four seasonal factors.
YEAR 1
YEAR 2
YEAR 3
Quarter 1
1710
1820
1830
Quarter 2
960
910
1090
Quarter 3
2720
2840
2900
Quarter 4
2430
2200
2590
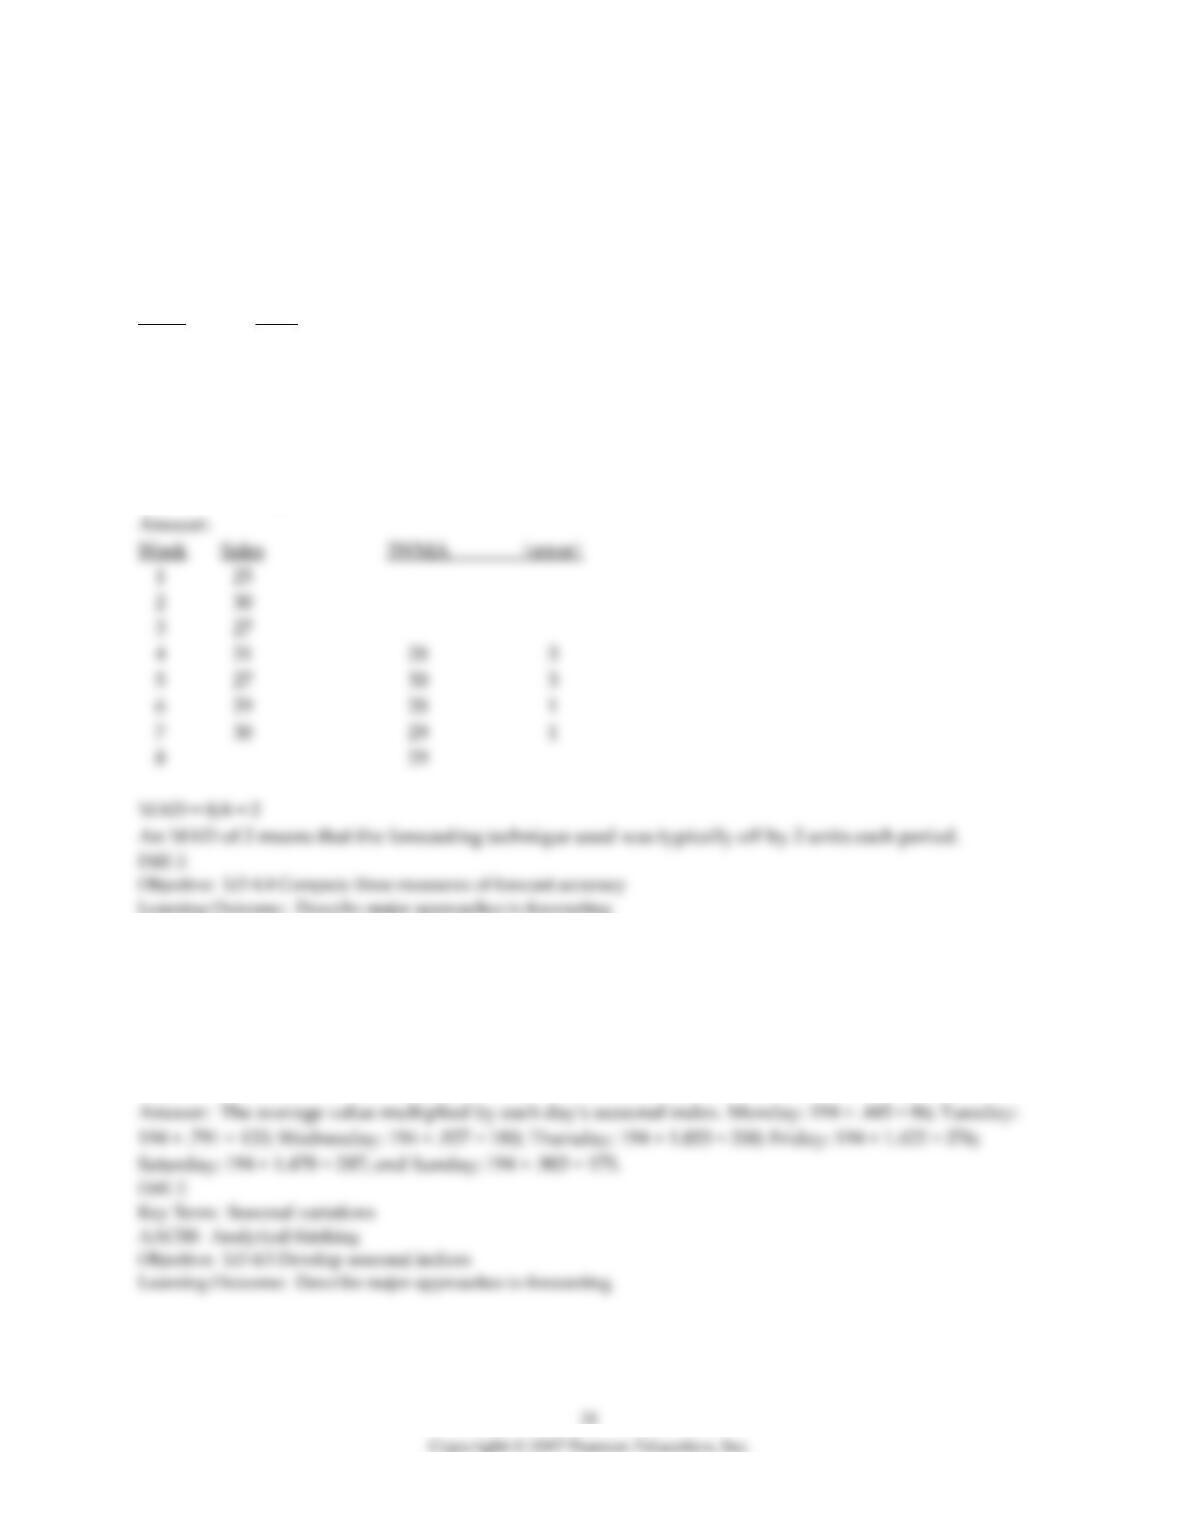
74) The last seven weeks of demand at a new car dealer are shown below. Use a three-period weighted-
moving average forecast to determine a forecast for the 8th week using weights of 3, 2, and 1 (where the
most recent week receives the highest weight). (Round all forecasts to the nearest whole unit.) Calculate
the MAD for this forecast (covering all weeks in which error comparisons can be made). What does the
MAD indicate?
Week Sales
1 25
2 30
3 27
4 31
5 27
6 29
7 30
75) A small family-owned restaurant uses a seven-day moving average model to determine manpower
requirements. These forecasts need to be seasonalized because each day of the week has its own demand
pattern. The seasonal indices for each day of the week are: Monday 0.445; Tuesday 0.791; Wednesday
0.927; Thursday 1.033; Friday 1.422; Saturday 1.478; and Sunday 0.903. Average daily demand based on
the most recent moving average is 194 patrons. What is the seasonalized forecast for each day of next
week?
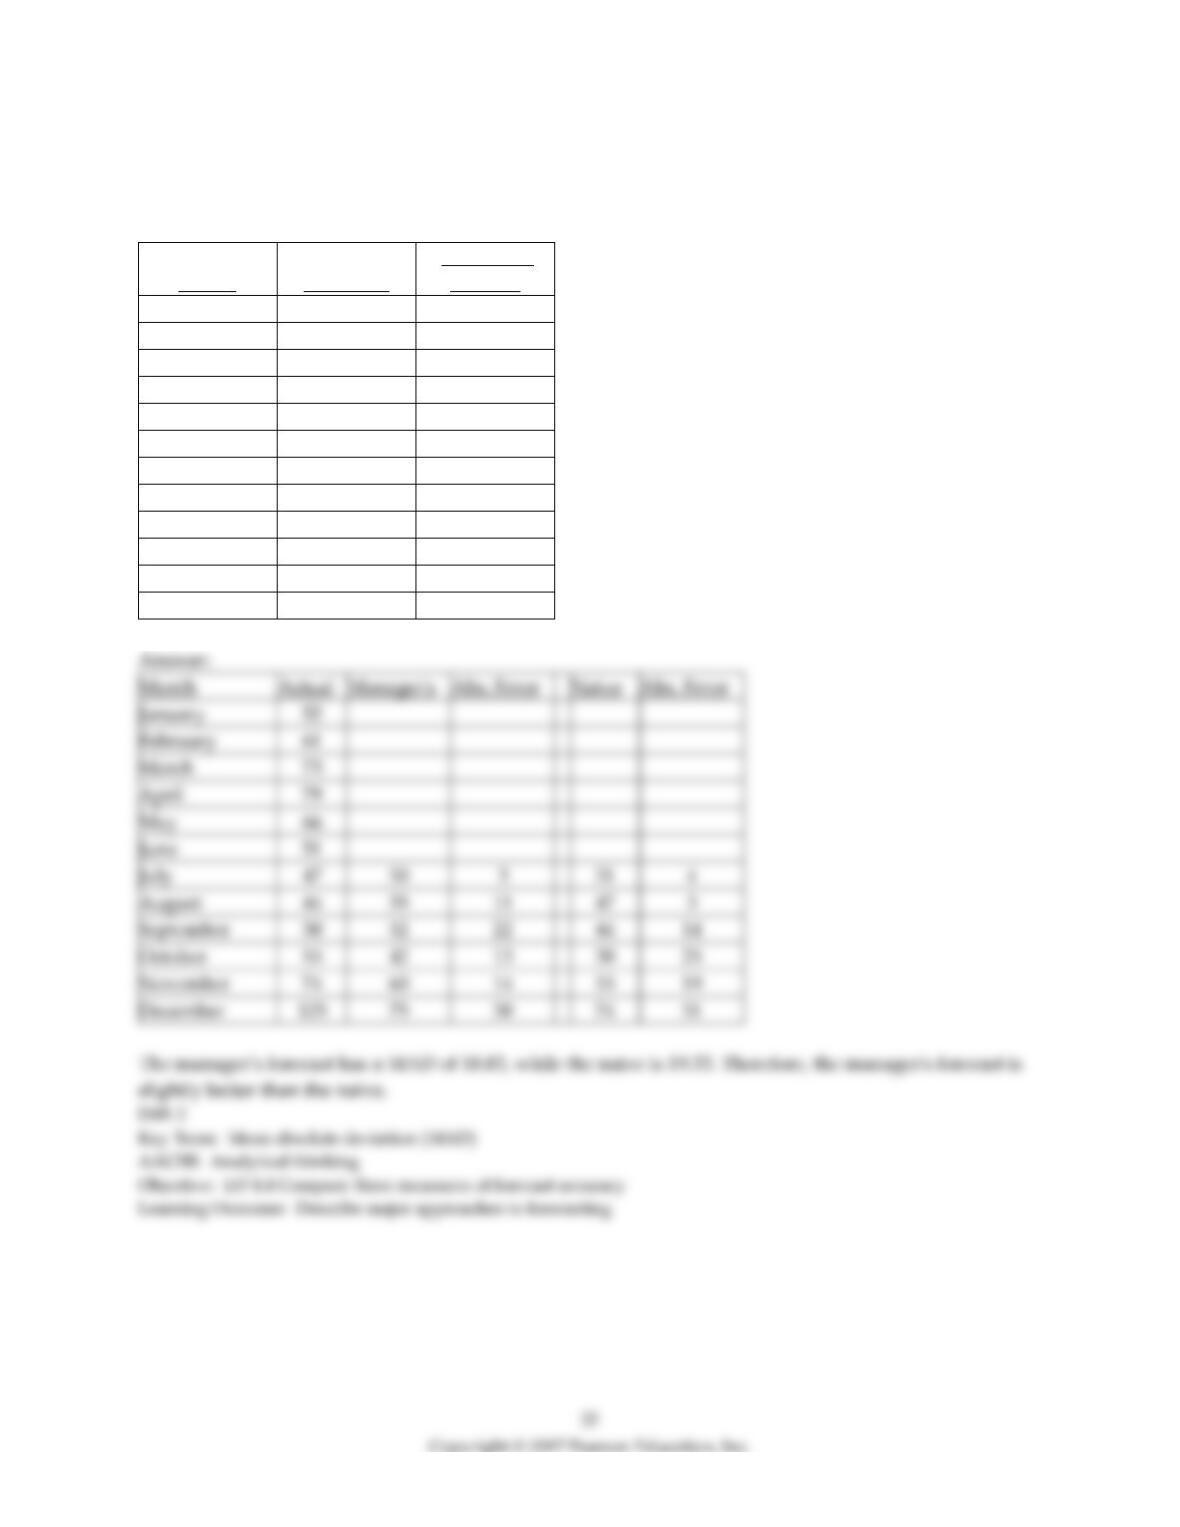
76) The department manager using a combination of methods has forecast sales of toasters at a local
department store. Calculate the MAD for the manager’s forecast. Compare the manager’s forecast against
a naive forecast covering the same time period. Which is better?
Month
Unit Sales
Manager’s
Forecast
January
52
February
61
March
73
April
79
May
66
June
51
July
47
50
August
44
55
September
30
52
October
55
42
November
74
60
December
125
75
3
Section 6 Associative Forecasting Methods: Regression and Correlation Analysis
1) Linear-regression analysis is a straight-line mathematical model to describe the functional relationships
between independent and dependent variables.
2) The larger the standard error of the estimate, the more accurate the forecasting model.
3) In a regression equation where y-hat is demand and x is advertising, a coefficient of determination (R2)
of .70 means that 70% of the variance in advertising is explained by demand.
4) Regression lines graphically depict “cause-and-effect” relationships.
5) A fundamental distinction between trend projection and linear regression is that:
A) trend projection uses least squares while linear regression does not.
B) only linear regression can have a negative slope.
C) in trend projection the independent variable is time; in linear regression the independent variable need
not be time, but can be any variable with explanatory power.
D) trend projection can be a function of several variables, while linear regression can only be a function of
one variable.
E) trend projection uses two smoothing constants, not just one.
6) The degree or strength of a relationship between two variables is shown by the:
A) alpha.
B) mean.
C) mean absolute deviation.
D) coefficient of correlation.
E) cumulative error.
7) If two variables were perfectly correlated, what would the coefficient of correlation r equal?
A) 0
B) -1
C) 1
D) B or C
E) none of the above
8) Linear regression is known as a(n) ________ model because it incorporates variables or factors that
might influence the quantity being forecast.
9) The ________ measures the strength of the relationship between two variables.
10) Distinguish a dependent variable from an independent variable.
11) Explain, in your own words, the meaning of the coefficient of determination.
12) A firm has modeled its experience with industrial accidents and found that the number of accidents
per year (y-hat) is related to the number of employees (x) by the regression equation:
y-hat = 3.3 + 0.049x. The r-squared value is 0.68. The regression is based on 20 annual observations. The
firm intends to employ 480 workers next year. How many accidents do you project? How much
confidence do you have in that forecast?
13) An innovative restaurateur owns and operates a dozen “Ultimate Low-Carb” restaurants in northern
Arkansas. His signature item is a cheese-encrusted beef medallion wrapped in lettuce. Sales (x, in
millions of dollars) is related to Profits (y-hat, in hundreds of thousands of dollars) by the regression
equation y-hat = 8.21 + 0.76 x. What is your forecast of profit for a store with sales of $40 million? $50
million?
14) Arnold Tofu owns and operates a chain of 12 vegetable protein “hamburger” restaurants in northern
Louisiana. Sales figures and profits for the stores are provided in the table below. Sales are given in
millions of dollars; profits are in hundreds of thousands of dollars. Calculate a regression line for the
data. What is your forecast of profit for a store with sales of $24 million? $30 million?
Store
Profits
Sales
1
14
6
2
11
3
3
15
5
4
16
5
5
24
15
6
28
18
7
22
17
8
21
12
9
26
15
10
43
20
11
34
14
12
9
5
Section 7 Monitoring and Controlling Forecasts
1) If a forecast is consistently greater than (or less than) actual values, the forecast is said to be biased.
2) Focus forecasting tries a variety of computer models and selects the best one for a particular
application.
3) The last four weekly values of sales were 80, 100, 105, and 90 units. The last four forecasts were 60, 80,
95, and 75 units. These forecasts illustrate:
A) qualitative methods.
B) adaptive smoothing.
C) slope.
D) bias.
E) trend projection.
4) The tracking signal is the:
A) standard error of the estimate.
B) absolute deviation of the last period’s forecast.
C) MAD.
D) ratio of cumulative error / MAD.
E) MAPE.
5) Computer monitoring of tracking signals and self-adjustment if a signal passes a preset limit is
characteristic of:
A) exponential smoothing including trend.
B) adaptive smoothing.
C) trend projection.
D) focus forecasting.
E) multiple regression analysis.
6) ________ forecasting tries a variety of computer models and selects the best one for a particular
application.
7) An approach to exponential smoothing in which the smoothing constant is automatically changed to
keep errors to a minimum is called ________.
8) What is a tracking signal? Explain the connection between adaptive smoothing and tracking signals.
9) What is focus forecasting?
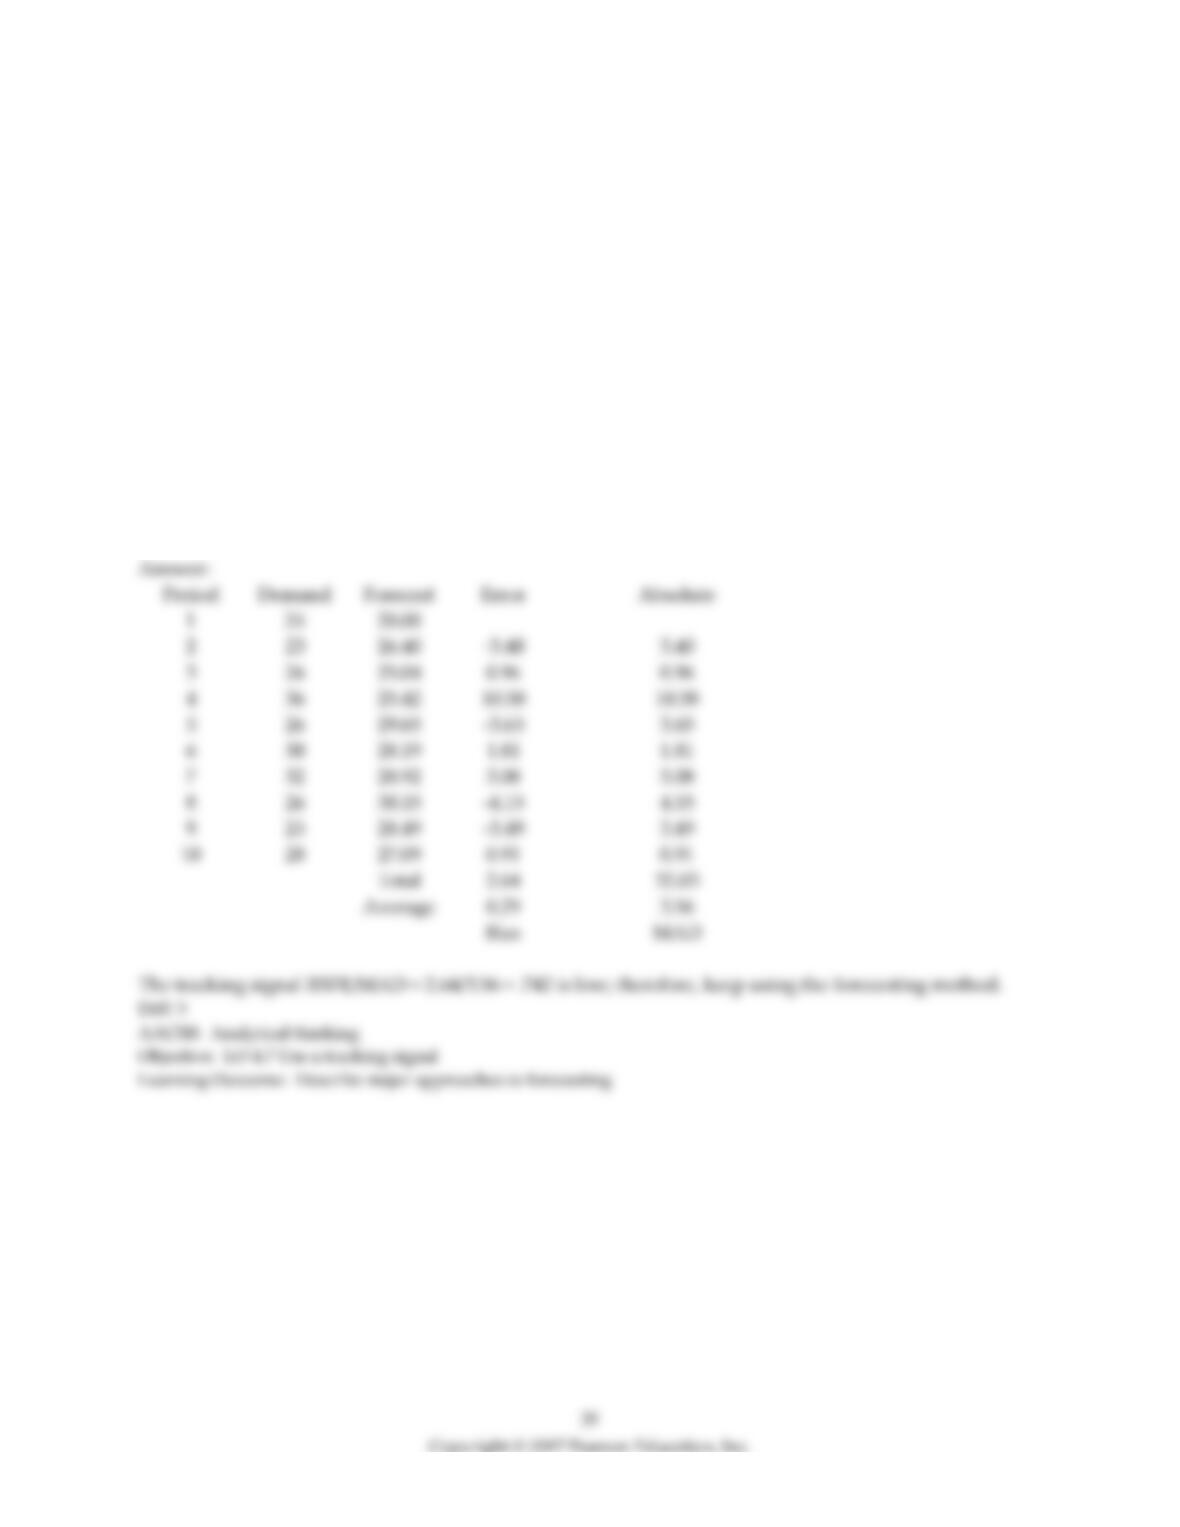
10) Jim’s department at a local department store has tracked the sales of a product over the last ten weeks.
Forecast demand using exponential smoothing with an alpha of 0.4, and an initial forecast of 28.0 for
period 1. Calculate the MAD. Calculate the tracking signal. What do you recommend?
Period
Demand
1
24
2
23
3
26
4
36
5
26
6
30
7
32
8
26
9
25
10
28
-4.15

Section 8 Forecasting in the Service Sector
1) Many services maintain records of sales noting:
A) the day of the week.
B) unusual events.
C) the weather.
D) holiday impacts.
E) all of the above.
2) Taco Bell’s unique employee scheduling practices are partly the result of using:
A) point-of-sale computers to track food sales in 15 minute intervals.
B) focus forecasting.
C) a six-week moving average forecasting technique.
D) multiple regression.
E) A and C are both correct.