42) ________ expresses the error as a percent of the actual values.
A) MAD
B) MSE
C) MAPE
D) FIT
E) The smoothing constant
43) If Brandon Edward were working to develop a forecast using a moving averages approach, but he
noticed a detectable trend in the historical data, he should:
A) use weights to place more emphasis on recent data.
B) use weights to minimize the importance of the trend.
C) change to an associative multiple regression approach.
D) use a simple moving average.
E) change to a qualitative approach.
44) A(n) ________ forecast uses an average of the most recent periods of data to forecast the next period.
45) The smoothing constant is a weighting factor used in ________.
46) A measure of forecast error that does not depend upon the magnitude of the item being forecast is the
________.
47) When one constant is used to smooth the forecast average and a second constant is used to smooth the
trend, the forecasting method is ________.
48) ________ is a time-series forecasting method that fits a trend line to a series of historical data points
and then projects the line into the future for forecasts.
49) Simple ________ forecasts only work well if we can assume that market demands will stay fairly
steady over time.
50) If a barbershop operator noted that Tuesday’s business was typically twice as heavy as Wednesday’s,
and that Friday’s business was typically the busiest of the week, business at the barbershop is subject to
________.
51) Identify the four components of a time series. Which one of these is rarely forecast? Why is this so?
52) Compare seasonal effects and cyclical effects.
53) Distinguish between a weighted moving average model and an exponential smoothing model.
54) Describe three popular measures of forecast accuracy.
55) Give an example, other than a restaurant or other food-service firm, of an organization that
experiences an hourly seasonal pattern. (That is, each hour of the day has a pattern that tends to repeat
day after day.) Explain.
56) Explain the role of regression models (time series and otherwise) in forecasting. That is, how is trend
projection able to forecast? How is regression used for causal forecasting?
57) Identify two advantages of the moving average forecasting model. Identify two disadvantages of the
moving average forecasting model.
58) What does it mean to “decompose” a time series?
59) What is the key difference between weighted moving average and simple moving average approaches
to forecasting?
60) Weekly sales of ten-grain bread at the local organic food market are provided in the table below.
Based on these data, forecast week 9 using a five-week moving average.
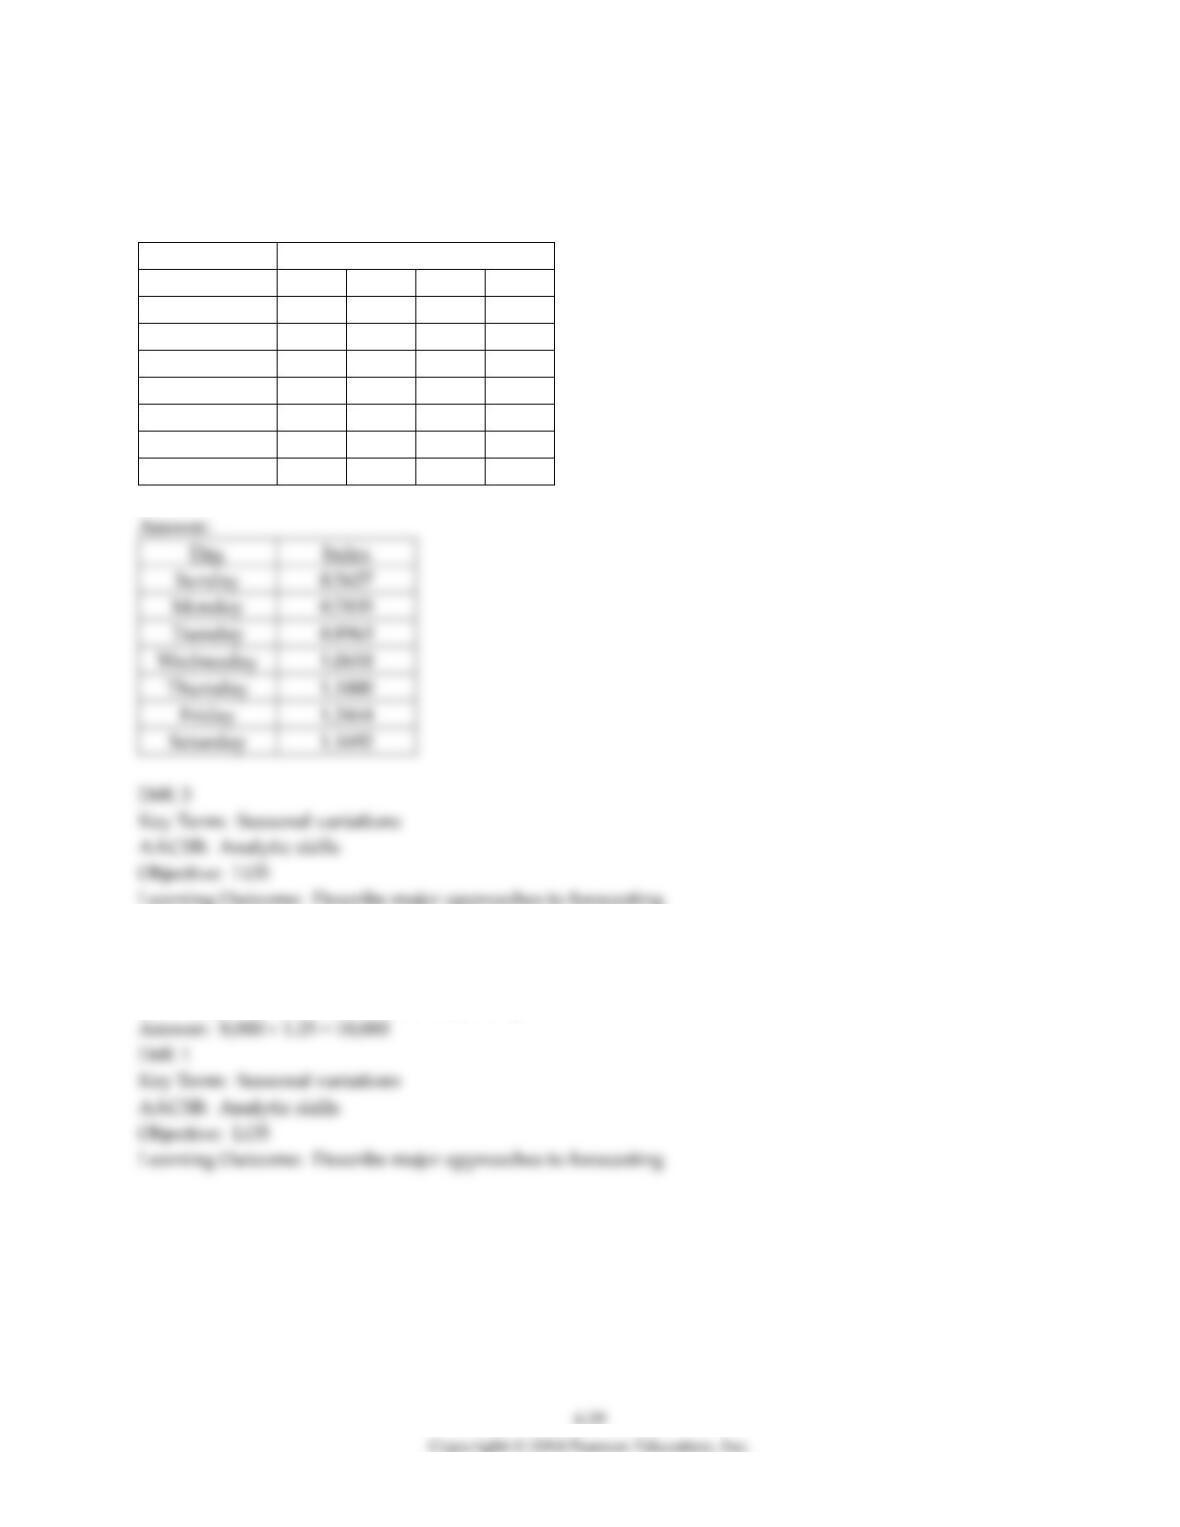
Week Sales
1 415
2 389
3 420
4 382
5 410
6 432
7 405
8 421
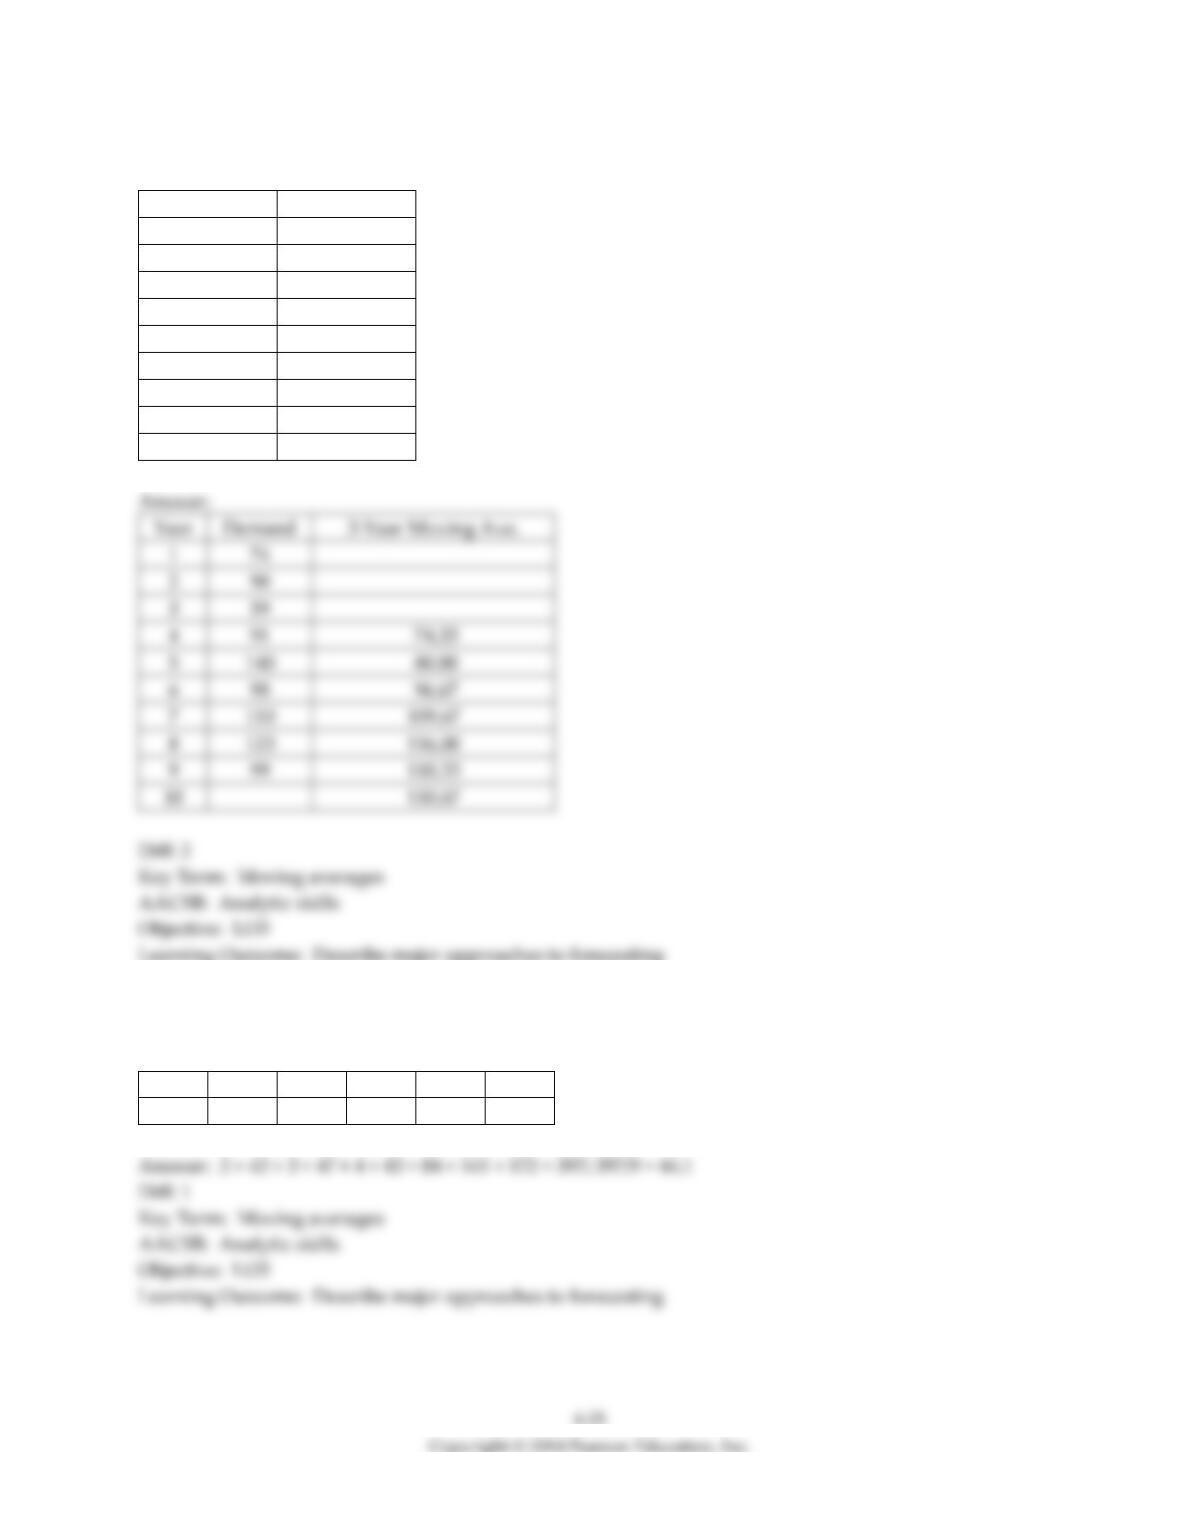
61) Given the following data, calculate the three-year moving averages for years 4 through 10.
Year
Demand
1
74
2
90
3
59
4
91
5
140
6
98
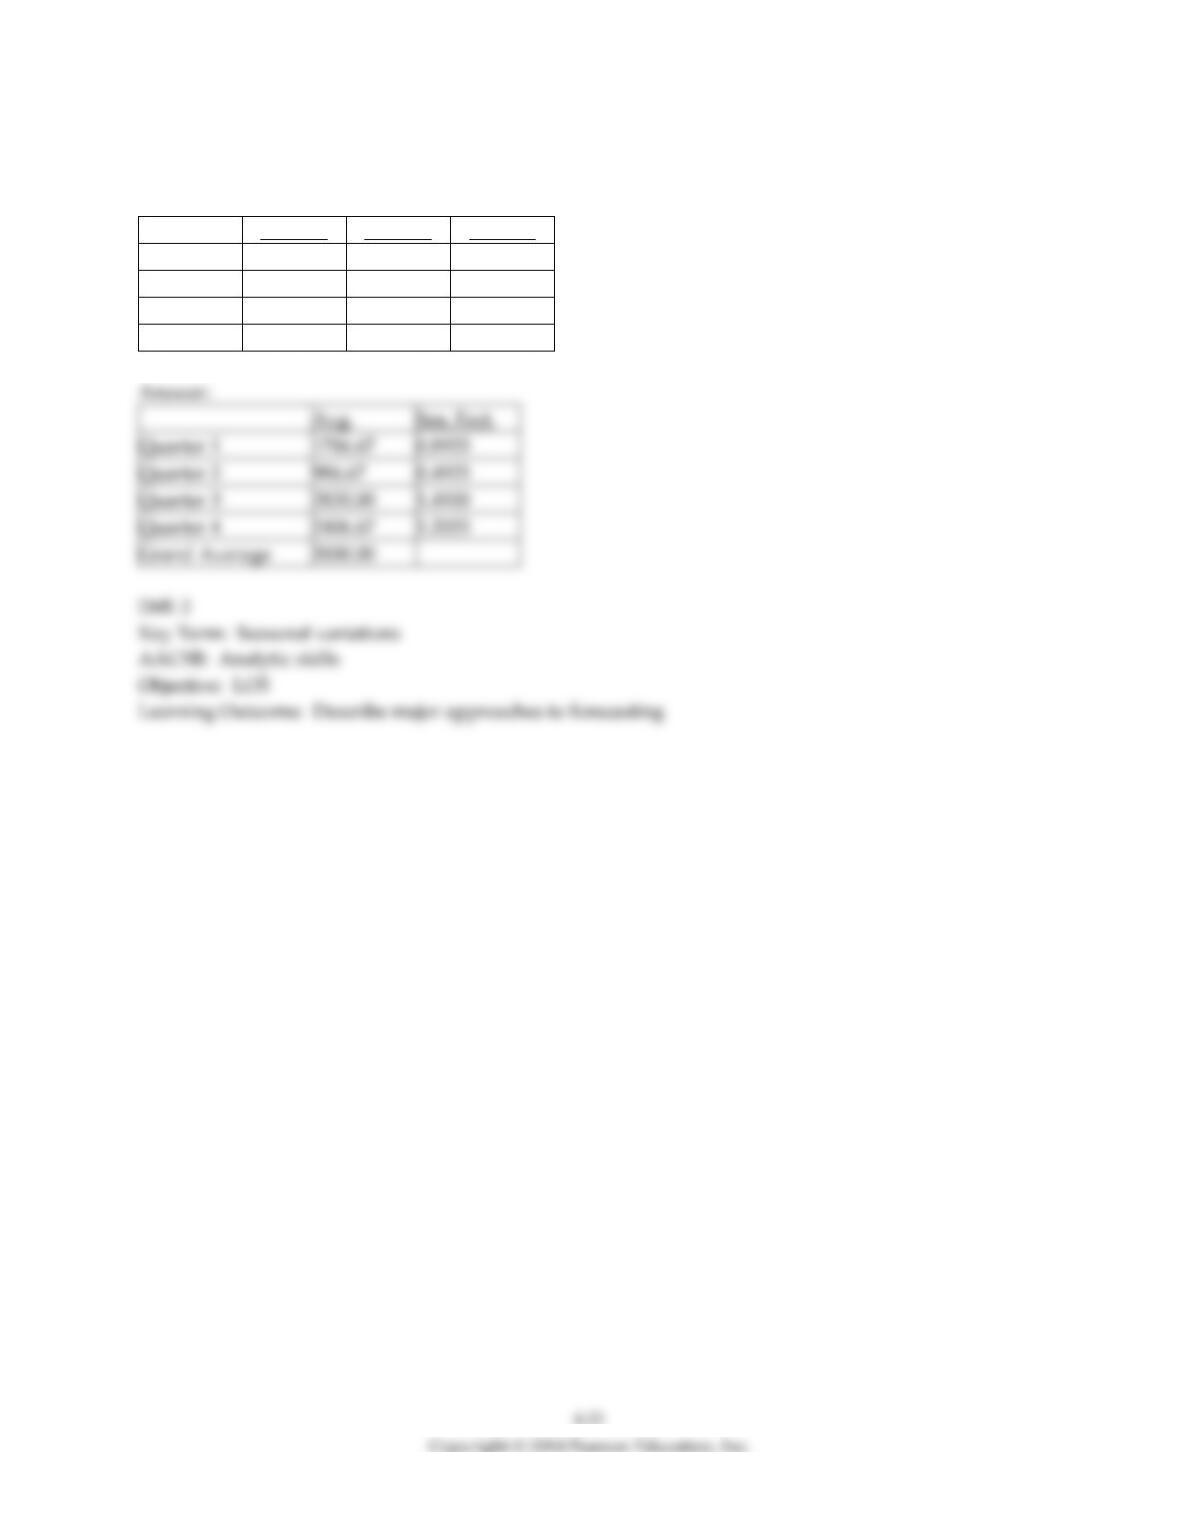
7
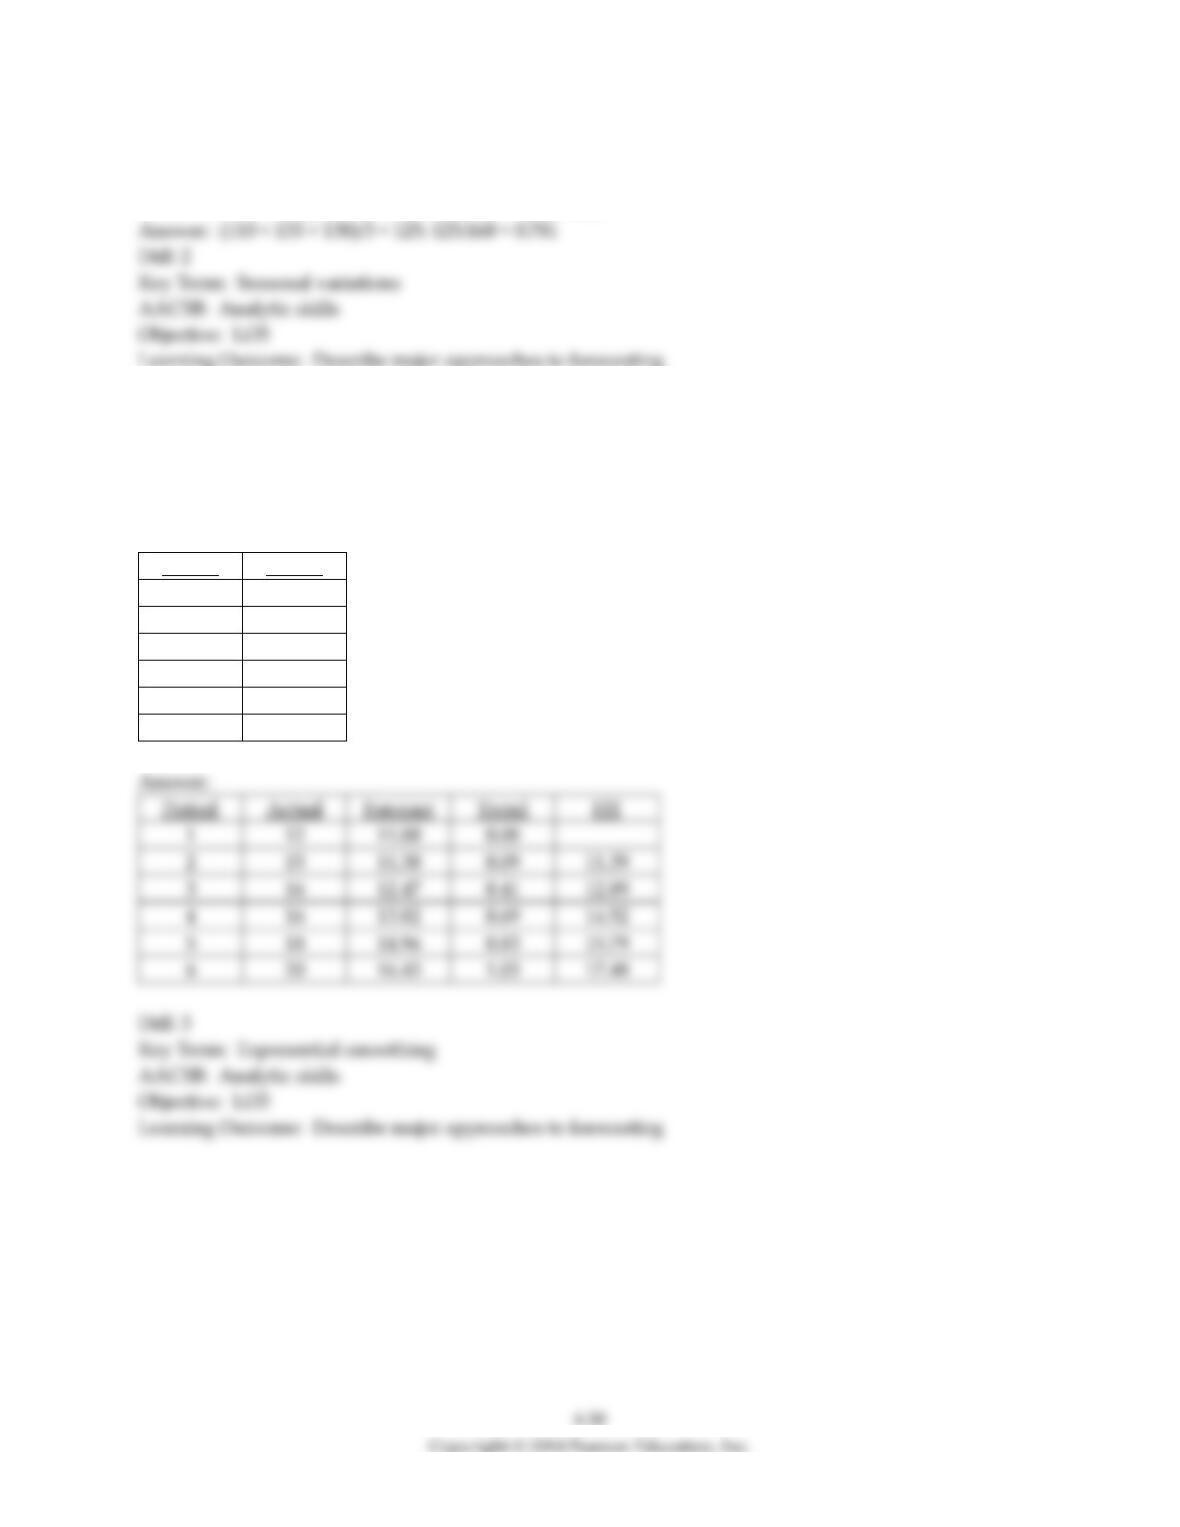
110
8
123
9
99
62) What is the forecast for May based on a weighted moving average applied to the following past
demand data and using the weights: 4, 3, 2 (largest weight is for most recent data)?
Nov.
Dec.
Jan.
Feb.
Mar.
April
37
36
40
42
47
43
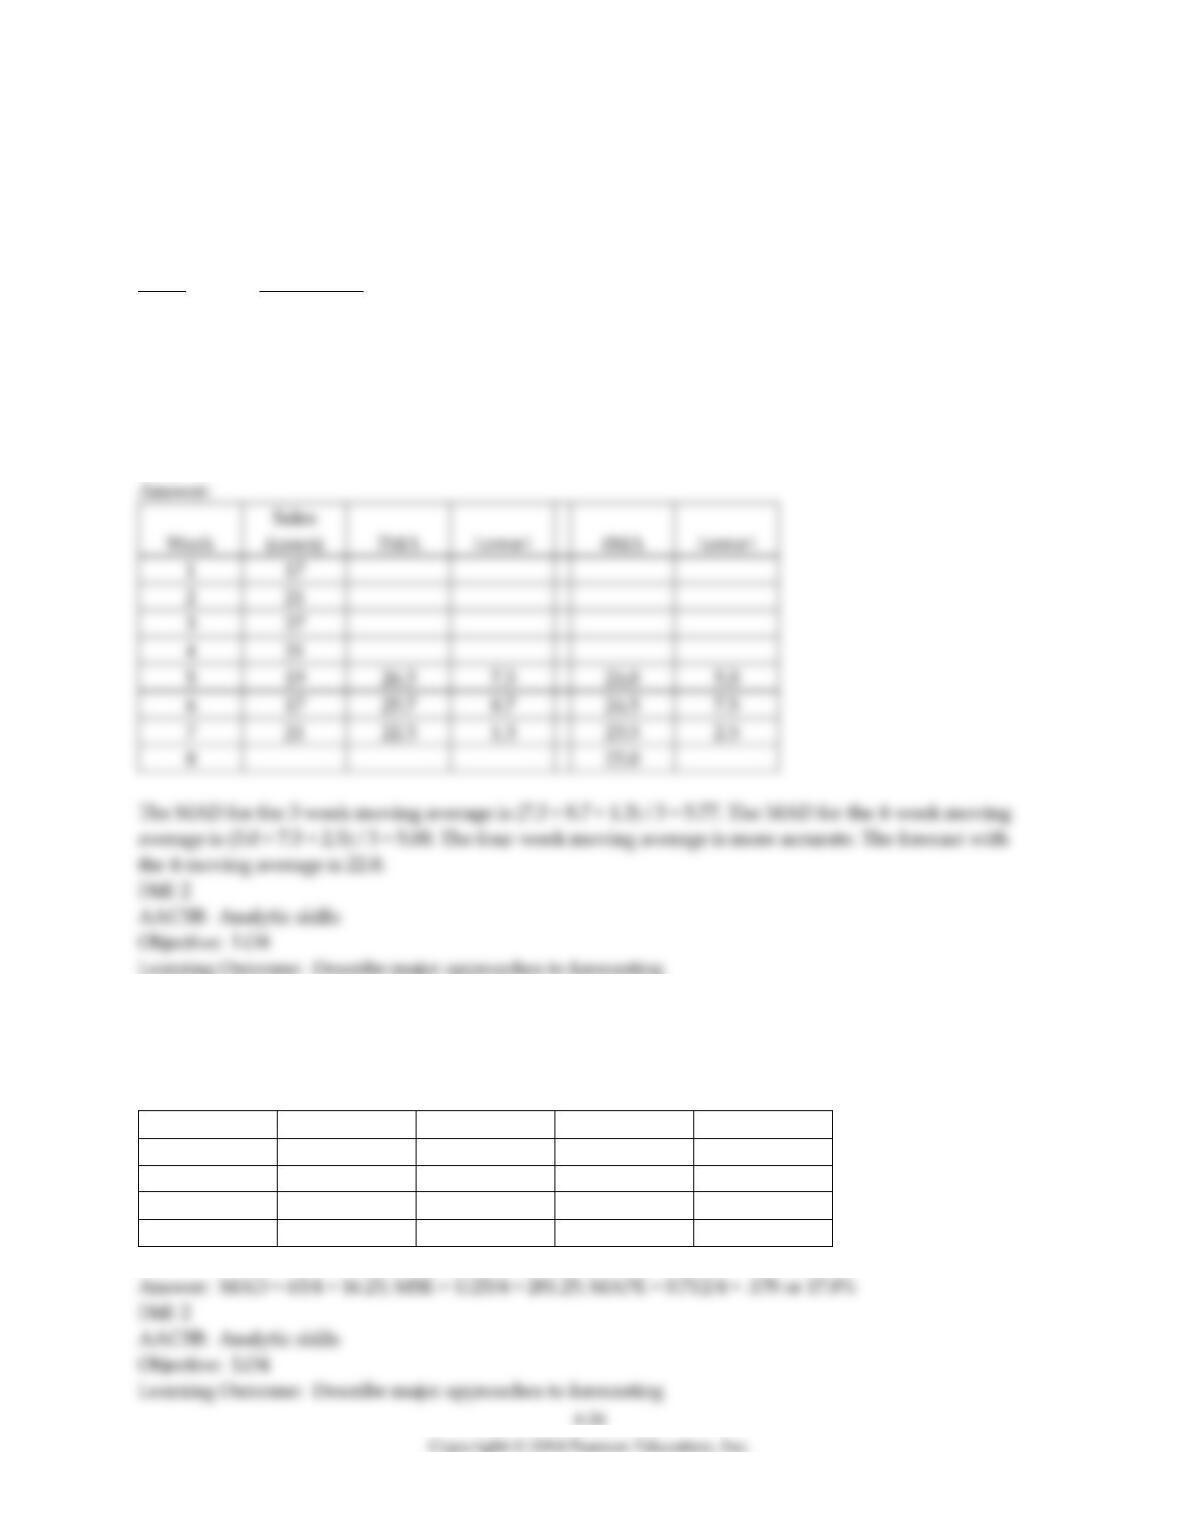
63) Weekly sales of copy paper at Cubicle Suppliers are provided in the table below. Compute a three–
period moving average and a four-period moving average for weeks 5, 6, and 7. Compute the MAD for
both forecasting methods. Which model is more accurate? Forecast week 8 with the more accurate
method.
Week Sales (cases)
1 17
2 21
3 27
4 31
5 19
6 17
7 21
2
4
5
7
64) The last four weekly values of sales were 80, 100, 105, and 90 units, respectively. The last four
forecasts (for the same four weeks) were 60, 80, 95, and 75 units, respectively. Calculate the MAD, MSE,
and MAPE for these four weeks.
Sales
Forecast
Error
Error squared
Pct. error
80
60
20
400
.25
100
80
20
400
.20
105
95
10
100
.095
90
75
15
225
.167
65) A management analyst is using exponential smoothing to predict merchandise returns at an upscale
branch of a department store chain. Given an actual number of returns of 154 items in the most recent
period completed, a forecast of 172 items for that period, and a smoothing constant of 0.3, what is the
forecast for the next period? How would the forecast be changed if the smoothing constant were 0.6?
Explain the difference in terms of alpha and responsiveness.
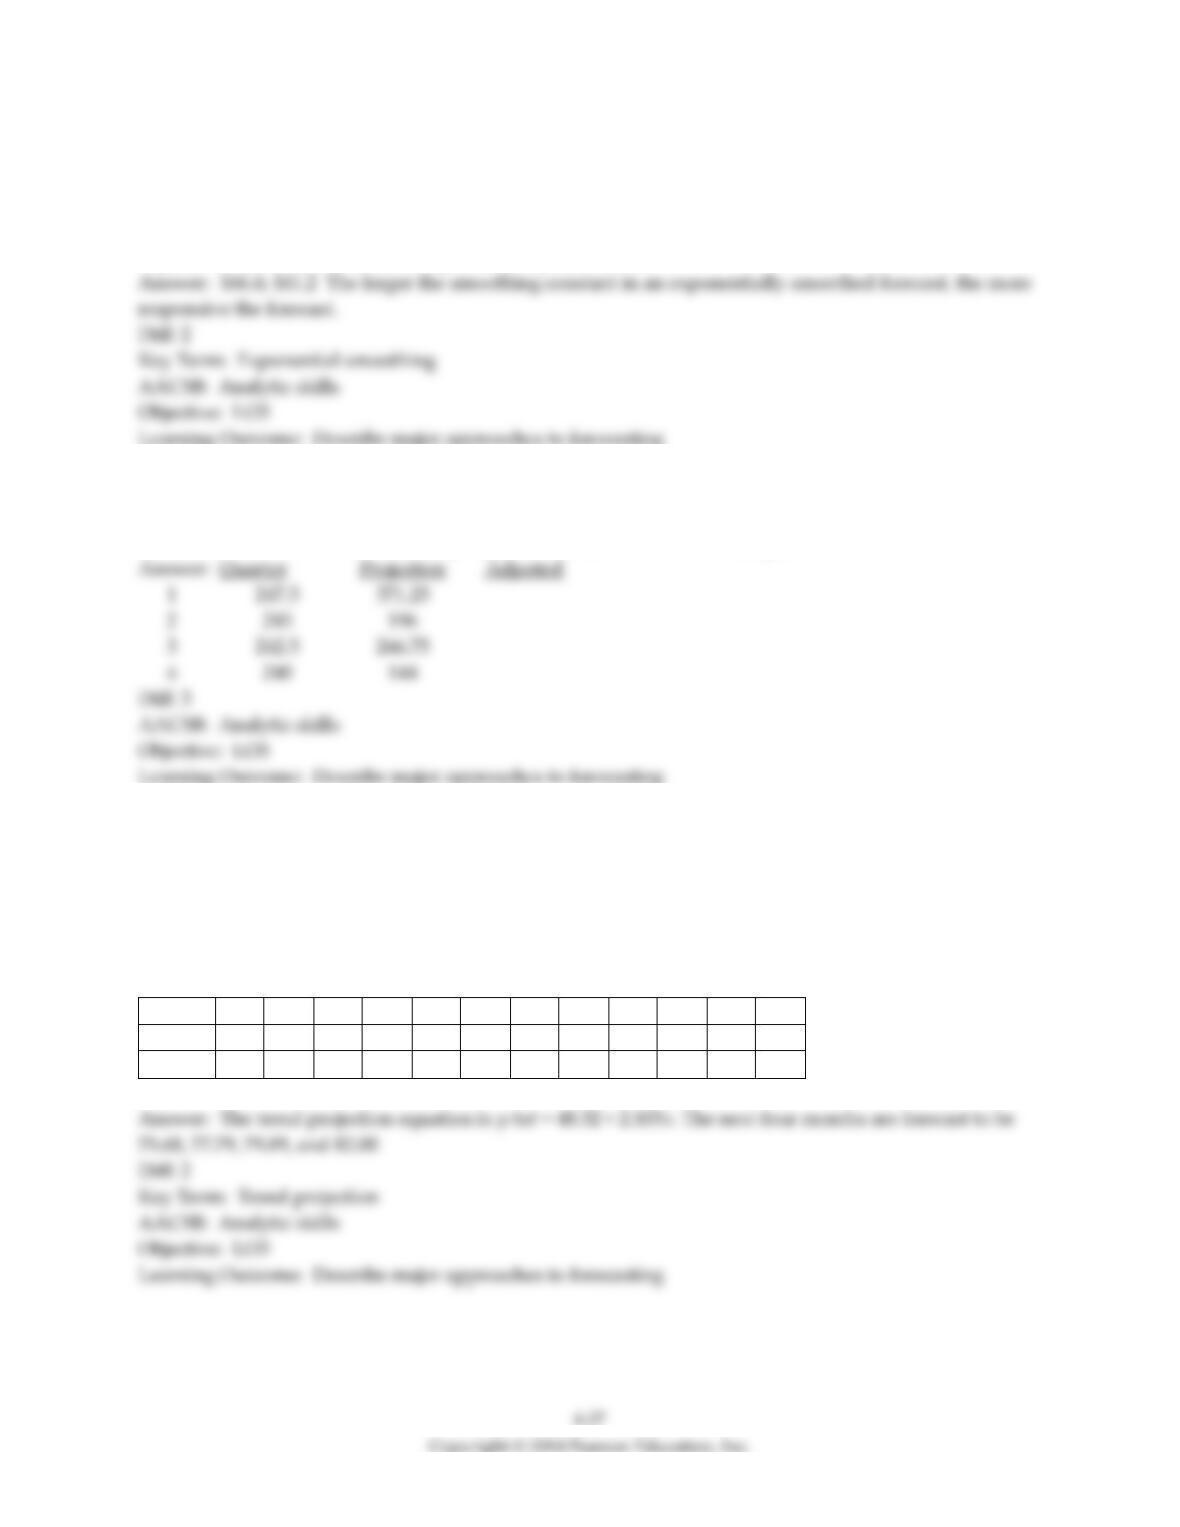
66) The following trend projection is used to predict quarterly demand: y-hat = 250 – 2.5x, where x = 1 in
the first quarter. Seasonal (quarterly) indices are Quarter 1 = 1.5; Quarter 2 = 0.8; Quarter 3 = 1.1; and
Quarter 4 = 0.6. What is the seasonally adjusted forecast for the next four quarters?
67) Favors Distribution Company purchases small imported trinkets in bulk, packages them, and sells
them to retail stores. The managers are conducting an inventory control study of all their items. The
following data are for one such item, which is not seasonal.
a. Use a trend projection to estimate the relationship between time and sales (state the equation).
b. Calculate forecasts for the first four months of the next year.
1
2
3
4
5
6
7
8
9
10
11
12
Month
Jan
Feb
Mar
Apr
May
Jun
Jul
Aug
Sep
Oct
Nov
Dec
Sales
51
55
54
57
50
68
66
59
67
69
75
73
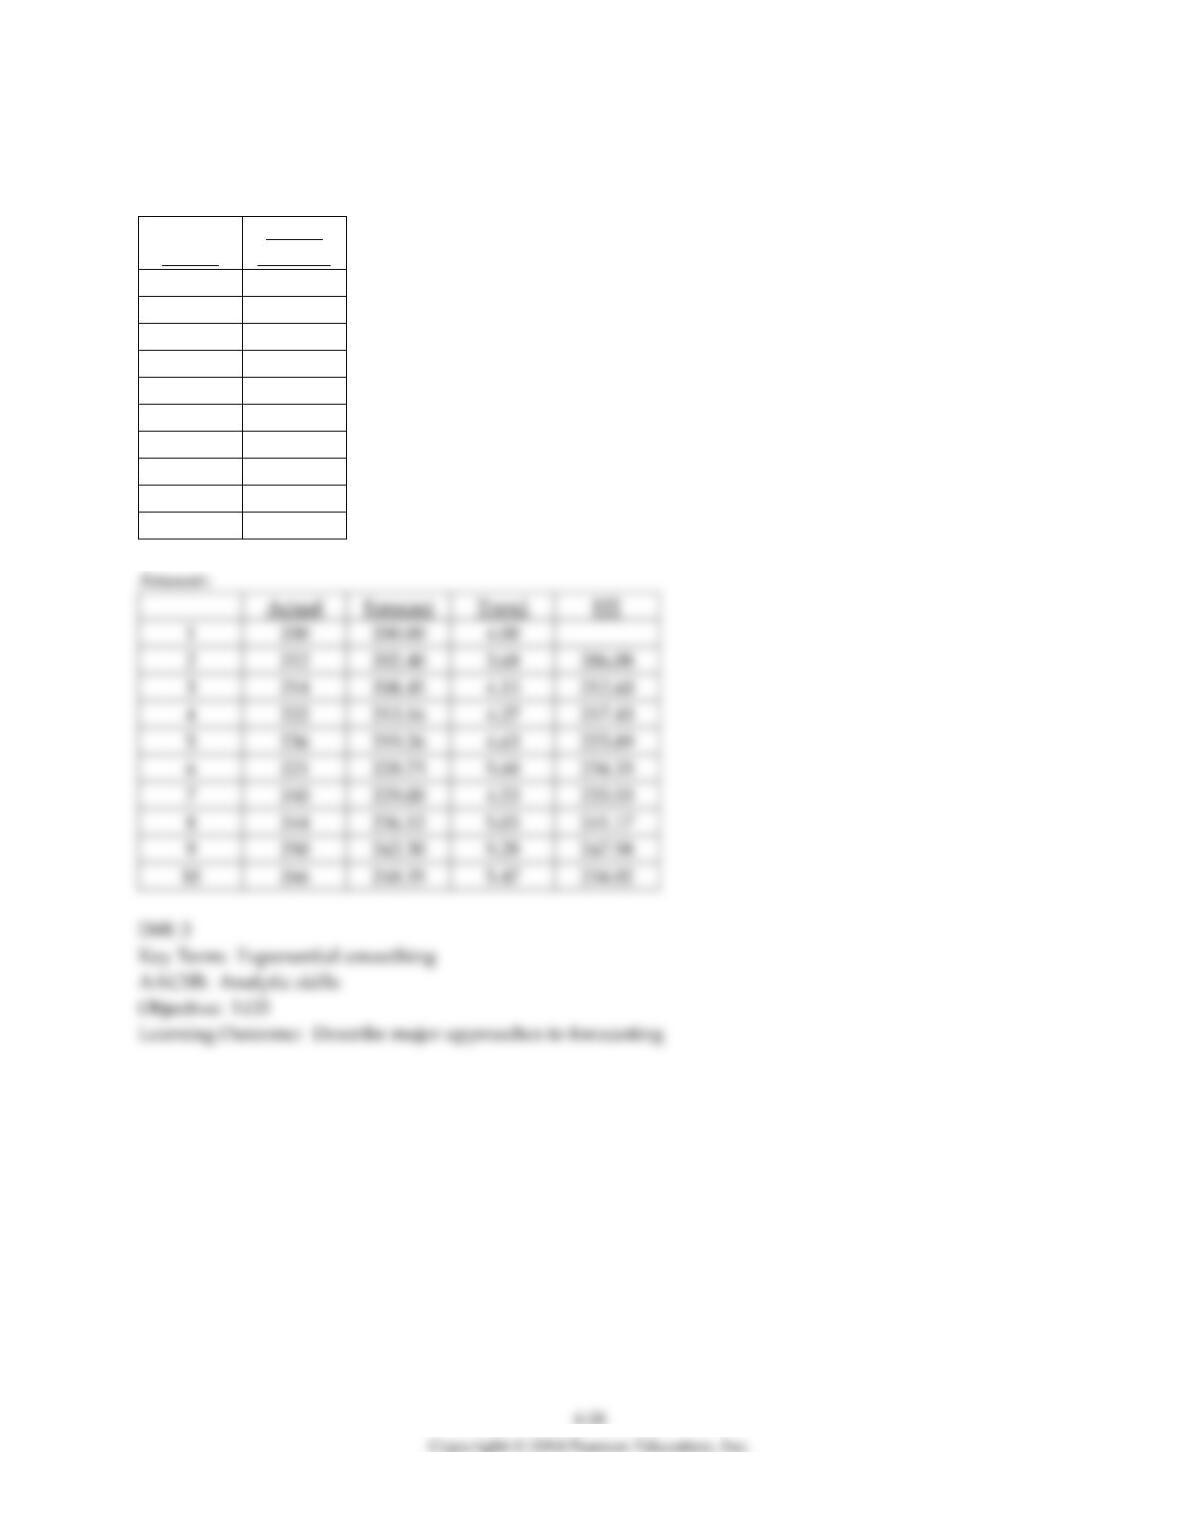
68) Use exponential smoothing with trend adjustment to forecast deliveries for period 10. Let alpha = 0.4,
beta = 0.2, and let the initial trend value be 4 and the initial forecast be 200.
Period
Actual
Demand
1
200
2
212
3
214
4
222
5
236
6
221
7
240
8
244
9
250
10
266
Actual
1
200
2
212
3
214
4
222
5
236
6
221
8
244
9
250
10
266
69) A restaurant has tracked the number of meals served at lunch over the last four weeks. The data show
little in terms of trends, but do display substantial variation by day of the week. Use the following
information to determine the seasonal (daily) indices for this restaurant.
Week
Day
1
2
3
4
Sunday
40
35
39
43
Monday
54
55
51
59
Tuesday
61
60
65
64
Wednesday
72
77
78
69
Thursday
89
80
81
79
Friday
91
90
99
95
Saturday
80
82
81
83
70) Demand for a certain product is forecast to be 8,000 units per month, averaged over all 12 months of
the year. The product follows a seasonal pattern, for which the January monthly index is 1.25. What is the
seasonally-adjusted sales forecast for January?
71) A seasonal index for a monthly series is about to be calculated on the basis of three years’
accumulation of data. The three previous July values were 110, 135, and 130. The average over all months
is 160. What is the approximate seasonal index for July?
72) Marie Bain is the production manager at a company that manufactures hot water heaters. Marie needs
a demand forecast for the next few years to help decide whether to add new production capacity. The
company’s sales history (in thousands of units) is shown in the table below. Use exponential smoothing
with trend adjustment to forecast demand for period 6. The initial forecast for period 1 was 11 units; the
initial estimate of trend was 0. The smoothing constants are α = .3 and β = .3
Period
Actual
1
12
2
15
3
16
4
16
5
18
6
20
Period
Actual
1
12
2
15
3
16
4
16
5
18
6
20
73) The quarterly sales for specific educational software over the past three years are given in the
following table. Compute the four seasonal factors.
YEAR 1
YEAR 2
YEAR 3
Quarter 1
1710
1820
1830
Quarter 2
960
910
1090
Quarter 3
2720
2840
2900
Quarter 4
2430
2200
2590