
Which of the following policy actions by the Fed would cause the money supply to
decrease?
a. An open-market purchase of government securities.
b. A decrease in required reserve ratios.
c. An increase in the discount rate.
d. A decrease in the discount rate.
A sub-discipline of economics that looks at the economy as a whole is:
a. macroeconomics.
b. microeconomics.
c. positive economics.
d. normative economics.
e. impossible to model.
Suppose that X and Y are substitute goods. If the price of good X increases, we can
expect:
a. the demand for good X to shift to the left.
b. an upward movement along the demand curve for good Y.

c. the demand curve for good Y to shift to the right.
d. a downward movement along the demand curve for good Y.
e. the demand curve for good Y to shift to the left.
In Exhibit 5-10, compute personal income (PI). Which of the following is correct?
a. $7,110 billion.
b. $7,410 billion.
c. $6,740 billion.
d. $7,760 billion.
e. $6,780 billion.
Use the aggregate expenditures model and assume an economy is in equilibrium at $5
trillion which is $250 billion below full-employment GDP. If the marginal propensity to
consume (MPC) is 0.60, full-employment GDP can be reached if government spending:
a. increases by $60 billion.
b. increases by $100 billion.
c. increases by $250 billion.
d. is held constant.

Unemployment that occurs from fundamental technological changes in the production,
or from the substitution of new goods for customary ones, is known as:
a. underemployment.
b. seasonal unemployment.
c. frictional unemployment.
d. structural unemployment.
e. cyclical unemployment.
Exhibit 17-2 Aggregate demand and aggregate supply curves
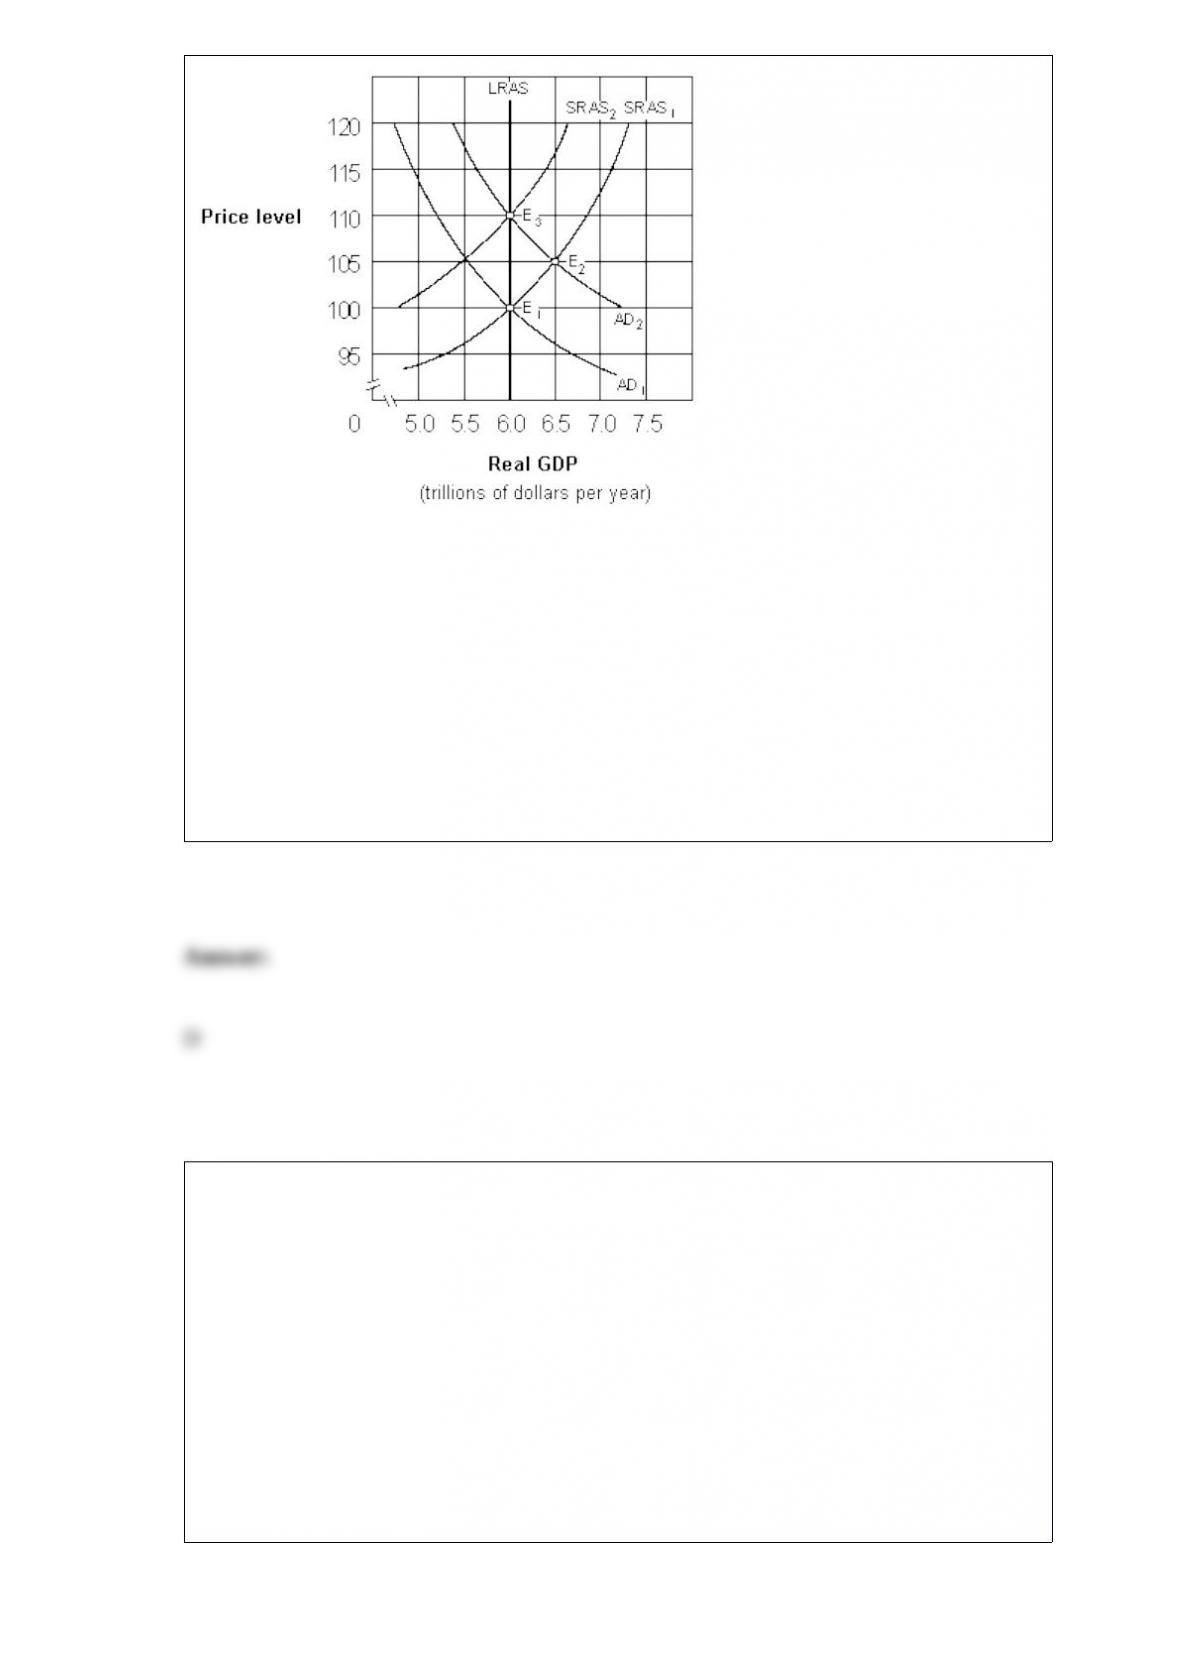
As shown in Exhibit 17-2, if
people behave according to rational expectations theory, an increase in the aggregate
demand curve from AD1 to AD2 will cause:
a. labor to adjust nominal wages sluggishly.
b. the aggregate supply curve to remain at SRAS1.
c. the price level to eventually rise from 100 to 110.
d. none of these.
Which of the following is true?
a. The production possibilities curve indicates that it will be impossible to expand total
output with the passage of time.
b. As long as resources are scarce, output cannot be increased.
c. The size of the economic pie is fixed, and therefore, if one individual has more
income, others must have less.
d. Over time, the output of goods and services can be increased through human
ingenuity and discovery of better ways of doing things.

The consumption function will shift upward if real asset and money holdings:
a. increase, if people expect prices to increase, if interest rates decrease, and if taxes
decrease.
b. increase, if people expect prices to increase, if interest rates increase, and if taxes
increase.
c. increase, if people expect prices to increase, if interest rates increase, and if taxes
decrease.
d. decrease, if people expect prices to decrease, if interest rates decrease, and if taxes
decrease.
e. decrease, if people expect prices to increase, if interest rates increase, and if taxes
decrease.
The GDP gap is the difference between:
a. full-employment real GDP and real GDP chain price index.
b. unemployment rate and real GDP chain price index.
c. actual real GDP and full-employment real GDP.
d. frictional unemployment and actual real GDP.

Exhibit 8-1 Disposable income and consumption data Disposable Income
(Y)Change in
Disposable IncomeConsumption
(C)
0 500
1,000 1,000 1,400
2,000 1,000 2,200
3,000 1,000 2,900
4,000 1,000 3,500
5,000 1,000 4,000 In Exhibit 8-1, when disposable income is increased from $2,000 to
$3,000 to $4,000,
a. total consumption increases by $1,000.
b. the marginal propensity to consume remains constant.
c. the marginal propensity to consume increases from 0.6 to 0.7.
d. the marginal propensity to consume decreases from 0.8 to 0.7.
e. the marginal propensity to consume decreases from 0.7 to 0.6.
The huge national debt of the United States is likely to lead to bankruptcy of the
national government.

In the aggregate expenditures model, if an economy operates below equilibrium GDP,
there will be unplanned inventory accumulation.
Adam Smith listed three types of motives for people holding money-transaction,
precautionary, and speculative.
If input prices increase, the supply curve for cheese will shift to the right.
Monetarists argue that the Fed should frequently adjust the money supply in response to
ever-changing economic conditions.

The aggregate supply curve shows the relationship between the price level and the level
of real GDP produced by the nation’s economy.
A proportional tax charges the same percentage of income, regardless of the size of
income.