The Phillips curve:
a. was relatively well-defined during the 1960s.
b. demonstrates how to achieve stable economic growth.
c. shows the trade-off between deficits and inflation.
d. helps to stimulate entrepreneurial profits.
e. becomes vertical at full employment.
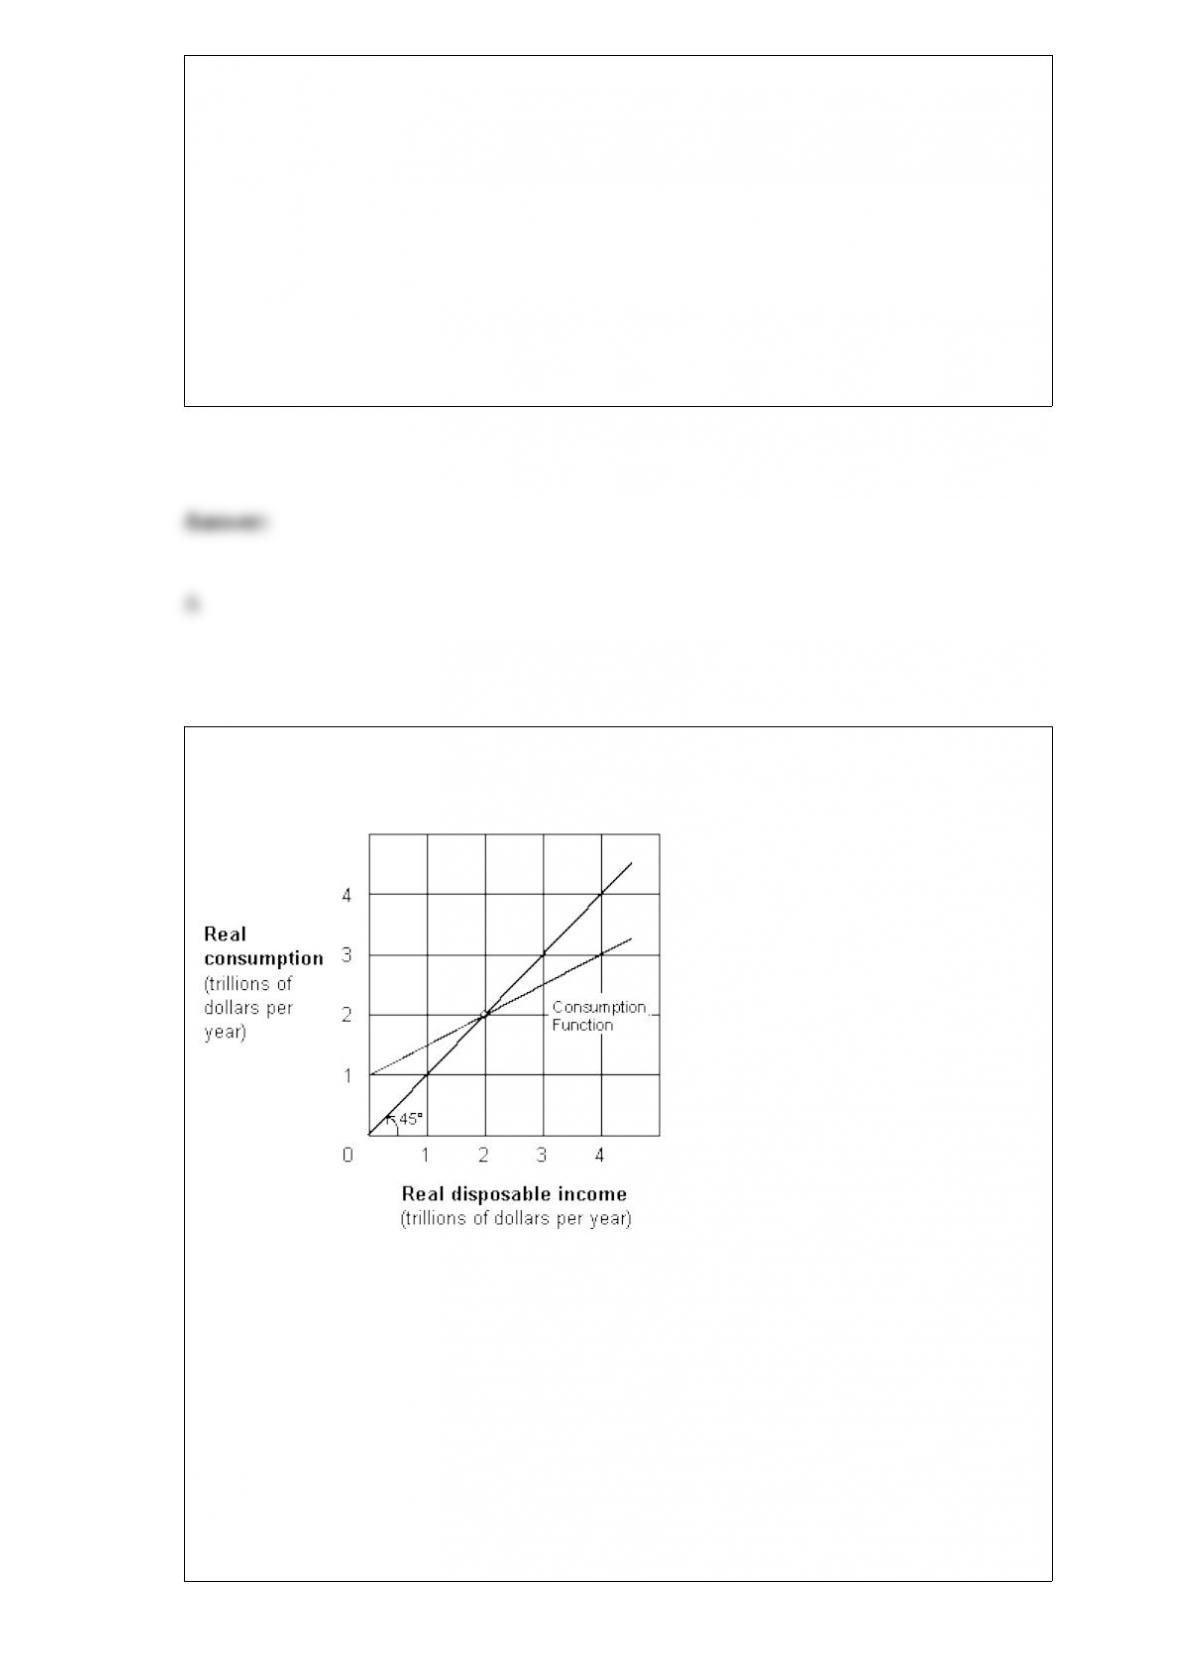
Exhibit 8-4 Consumption function
As shown in Exhibit 8-4, autonomous
consumption is:
a. 0.
b. $1 trillion.
c. $2 trillion.
d. $3 trillion.
e. $4 trillion.

As the interest rate decreases, the quantity of money people will hold:
a. decreases.
b. increases.
c. stays the same.
d. rises and then falls.
e. falls and then rises.
When an exchange rate is determined strictly by the demands and supplies for a nation’s
currency, it is called:
a. fixed.
b. arbitrage.
c. floating.
d. unilateral.
e. balance of payments.

According to rational expectations theory,
a. there is absolutely nothing government can do, even in the short run, to reduce the
economy’s unemployment rate.
b. the government can use fiscal policy such as increased government spending or
lower tax rates to reduce unemployment.
c. a modern extension of Keynesian economics exists.
d. discretionary fiscal policy is essential for prolonged growth.
e. market participants can be fooled in the long run by monetary and fiscal policy rules.
Exhibit 5-5 Gross domestic product data National income accountBillions of
dollars
Depreciation $ 500
Net interest 2,000
Compensation of employees 6,000
Profits 1,500
Rental income 200
Indirect business taxes 800
Social Security payments 1,000 As shown in Exhibit 5-5, using the income approach,
gross domestic product (GDP) is:
a. $8,000 billion.
b. $8,800 billion.
c. $9,400 billion.

d. $11,000 billion.
e. $12,000 billion.
Which of the following pairs of goods would be considered complementary?
a. Coca-Cola and Pepsi.
b. Computers and computer software.
c. Radios and televisions.
d. Mass transit and private automobiles.
e. Compact discs and cassette tapes.
Exhibit 10-8 Aggregate demand and supply
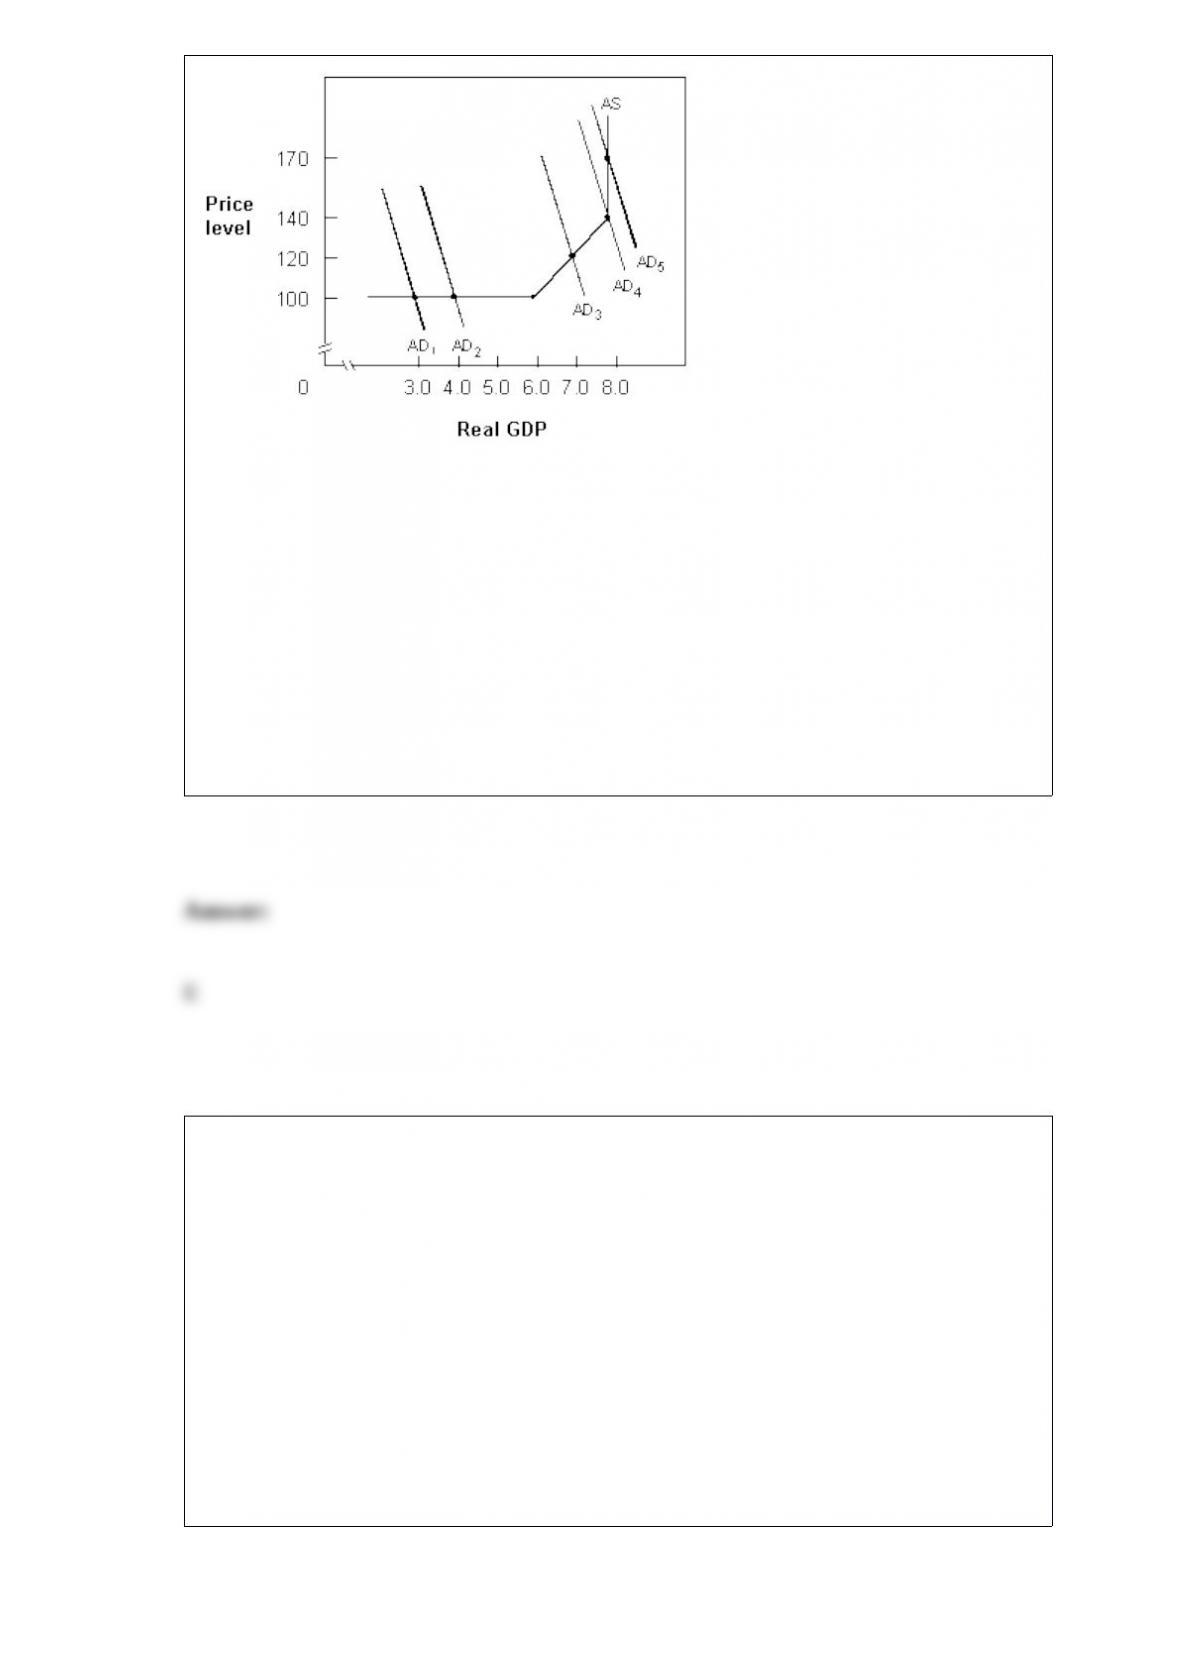
In Exhibit 10-8, if aggregate
demand shifts from AD3 to AD2, real GDP will:
a. fall from $7.0 to $4.0, and the price level will not change.
b. not change, and the price level will fall from 120 to 100.
c. fall from $7.0 to $3.0, and the price level will fall from 120 to 100.
d. fall from $8.0 to $4.0, and the price level will fall from 120 to 100.
e. fall from $7.0 to $4.0, and the price level will fall from 120 to 100.
Given full-employment output = $2,800, equilibrium output = $2,500, and MPS = 0.25,
which of the following changes would most likely bring the economy to a
full-employment level of national output?
a. $300 decrease in taxes.
b. $75 increase in government spending.
c. $75 decrease in taxes.
d. $300 increase in government spending.
e. $75 decrease in government spending.

Exhibit 8-3 Disposable income and consumption data Disposable
income
Consumption
SavingMarginal propensity to consume (MPC)Marginal propensity to save (MPS)
0 $100
100 175
200 250
300 325
400 400
500 475
600 550 Note: All amounts are in billions of dollars per year. As shown in Exhibit 8-3,
if disposable income is $100 billion, the marginal propensity to save (MPS) is:
a. 0.00.
b. 0.25.
c. 0.75.
d. 1.00.
The economic system in which the basic economic questions are answered through
markets with some government intervention is a:
a. command economy.

b. mixed economy.
c. market economy.
d. planned economy.
The unemployment rate is the percentage of the:
a. civilian labor force that is unemployed or working part-time.
b. civilian labor force that is unemployed.
c. civilian labor force that is unemployed less the number of government workers.
d. adult population that is unemployed.
e. adult population that is unemployed or looking for a better job.
In the aggregate expenditures model, if aggregate expenditures (AE) are less than GDP,
then:
a. inventory is unchanged.
b. inventory is depleted.
c. employment increases.
d. GDP decreases.

A shortage of product means a(n):
a. excess supply of the product.
b. excess demand of the product.
c. situation where the quantity demanded is less than the quantity supplied.
d. situation where the quantity supplied exceeds the quantity demanded.
e. situation where the current market price is too high.
Consumer surplus:
a. does not exist in equilibrium.
b. is illustrated by the area under the demand curve and above the market price.
c. is illustrated by the area under the demand curve and below the market price.
d. is illustrated by the area above the supply curve and under the demand curve.

Economics is the study of decisions made necessary by the problem of unlimited wants
and limited means to satisfy them.
If the marginal propensity to consume (MPC) is 0.90, the value of the spending
multiplier is 90.
Unplanned inventory depletion occurs when real GDP is above its equilibrium level.
The graph of a direct relationship will have a positive slope.

Incomes policies reject wage-price controls and guidelines.
Raising the required reserve ratio causes the money multiplier to increase.
Many public choice economists believe that elected political officials would make
better choices if they had to vote for higher taxes in order to adopt new spending
programs.
Social Security payments are included in personal income.

According to the adaptive expectations theory, people form their expectations of the
future on the basis of recent experiences.