
An increase in the equilibrium price of Japanese yen per dollar could be caused by a(n):
a. increase in the general level of prices in Japan.
b. increase in the U.S. demand for domestically-built automobiles.
c. decrease in the U.S. income relative to the income in Japan.
d. increase in the supply of dollars on the foreign market.
Tasha decides that when homes in her neighborhood are selling for $150,000 she will
not sell her home. When average prices rise to $175,000, she decides that she will put
her home on the market. This is an example of:
a. market demand.
b. market-day supply.
c. an excess supply of homes.
d. a positively-sloped supply curve.
e. a negatively-sloped supply curve.
Taryn Corporation The accountant for Taryn Corporation prepared the following list of
account balances from the company’s records for the year ended December 31, 2014:

Read the information for Taryn Corporation. Determine the following amounts for
Taryn Corporation. A) The balance of retained earnings at the end of 2014.
B) Thetotalstockholders’equityatthe end of2014.______________________ C) Name the two
events that might cause stockholders’ equity to increase.
The consumption function is drawn on a graph with disposable income on the
horizontal axis without including investment. Assume investment is autonomous and is
added to the consumption function. The effect is:
a. an upward adjustment in the vertical intercept.
b. no change in the adjustment in the vertical intercept.
c. an increase in the slope of the consumption schedule.
d. a decrease in the slope of the planned expenditure schedule.

The government agency that provides insurance for all checkable deposits up to
$100,000 in banks choosing its protection is the:
a. Federal Deposit Insurance Corporation.
b. Federal Reserve.
c. Office of Management and Budget.
d. Treasury.
e. Securities and Exchange Commission.
Which of the following is the most likely result of an increase in the minimum wage?
a. An increase in the employment of unskilled workers.
b. A decrease in the number of workers seeking minimum wage jobs.
c. An increase in the demand for unskilled workers.
d. A decrease in the employment of unskilled workers.

Because the banking system operates using fractional reserves,
a. the money multiplier is greater than one.
b. excess reserves are equal to zero.
c. required reserves are equal to 100 percent.
d. banks can loan out only their required reserves.
e. the money multiplier must be equal to zero.
A model (or theory):
a. is a general statement about the causal relationship between variables based on facts.
b. helps explain and predict the relationship between variables.
c. when expressed as a downward (negatively) sloping graph implies an inverse
relationship between the variables.
d. all of these.
In the aggregate demand and aggregate supply model,
a. the factors that cause the demand curves in both models to slope downward are the
same.

b. the factors that cause the supply curves in both models to slope upward are the same.
c. the upward-sloping aggregate demand curve intersects the downward-sloping
aggregate supply curve to determine the economy’s price level and GDP.
d. the upward-sloping aggregate supply curve intersects the downward-sloping
aggregate demand curve to determine the economy’s price level and GDP.
e. the price level never changes even with shifts in aggregate demand and aggregate
supply.
Which of the following is not a factor of production?
a. A computer chip.
b. The service of a lawyer. c. Dollars.
d. All of these are factors of production.
Which of the following is not a store of value?
a. Dollar bills.
b. Credit card.
c. Coins.
d. Gold.
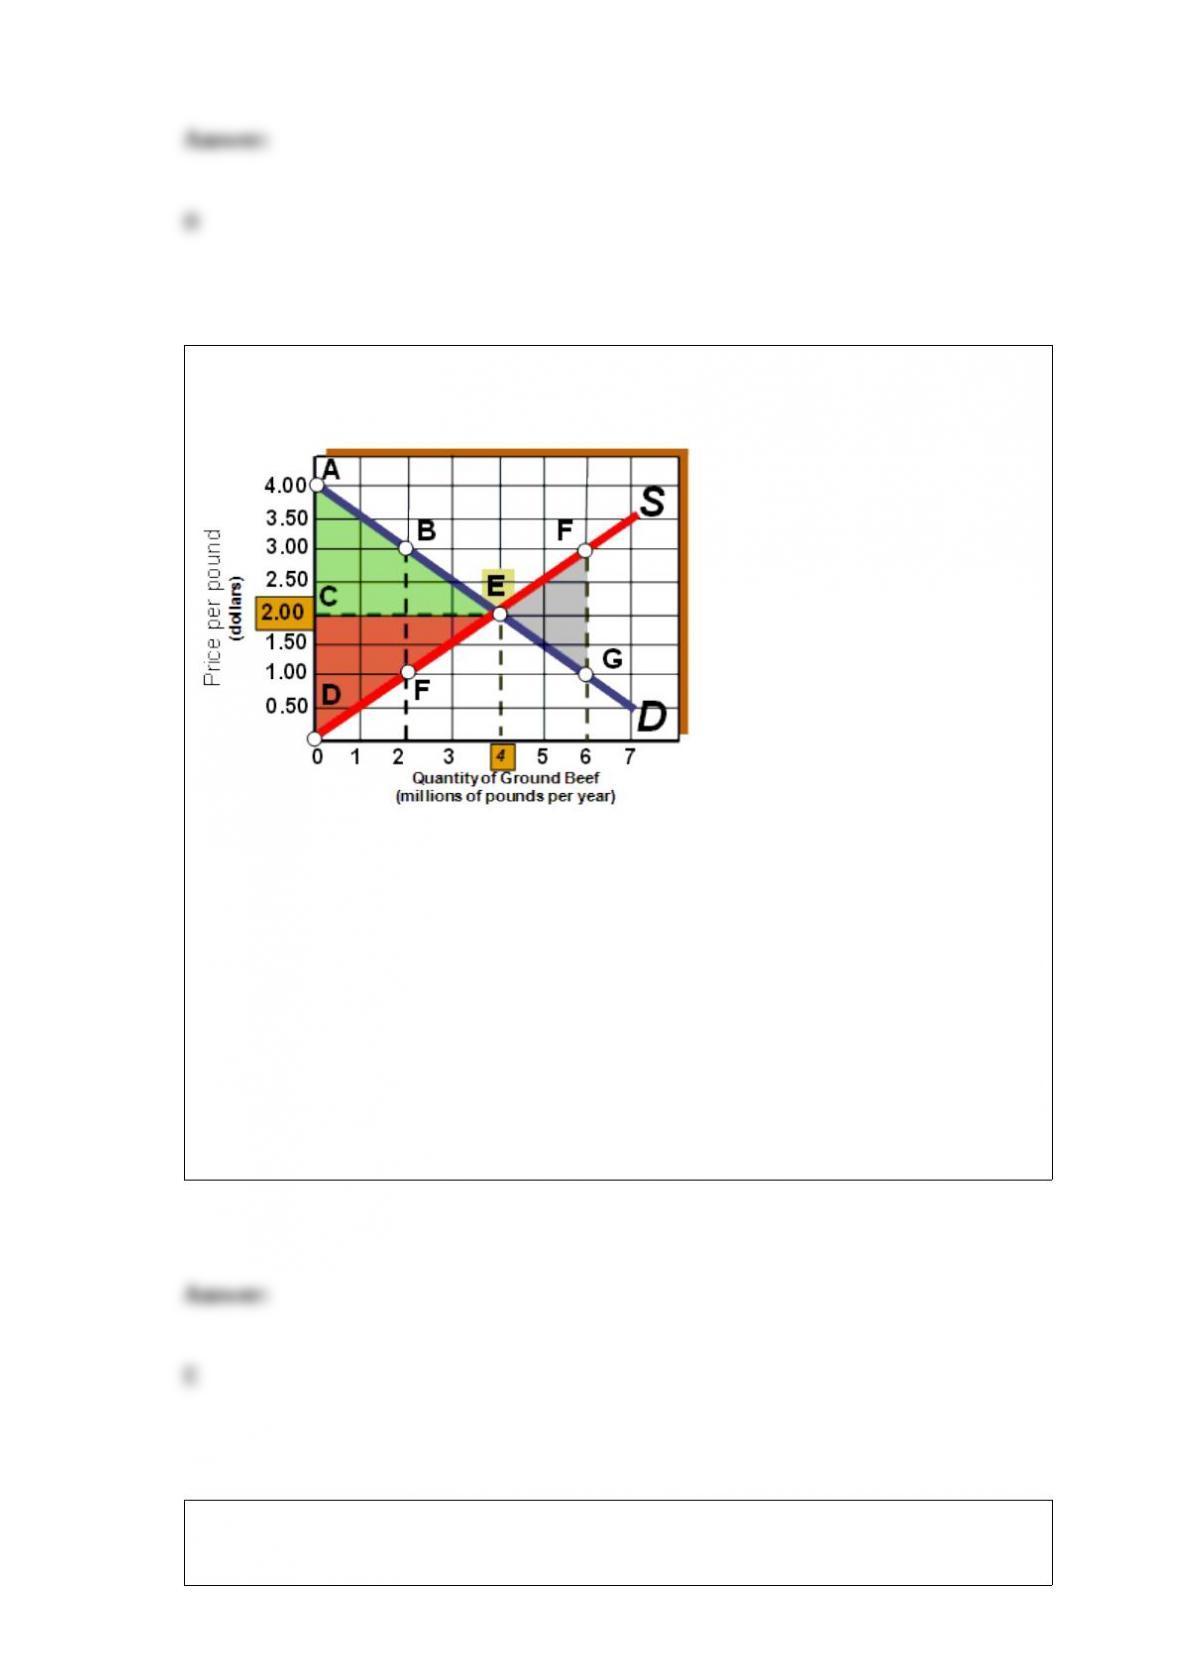
Exhibit 3A-1 Comparison of Market Efficiency and Deadweight Loss
As shown in Exhibit 3A-1, if the market price falls from $2.00 to $1.00, then:
a. consumer surplus increases.
b. producer surplus increases.
c. deadweight loss is eliminated.
d. all of the above are true.
e. none of the above are true.
Exhibit 8-1 Disposable income and consumption data Disposable Income
(Y)Change in
Disposable IncomeConsumption
(C)
0 500
1,000 1,000 1,400
2,000 1,000 2,200
3,000 1,000 2,900
4,000 1,000 3,500
5,000 1,000 4,000 In Exhibit 8-1, when disposable income (Y) is increased from $0 to
$1,000 to $2,000, the marginal propensity to consume:
a. is 1.
b. decreases from 0.9 to 0.8.
c. decreases from 0.8 to 0.7.
d. increases from 0.8 to 0.9.
e. is negative.
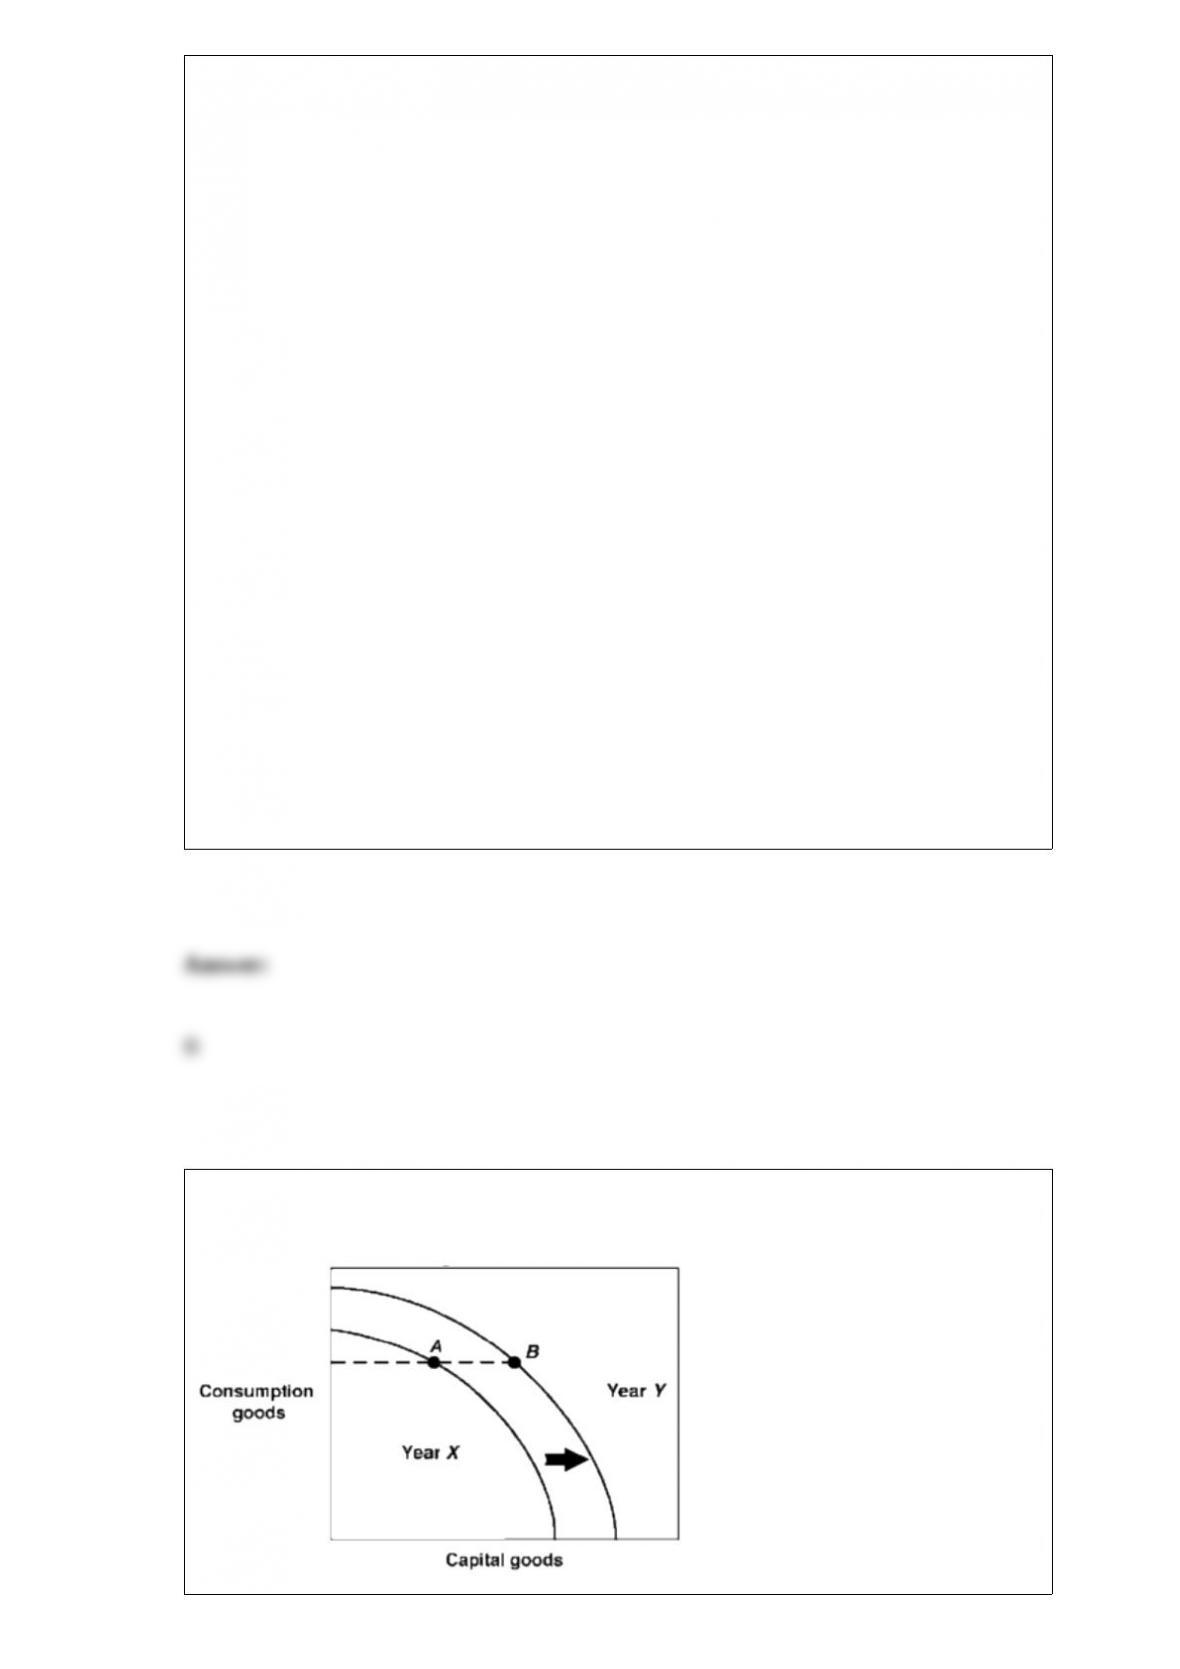
Exhibit 2-18 Production possibilities curves
In Exhibit 2-18, a country is located

at point A on its Year X production possibilities curve. In Year Y this same country is
located at point B on its Year Y production possibilities curve. Which of the following
could have brought about this outward shift in production possibilities curves?
a. More efficient production in Year X.
b. A natural disaster in Year X which leads to a destruction of resources.
c. Higher unemployment in Year X.
d. An advance in technology occurred in Year X.
Adam Smith was an advocate of:
a. mercantilism.
b. a nation maximizing its stock of gold.
c. unrestricted or free trade.
d. the visible hand of public interest.
Which one of the following is a positive economic statement?
a. An increase in the minimum wage will reduce employment for teenagers.
b. The minimum wage should be increased.
c. Social justice will be served by increasing the minimum wage.

d. Thoughtful people oppose an increase in the minimum wage.
Which of the following is counted as part of M2?
a. Currency.
b. Checkable deposits.
c. Money-market mutual funds.
d. All of these.
Using a production possibilities curve, an economy that produces an output
combination less than the maximum possible is depicted by a point located:
a. at the top corner of the curve.
b. near the middle of the curve.
c. at the bottom corner of the curve.
d. outside the curve.
e. inside the curve.
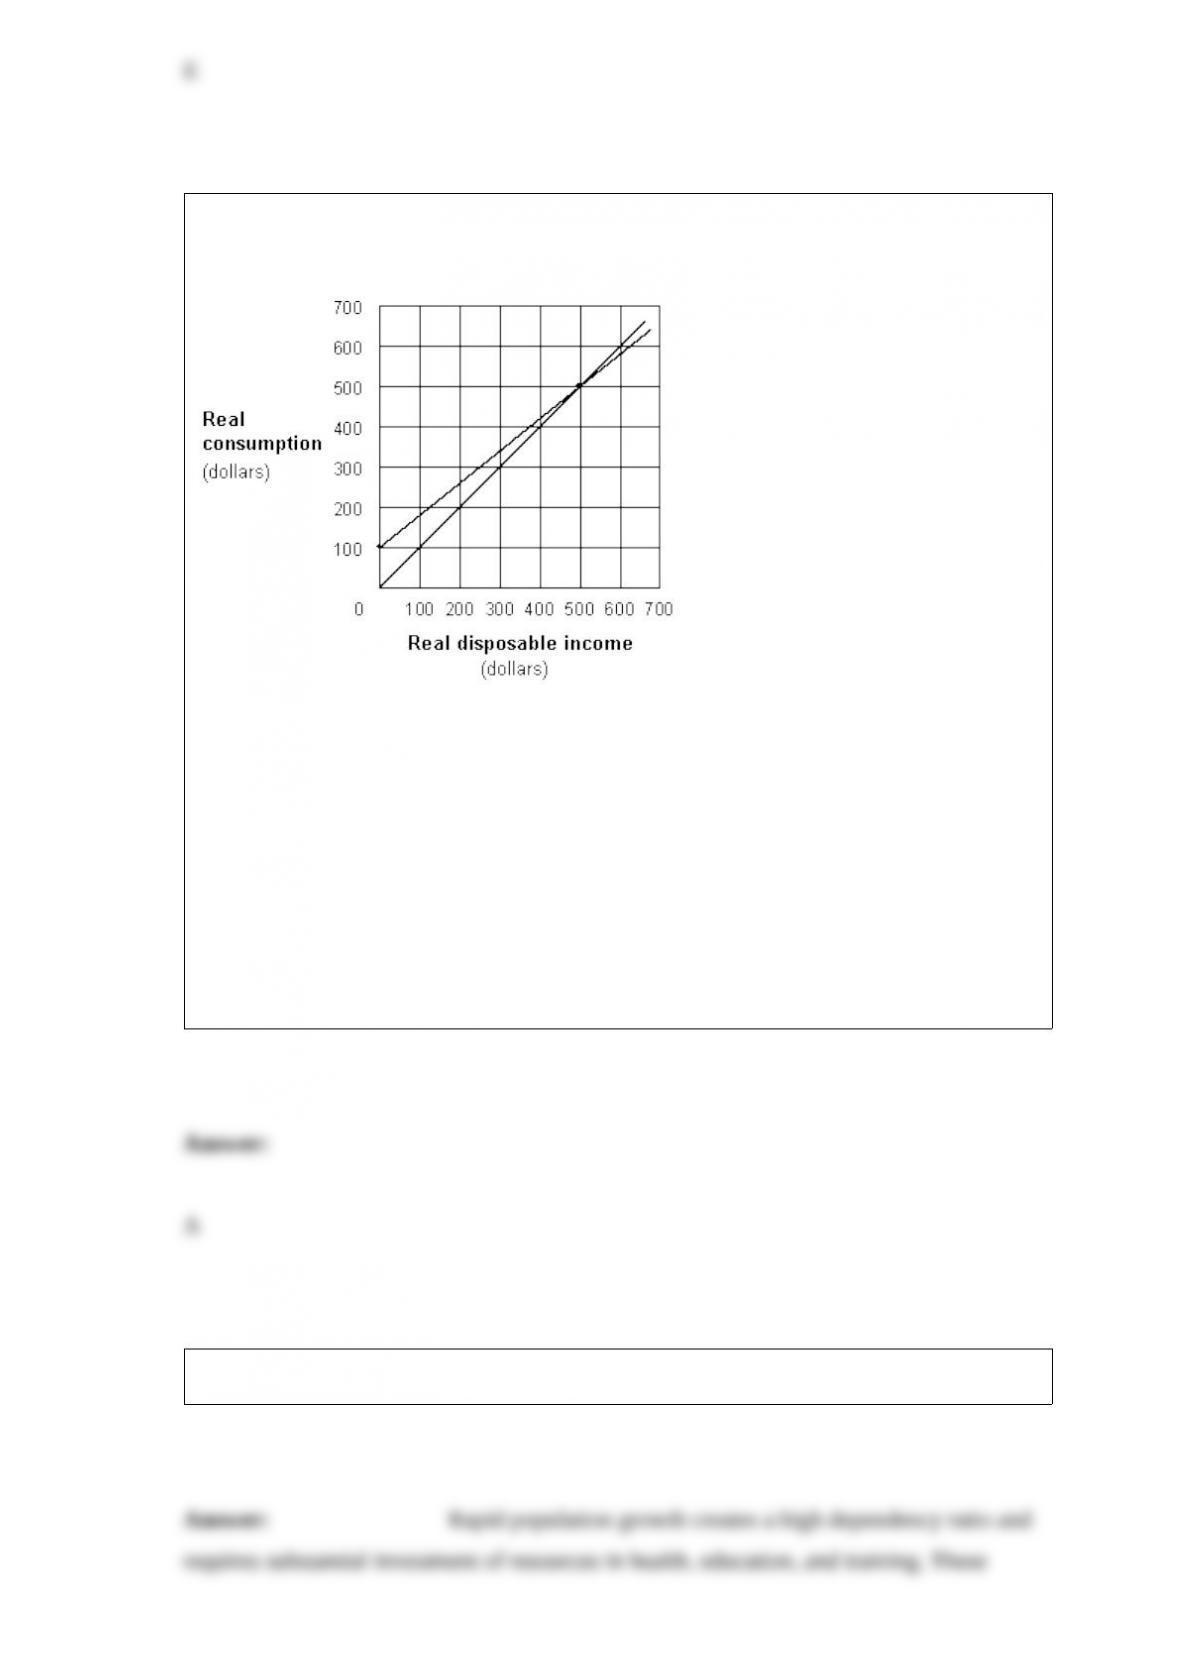
Exhibit 8-9 Consumption function
In Exhibit 8-9, the level of
autonomous consumption for consumption function C is:
a. $100.
b. $150.
c. $50.
d. $0.
e. $200.
What role does population growth play in economic development?
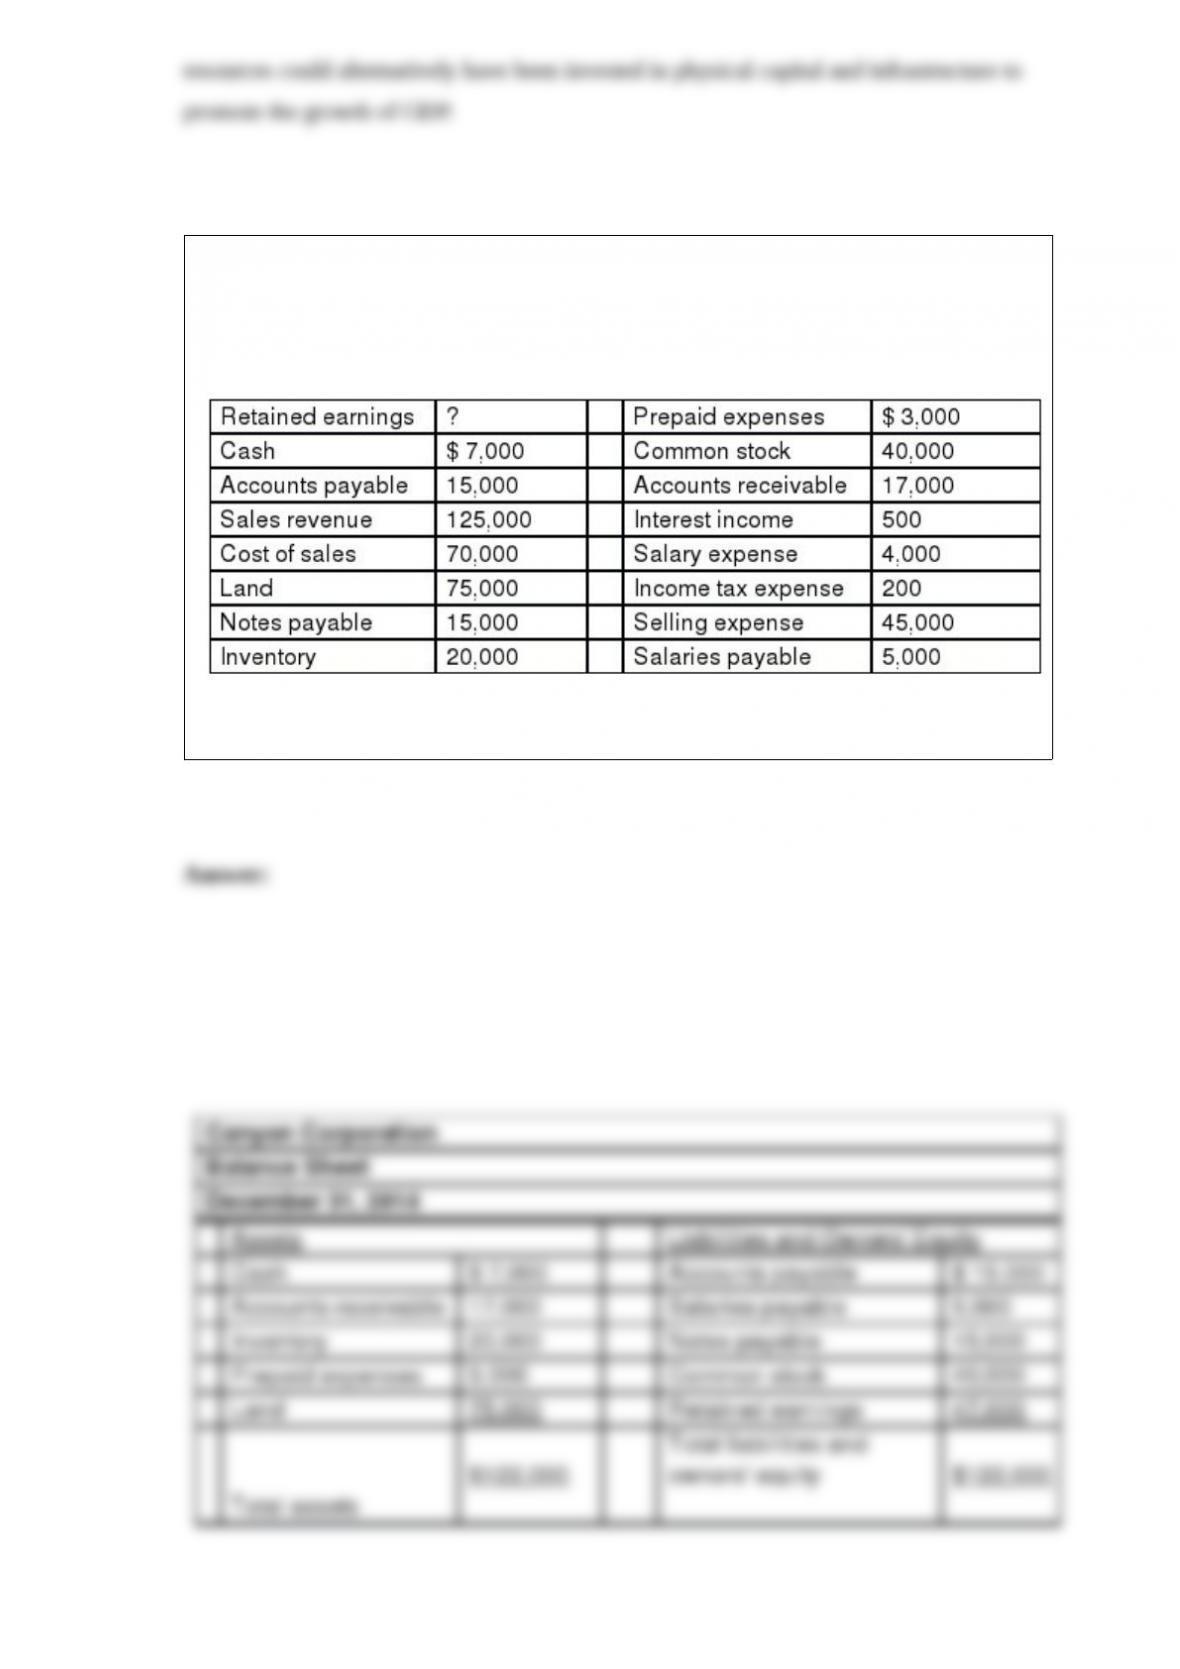
Canyon Corporation
The accountant for the Canyon Corporation prepared the following list from the
company’s accounting records for the year ended December 31, 2014:
Read the information for Canyon Corporation. Using good form, prepare a Balance
Sheet for the Canyon Corporation.

The basic approach in marginal analysis is to compare a policy’s total benefits with its
total costs.
According to the text, Singapore and Hong Kong are classified as industrially advanced
countries (IACs).
Rational ignorance might explain low voter turnout because people apply marginal
analysis to voting.