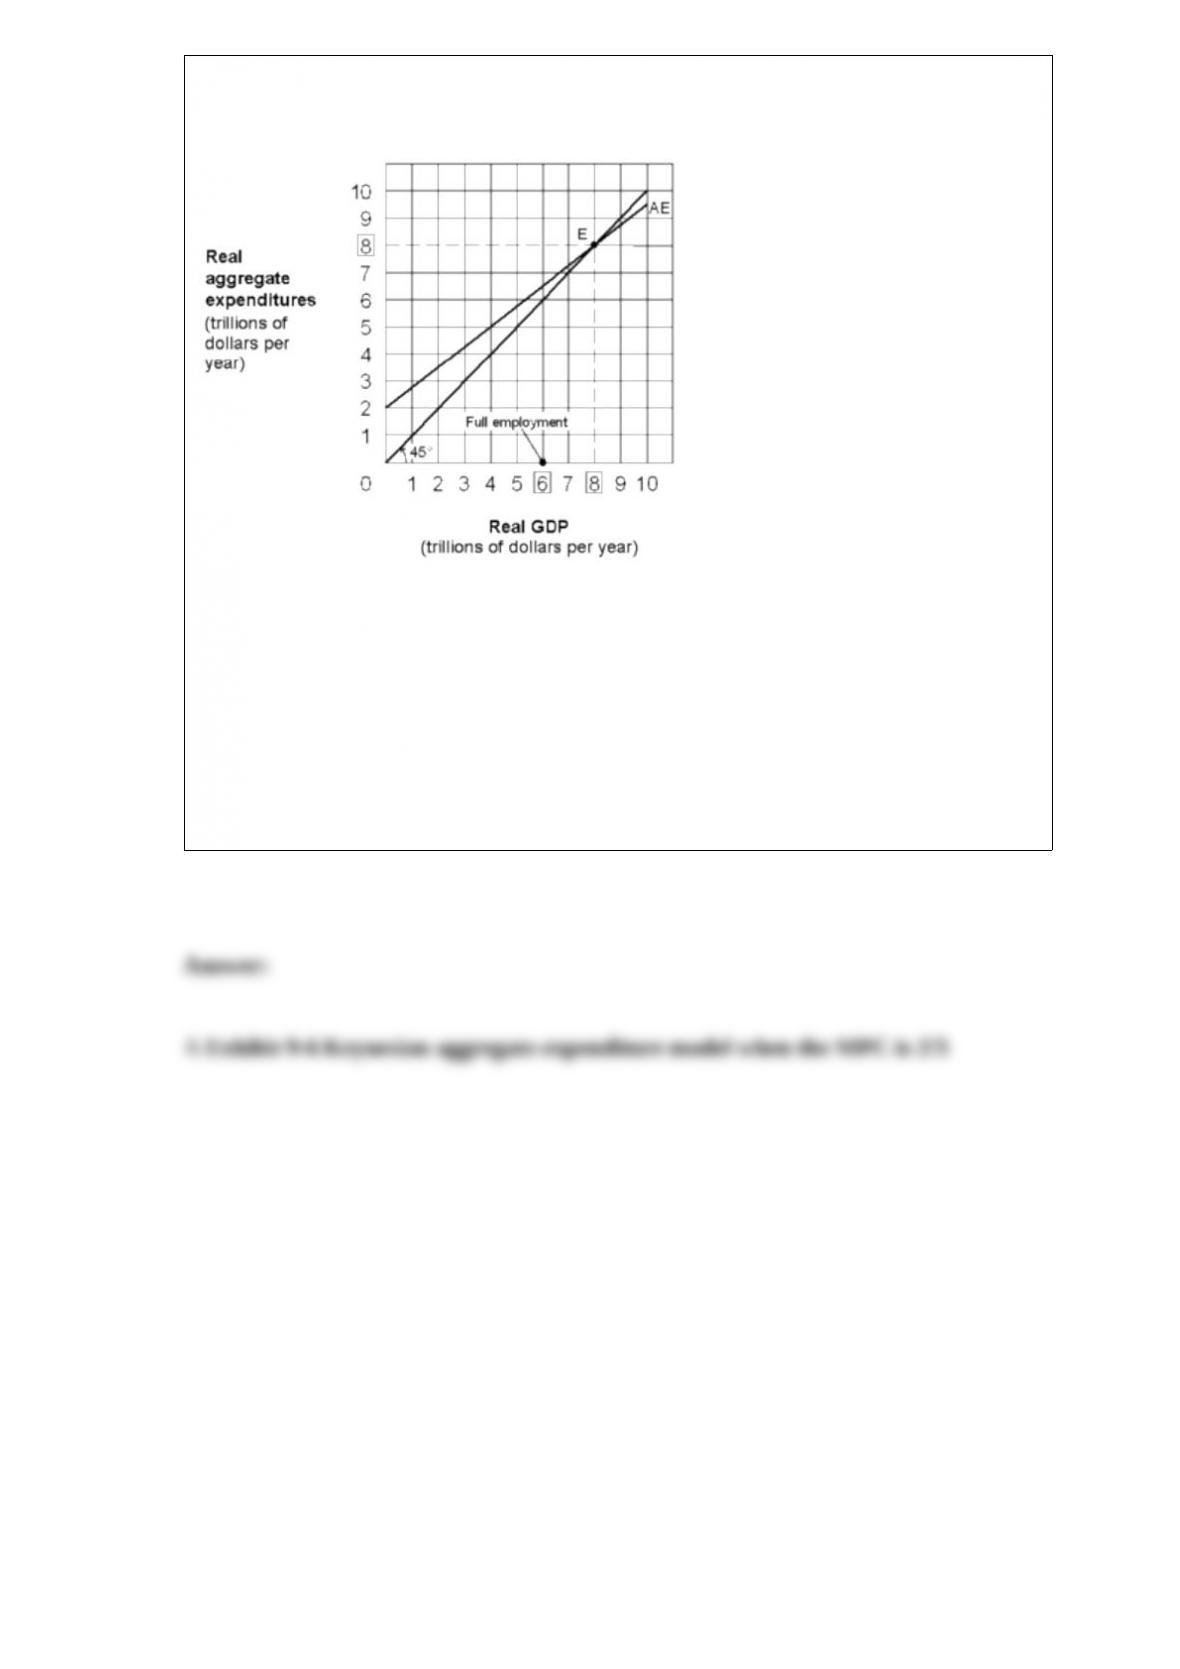
Exhibit 9-5 Keynesian aggregate-expenditures model where the MPC is 0.75
To eliminate the GDP gap shown in
Exhibit 9-5, the government should cut its spending by:
a. $0.5 trillion.
b. $1 trillion.
c. $1.5 trillion.
d. $2 trillion.
Coffee and tea are:
a. complements.
b. substitutes.
c. inferior goods.
d. unrelated goods.
e. nonmarket goods.
Which of the following groups of people are counted as employed?
a. People who work at least one hour a week.
b. People who work at least 15 hours a week as unpaid employees of a family business.
c. People who are out of work due to bad weather.
d. All of these are counted as employed.

The economic system that answers the What, How and For Whom questions using
prices determined by the interaction of supply and demand is a:
a. market economy.
b. command economy
c. soviet economy.
d. traditional economy.
Which of the following will shift the consumption function upward?
a. A tax increase.
b. Higher capacity utilization rates.
c. Higher disposable income.
d. Lower wealth holdings.
e. Expectations of inflation.

The law of demand states that:
a. as the price of a good increases, more units are demanded.
b. there is a direct relationship between the price of a good and the quantity of the good
produced.
c. there is a negative relationship between the price of a good and the quantity of the
good demanded.
d. there is an increase in the need for a good as the price of the good increases.
The natural progression in items from one statement to another and preparation of
financial statements is best represented by the following order:
a. Balance sheet and statement of cash flows > statement of retained earnings > income
statement
b. Balance sheet and statement of cash flows > income statement > statement of
retained earnings.
c. Statement of retained earnings > income statement > balance sheet and statement of
cash flows
d. Income statement > statement of retained earnings > balance sheet and statement of
cash flows
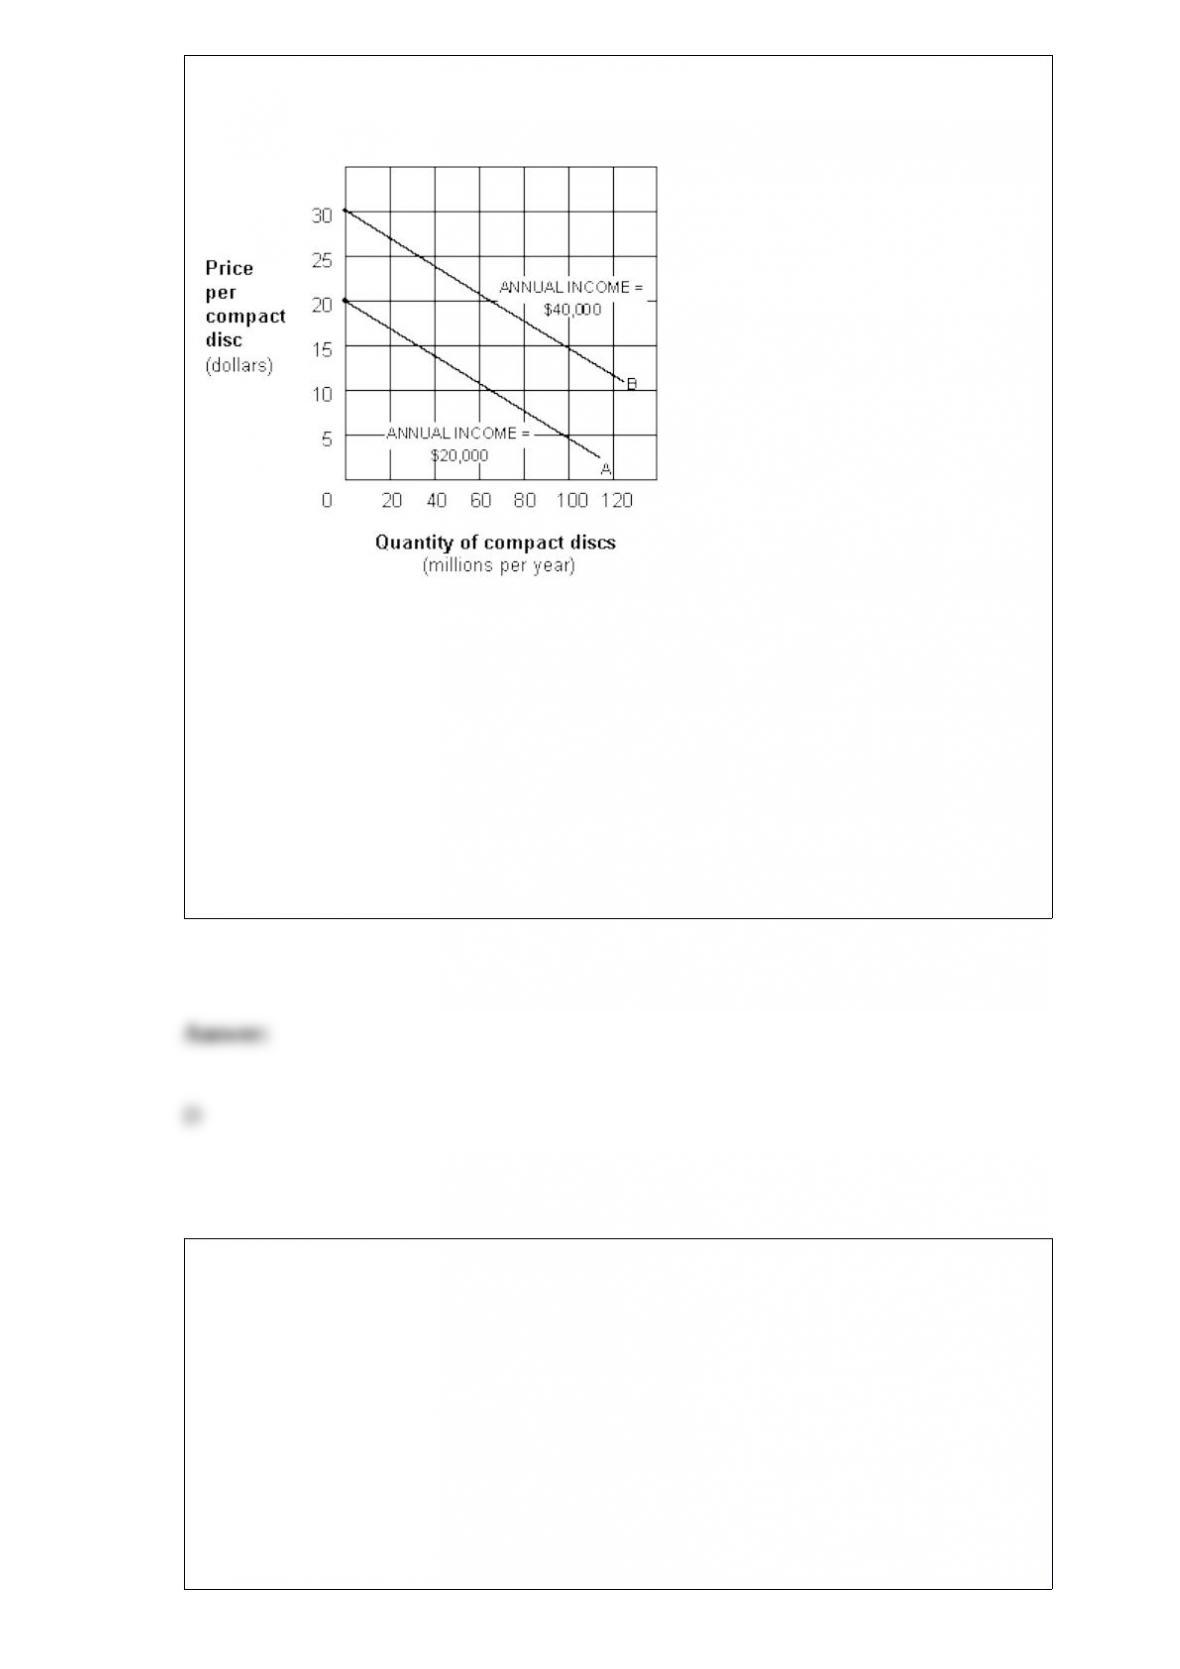
Exhibit 1A-10 Multi-curve graph
Exhibit 1A-10 represents a three-variable relationship. As the annual income of
consumers rises from $20,000 (line A) to $40,000 (line B), the result is a:
a. rightward movement along each curve.
b. leftward movement along each curve.
c. leftward shift in curve B to curve A.
d. leftward shift in curve A to curve B.
Which of the following is infrastructure?
a. Police.
b. Training and education.
c. Highways.
d. All of the above.
e. None of the above.

Assume the economy is operating at a real GDP above full-employment real GDP.
Classical economists would prescribe which of the following policies?
a. Nonintervention
b. Active monetary policy
c. Contractionary
d. Expansionary
SeveralitemsfromthefinancialstatementsofStandardTiresarelistedbelow.Usethefollowing
answerchoicestoidentifythetypeofaccountforeachitemlisted.Placeyouranswersinthespac
eprovided.
a. Assets
b. Liabilities
c. Revenues
d. Expenses
e. Owners’ equity Cash

If your bank faces a 20 percent required reserve ratio and receives a checkable deposit
of $4,000, it can make additional loans worth a maximum of:
a. $800.
b. $3,200.
c. $4,000.
d. $16,000.
e. $20,000.
If Matt Taylor gets his $800 loan from the Paris First National Bank in cash rather than
in the form of a new checkable deposit, the:
a. Paris First National Bank will get $800 in new reserves.
b. Paris First National Bank will not get $800 in new reserves.
c. assets of the Paris First National Bank will increase by $800.
d. assets of the Paris First National Bank will decease by $88.
e. liabilities of the Paris First National Bank will increase by $800.
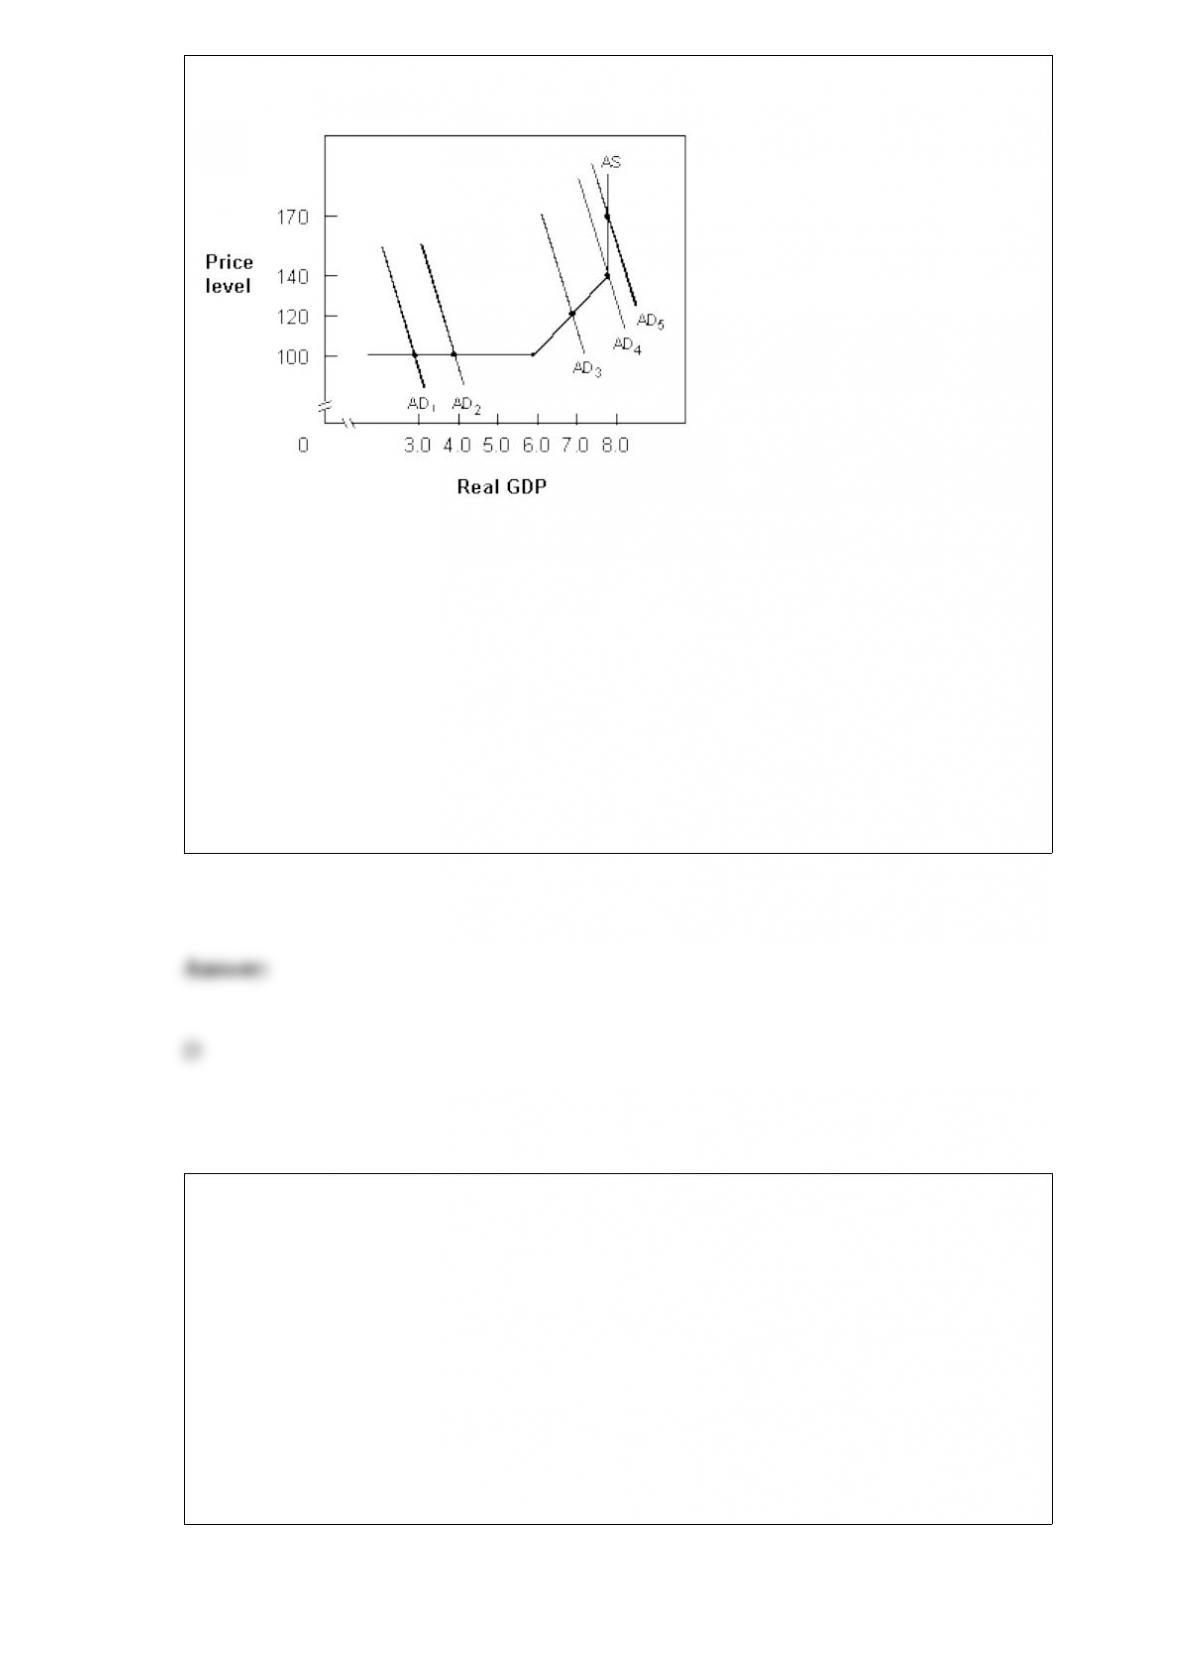
Exhibit 10-8 Aggregate demand and supply
In Exhibit 10-8, when aggregate
demand shifts from AD4 to AD5, the economy experiences:
a. cost push-inflation.
b. cost-pull inflation.
c. demand-push inflation.
d. demand-pull inflation.
e. price-pull inflation.
A demand curve shows the relationship between:
a. price and quantity demanded.
b. the demand and supply schedules.
c. demand and supply equilibrium.
d. leakages and injections.
e. price and technology.

If an inflationary boom exists, the appropriate fiscal policy is to:
a. increase the budget deficit.
b. increase government spending and hold taxes constant.
c. decrease government spending and/or raise taxes.
d. hold government spending constant and decrease taxes.
Exhibit 4-10 Supply and demand data for apricots Bushels demanded
per monthPrice per
bushelBushels supplied
per month
50 $5 80
55 4 75
60 3 70
65 2 65
70 1 55 In Exhibit 4-11, the equilibrium price per bushel of wheat is:
a. $1.
b. $2.
c. $3.
d. $4.
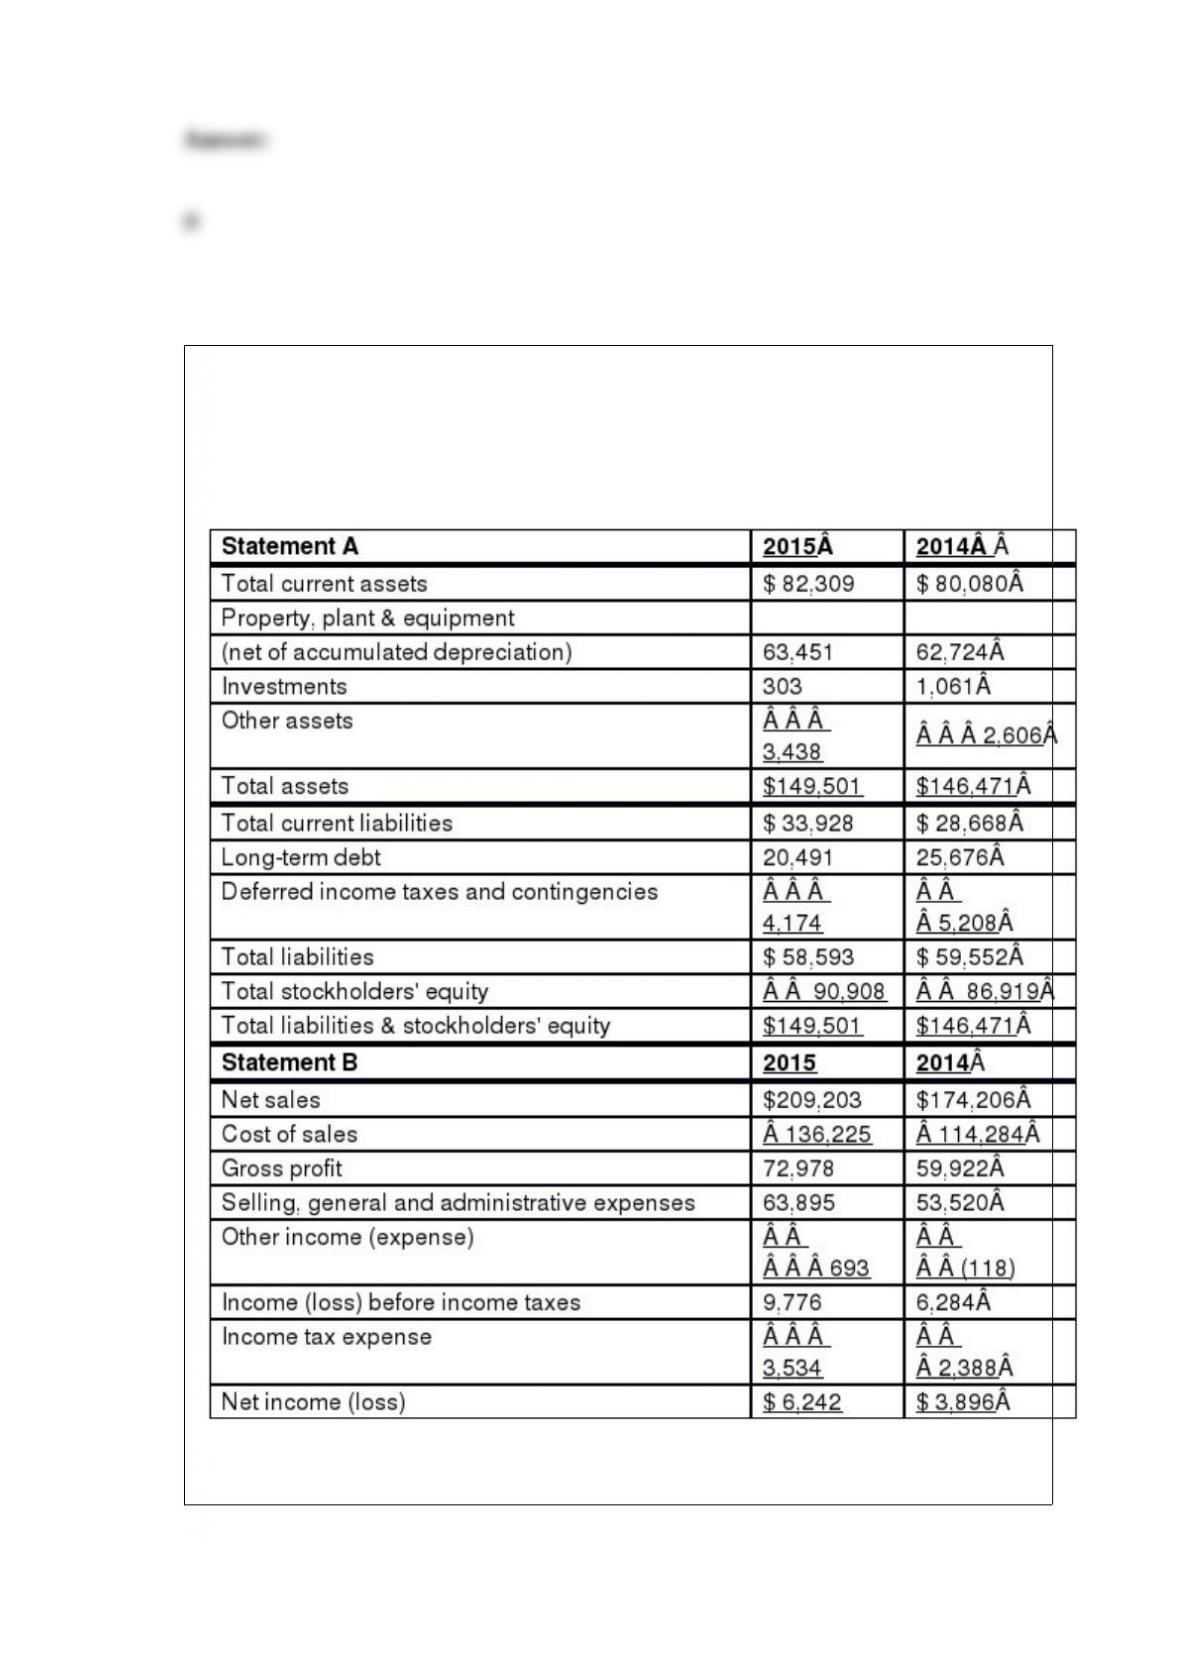
Presented below are condensed data from the financial statements of Faux Factory for
2015 and 2014. The figures are expressed in thousands. Use this information to answer
the questions that follow.
1> What is the name of Statement A?
2> What is the name of Statement B?
The four phases of a single business cycle are, in order, the trough, followed by a
recovery, then a recession, ending with a peak.
It is possible for a nation to have an absolute advantage in the production of a product,
but not a comparative advantage in the production of the same product.
The required reserve ratio is required reserves stated as a percentage of the money
supply.
The circular flow model illustrates that aggregate spending in the product markets
equals 70 percent of aggregate income earned in the factor markets.
The greater the marginal propensity to consume in the economy, the smaller the
spending multiplier.
A public good is any good or service that users collectively consume and there is no
way to bar free riders.
A new major league baseball expansion team is moving to your town. It will inject
consumer spending worth $40 million into your local economy initially. The Chamber
of Commerce predicts that this will generate a total of $500 million in additional
spending for your town. The team owners think that this is an underestimate. What do
you need to know to figure out who is right? Explain.
The net exports effect is the direct relationship between net exports and the price level
of an economy.
Other things being equal, an increase in the price of aspirin will decrease the demand
for aspirin.