Unlock document.
This document is partially blurred.
Unlock all pages and 1 million more documents.
Get Access
KEY: Bloom's: Application NOT: 5 min.
10. The following information is summarized from the balance sheets of Kress Inc. and Ross Corp. at
December 31, 2013. Neither company has inventory.
Kress
Ross
Current Assets:
Cash and cash equivalents
$ 340,800
$100,200
Short-term investments
12,000
7,600
Accounts receivable, net
377,000
42,000
Notes receivable, net
36,300
18,000
Prepaid assets
207,400
40,000
Total current assets
$ 973,500
$207,800
Current liabilities
$ 860,900
$150,000
Other liabilities
5,000,400
300,500
Stockholders' equity
2,400,300
800,700
1.
Using the information provided above, compute the following for each company at
December 31, 2013:
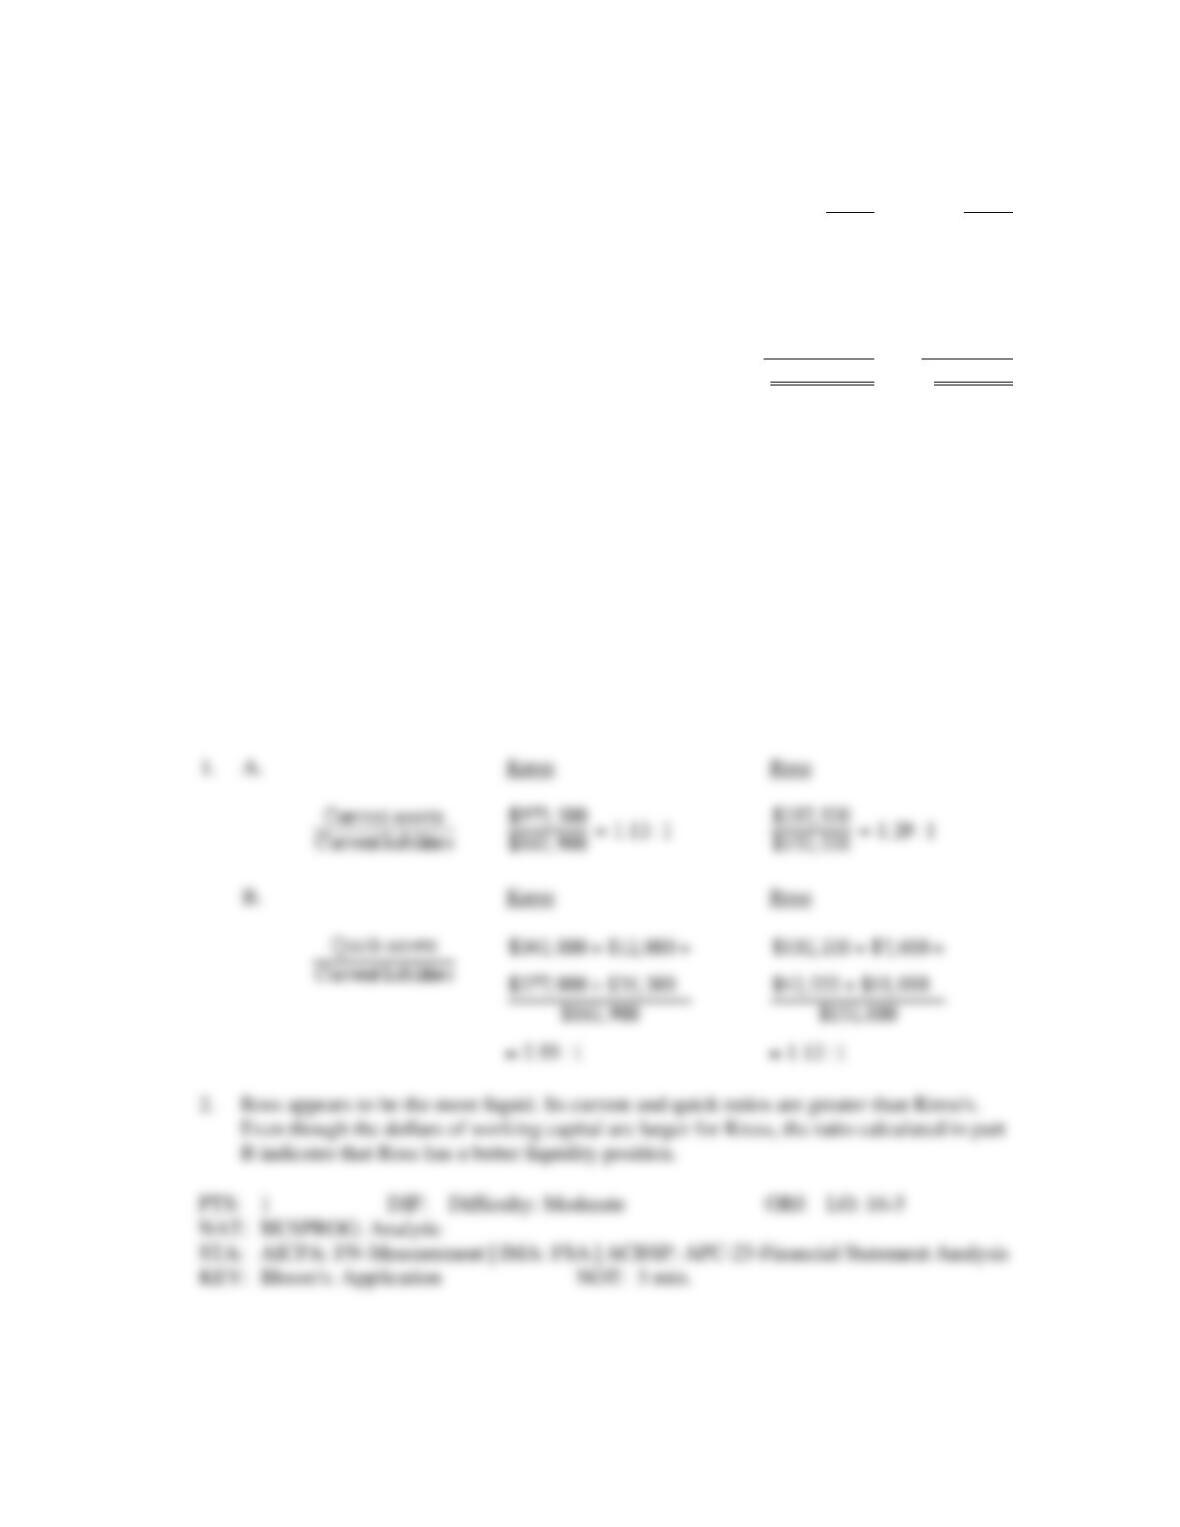
A.
Current Ratio
B.
Quick Ratio
2.
Comment briefly on the liquidity of each of these two companies. Which company appears
to be the most liquid?
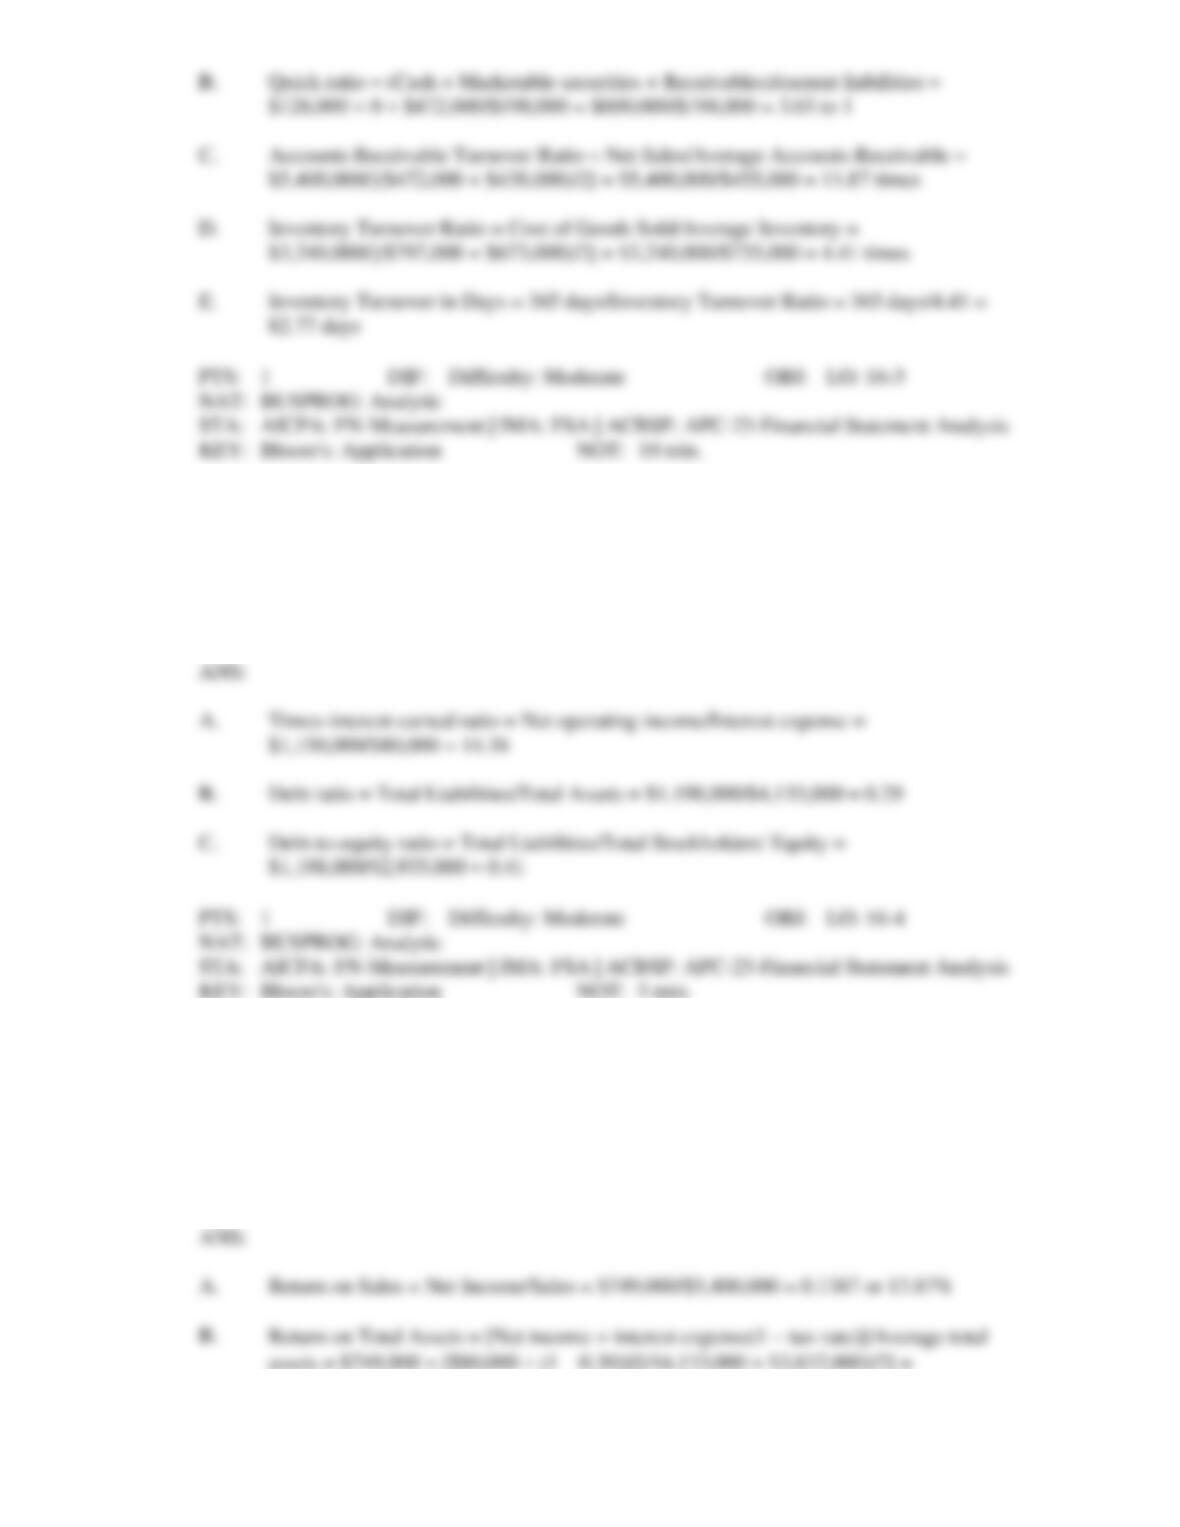
ANS:
Figure 16-5.
The following information that was obtained from the 2014 and 2013 financial statements of James
Company, Norris Corporation, and Zorro Company:
(In millions)
James
Norris
Zorro
Accounts receivable
12/31/14
$ 33,000
$ 22,000
$ 41,500
12/31/13
30,000
12,800
42,600
Inventory
12/31/14
$ 2,600
$ 12,600
$ 54,200
12/31/13
23,900
32,800
44,000
Net sales (Credit)
2014
$620,000
$320,000
$510,000
2013
610,000
310,000
760,000
Cost of goods sold
2014
$211,000
$406,000
$311,000
2013
156,000
200,000
310,000
11. Refer to Figure 16-5. Compare the three companies and answer the following:
A.
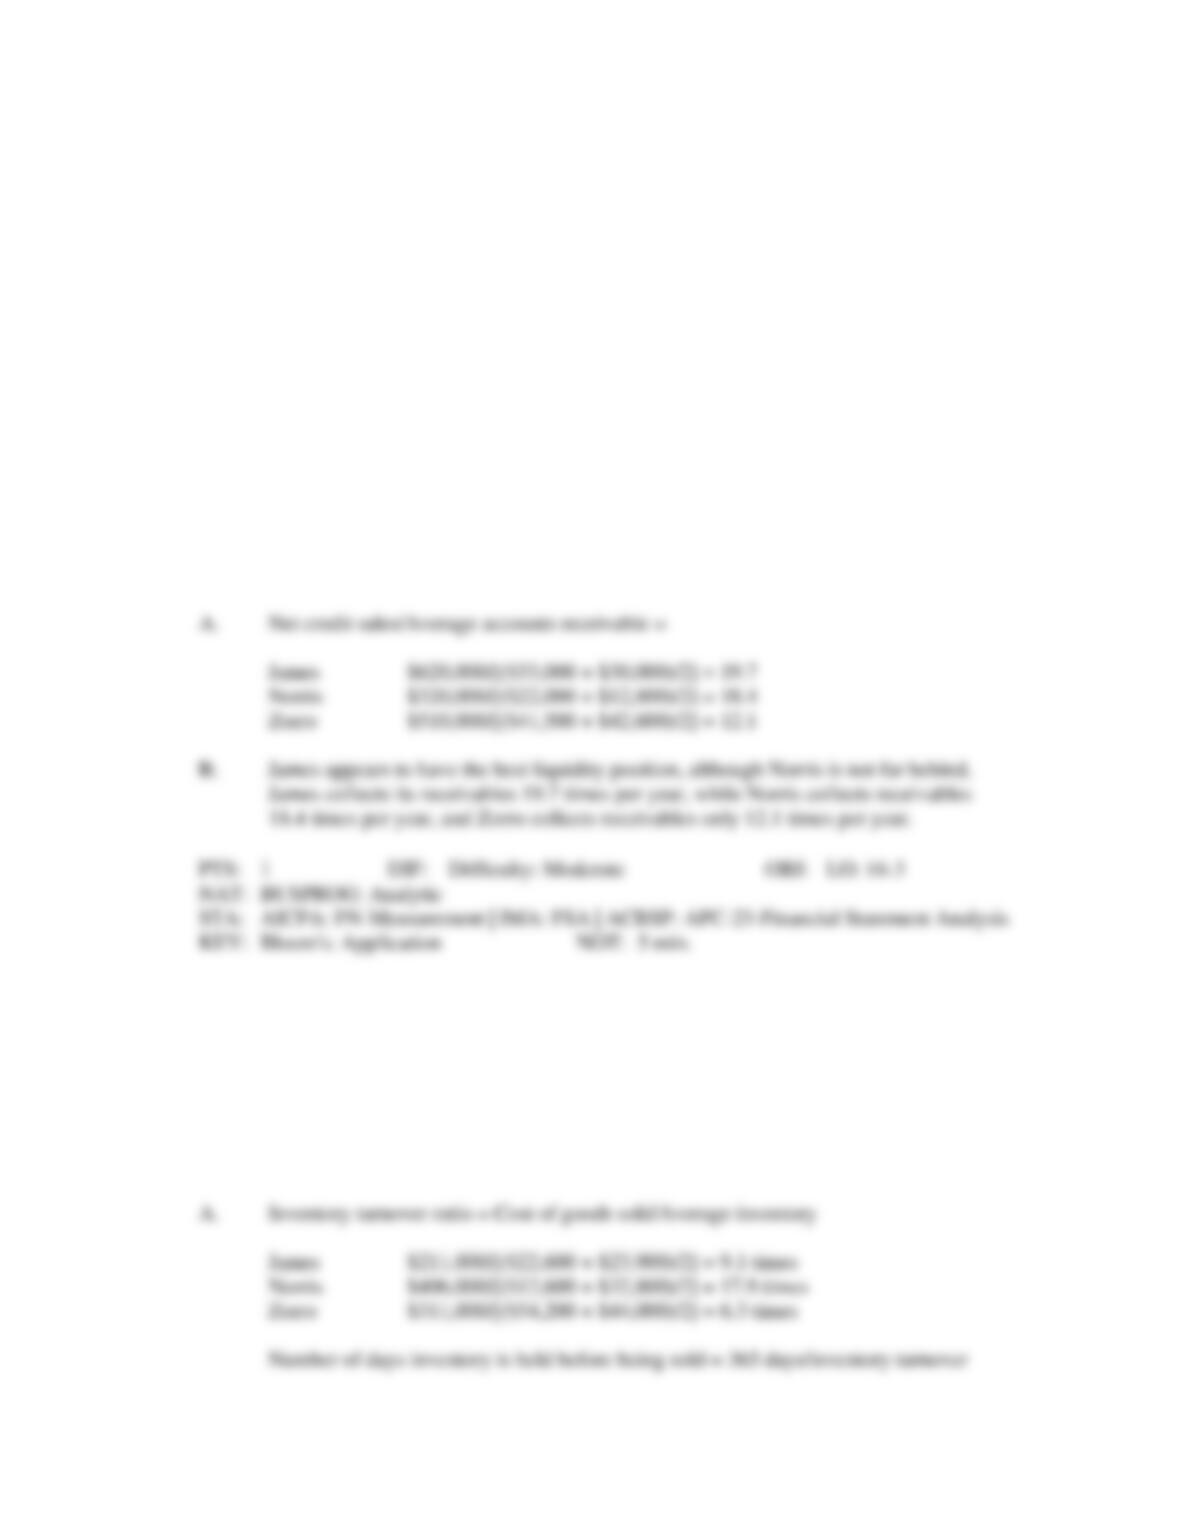
Compute the accounts receivable turnover ratio for each company for 2014.
B.
Which company appears to have the best liquidity position based solely on the
accounts receivable turnover? Explain.
ANS:
12. Refer to Figure 16-5. Compare the three companies and answer the following:
A.
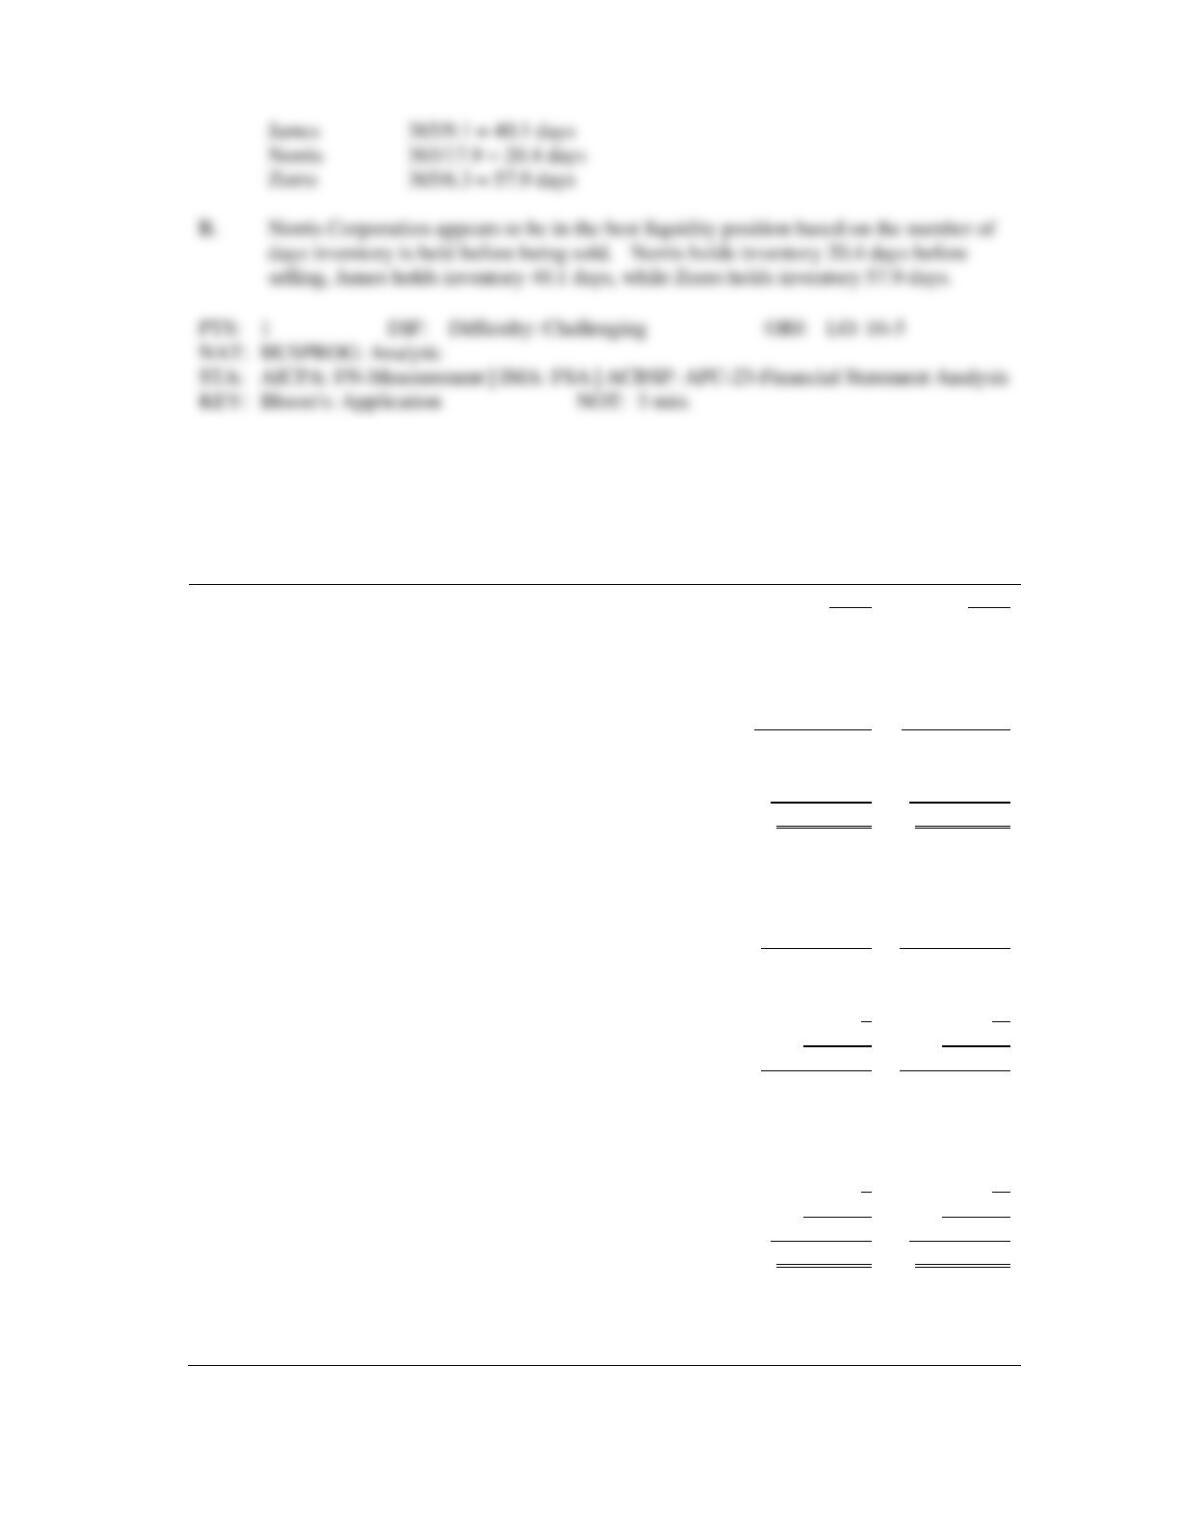
Compute the number of days inventory is held before being sold for each company for
2014.
B.
Which company appears to have the best liquidity position based solely on the
inventory analysis? Explain.
ANS:
ratio
Figure 16-2.
Financial statements for Grange Company appear below:
Grange Company
Comparative Balance Sheet
December 31, 2014 and 2013
2014
2013
Current assets:
Cash and marketable securities
$ 180,000
$ 160,000
Accounts receivable, net
150,000
120,000
Inventory
100,000
100,000
Prepaid expenses
40,000
50,000
Total current assets
470,000
430,000
Noncurrent assets:
Plant & equipment, net
1,390,000
1,320,000
Total assets
$1,860,000
$1,750,000
Current liabilities:
Accounts payable
$ 130,000
$ 130,000
Accrued liabilities
60,000
80,000
Notes payable, short term
100,000
100,000
Total current liabilities
290,000
310,000
Noncurrent liabilities:
Bonds payable
$
270,000
$
300,000
Total liabilities
560,000
610,000
Stockholders' equity:
Preferred stock, $5 par, 5%
100,000
100,000
Common stock, $5 par
220,000
220,000
Additional paid-in capital--common stock
190,000
190,000
Retained earnings
$
790,000
$
630,000
Total stockholders' equity
1,300,000
1,140,000
Total liabilities & stockholders' equity
$1,860,000
$1,750,000
Grange Company
Income Statement
For the Year Ended December 31, 2014
Sales (all on account)
$2,400,000
Cost of goods sold
1,680,000
Gross margin
720,000
Operating expenses
280,000
Net operating income
440,000
Interest expense
30,000
Net income before taxes
410,000
Income taxes (30%)
123,000
Net income
$ 287,000
Dividends during 2014 totaled $127,000, of which $5,000 were preferred dividends.
The market price of a share of common stock on December 31, 2014, was $100.
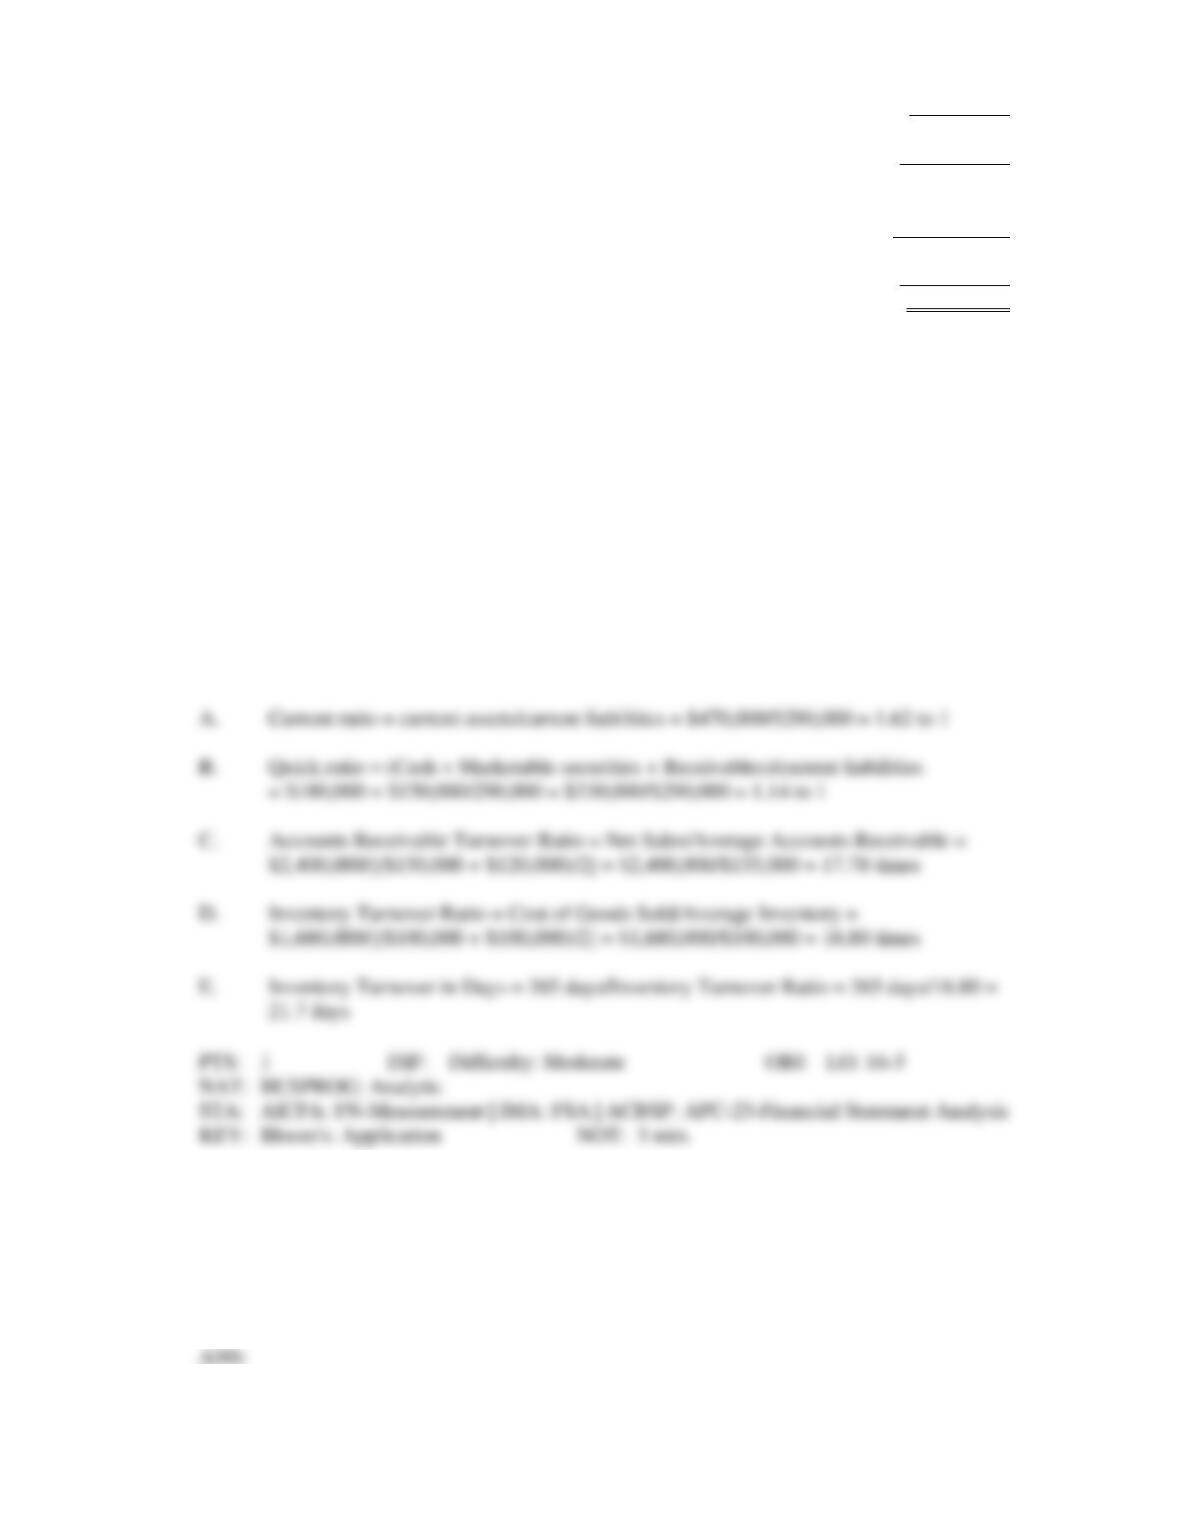
13. Refer to Figure 16-2.
Required: Compute the following liquidity ratios for 2014:
A.
current ratio
B.
quick ratio
C.
accounts receivable turnover ratio
D.
inventory turnover ratio
E.
inventory turnover in days
ANS:
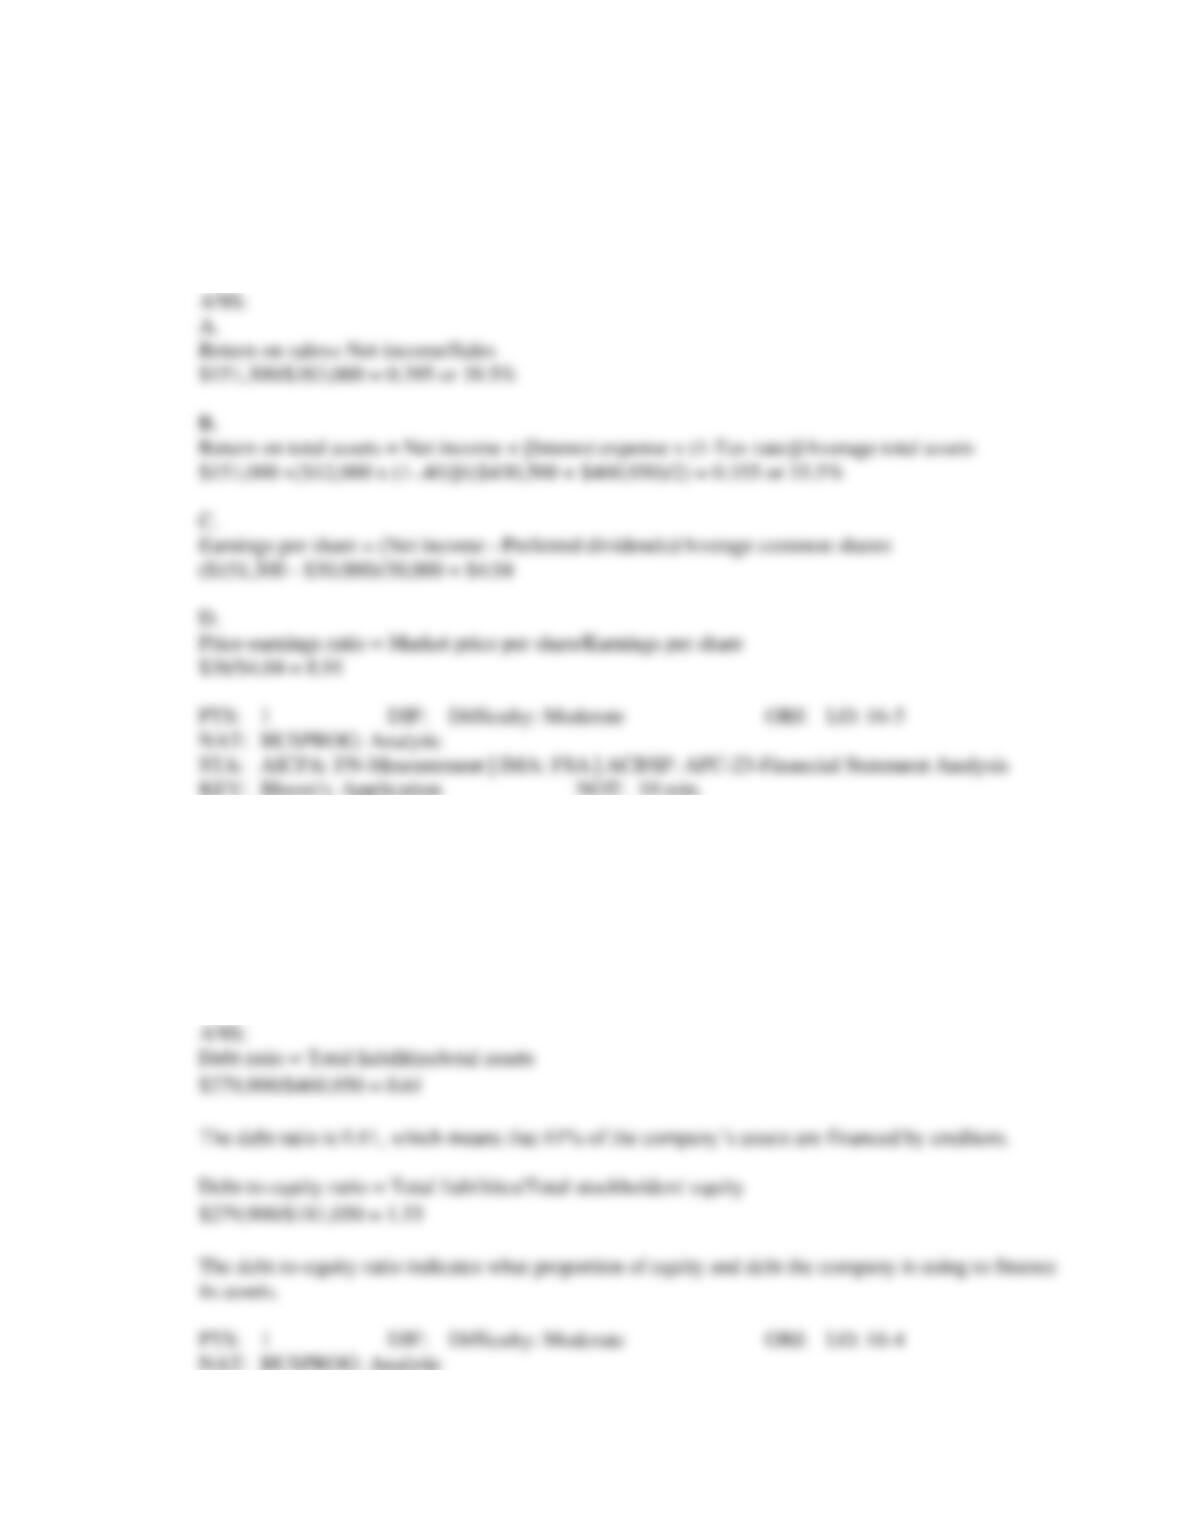
14. Refer to Figure 16-2.
Required: Compute the following leverage ratios for 2014:
A.
times-interest-earned ratio
B.
debt ratio
C.
debt-to-equity ratio
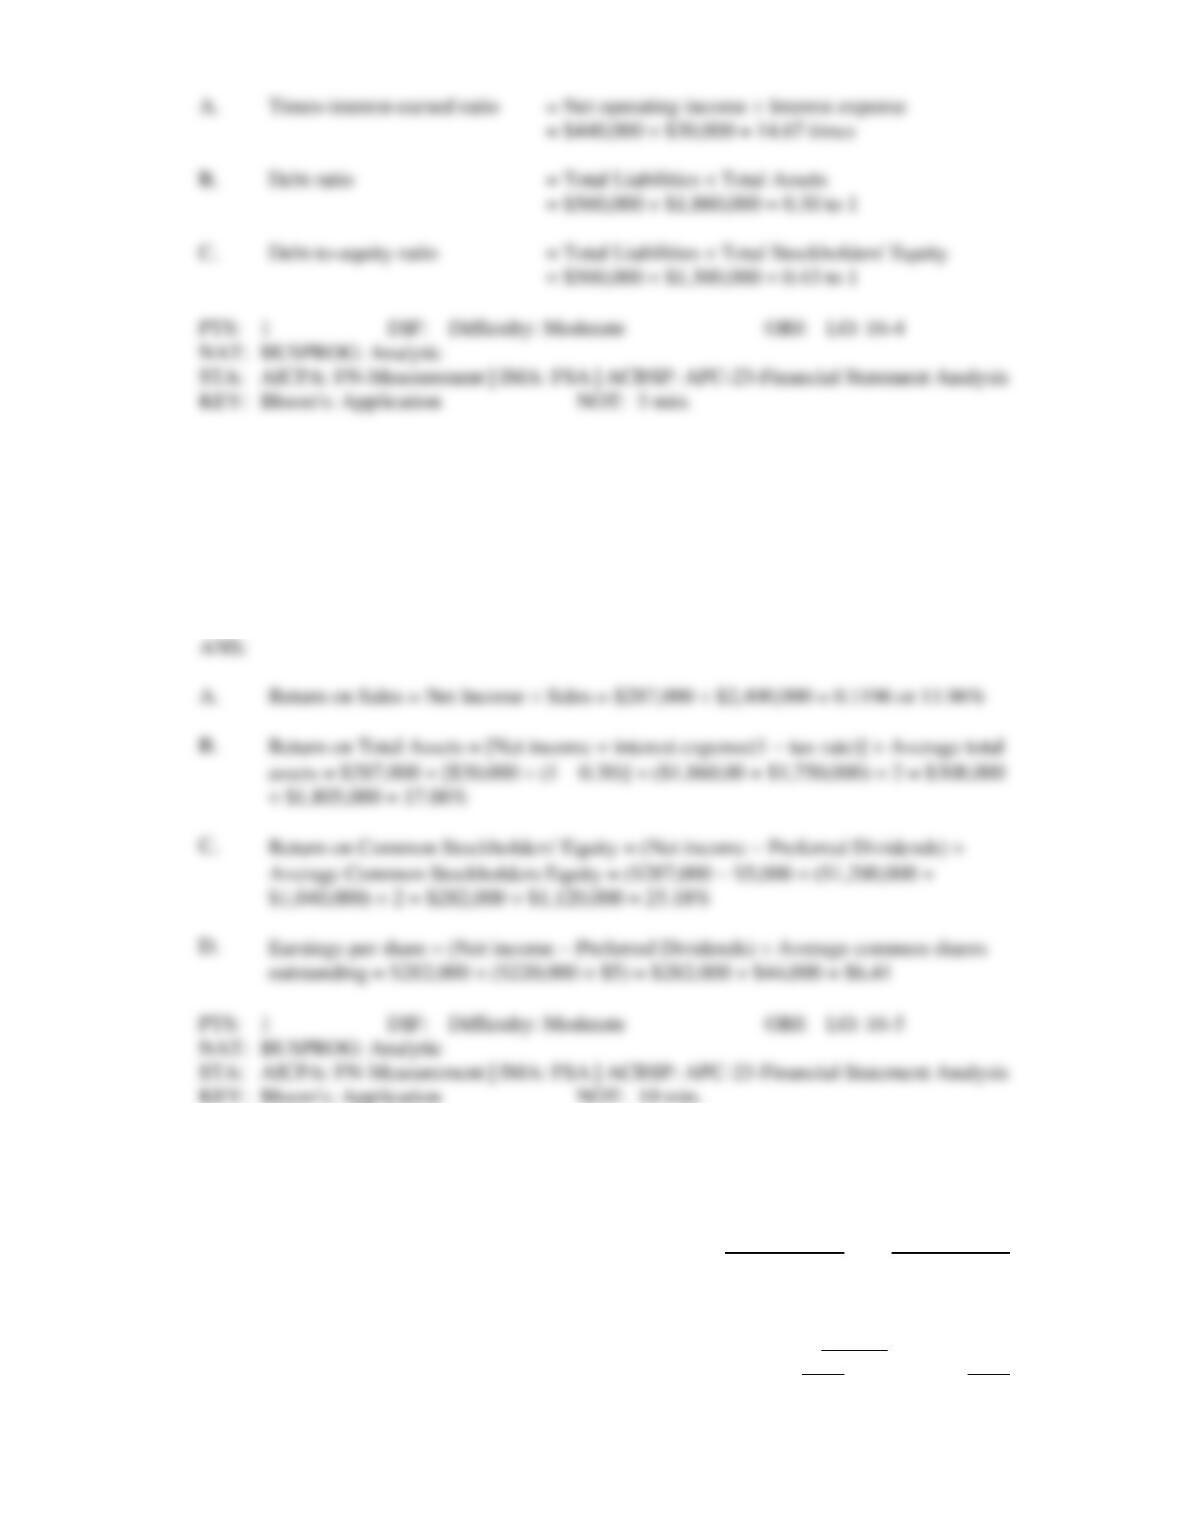
15. Refer to Figure 16-2.
Required: Compute the following profitability ratios for 2014:
A.
Return on Sales
B.
Return on Total Assets
C.
Return on Common Stockholders' Equity
D.
Earnings per share
16. Smith Inc. is a wholesaler of snow skiing gear. During 2014, Smith expanded its retail business by
adding over 50 shops. The following information is obtained from the comparative financial
statements included in the company's 2014 annual report.
Dec. 31, 2014
Dec. 31, 2013
Total liabilities
$26,000,000
$18,000,000
Total stockholders' equity
34,000,000
38,000,000
FOR THE FISCAL YEARS ENDED
Dec. 31
2014
2013
Depreciation expense
$ 2,000,000
$ 6,000,000
Interest expense
3,400,000
3,200,000
Income tax expense
12,600,000
18,100,000
Net income
6,000,000
15,000,000
Net cash provided by operations
41,000,000
(400,000)
Total dividends paid
2,000,000
12,000,000
Cash used to purchase plant assets
32,000,000
18,000,000
Payments on long-term debt
1,600,000
1,800,000
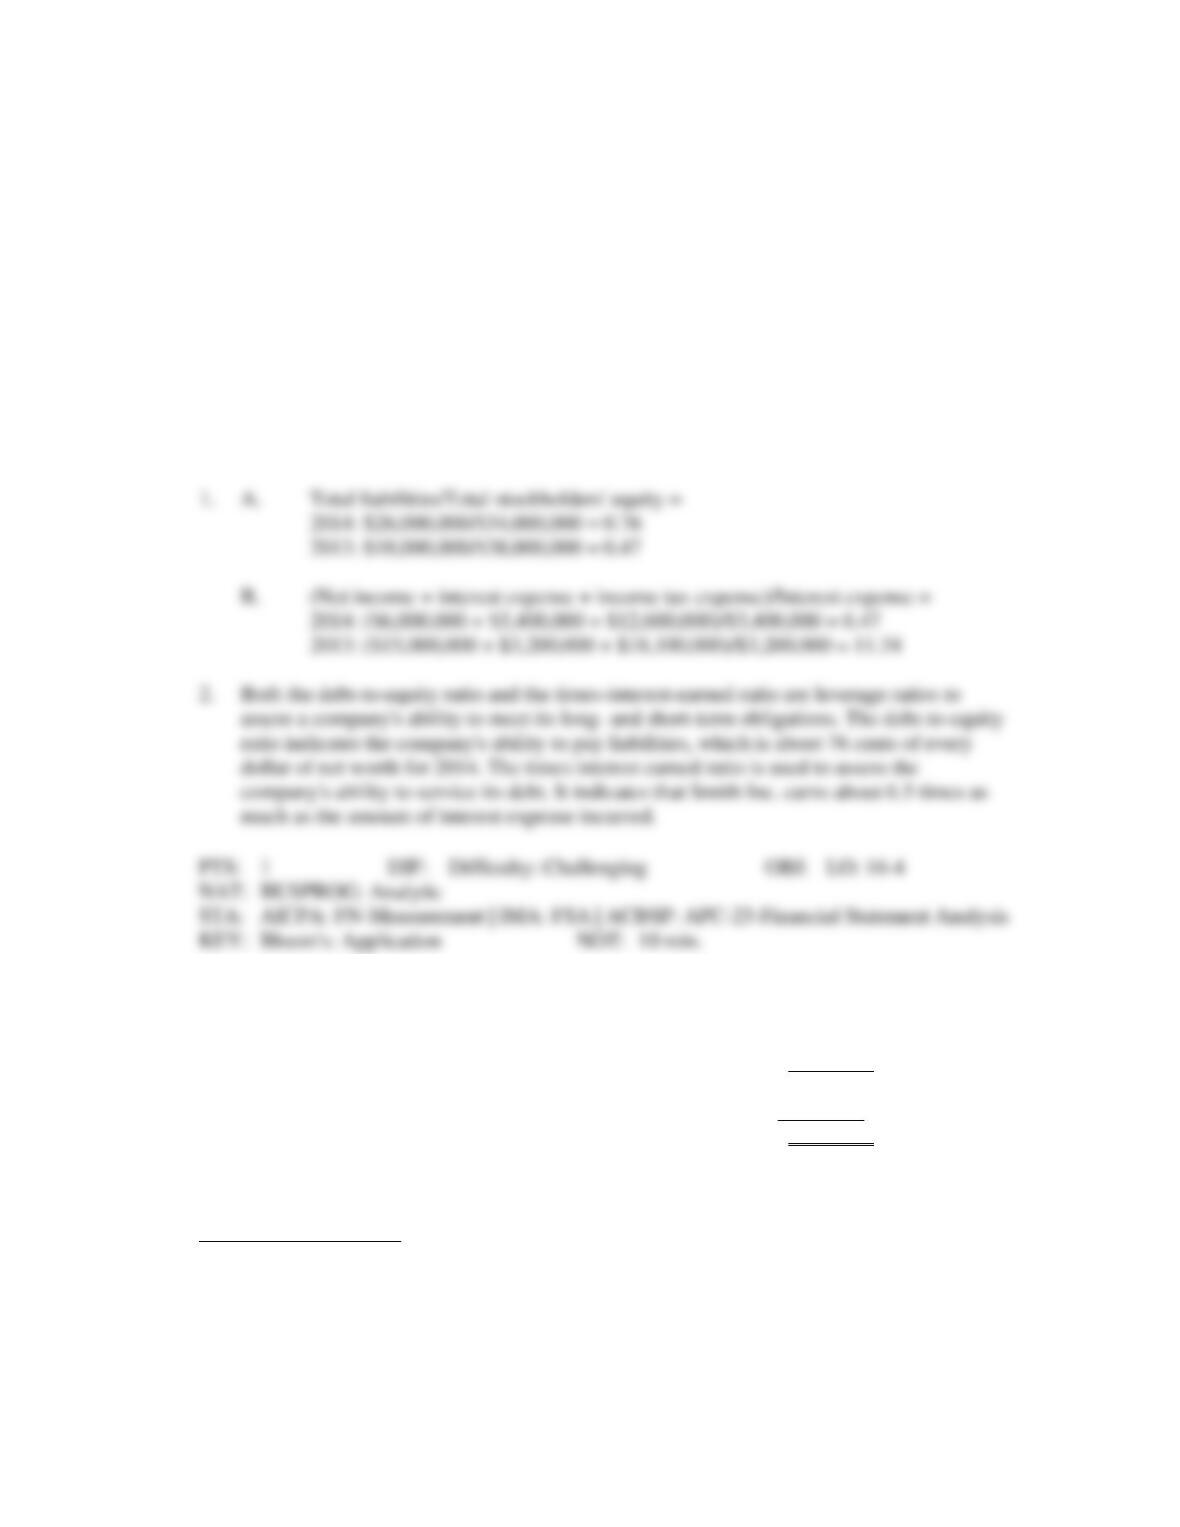
1.
Using the information provided above, compute the following for 2014 and 2013:
A.
Debt-to-equity ratio (at each year-end)
B.
Times-interest-earned ratio
2.
Briefly explain the implications of your findings with respect to these two leverage ratios.
ANS:
17. The income statement for Ray Company for the year ended December 31, 2013, appears below.
Sales
$610,000
Cost of goods sold
380,000
Gross margin
230,000
Expenses
170,000*
Net income
$ 60,000
*Includes $30,000 of interest expense and $18,000 of income tax expense.
Additional information:
1.
Common stock outstanding during 2013 totaled 45,000 shares.
2.
The market price of Ray's stock was $15 at the end of 2013.
3.
Cash dividends of $30,000 were paid, $6,000 of which were paid to preferred
stockholders.
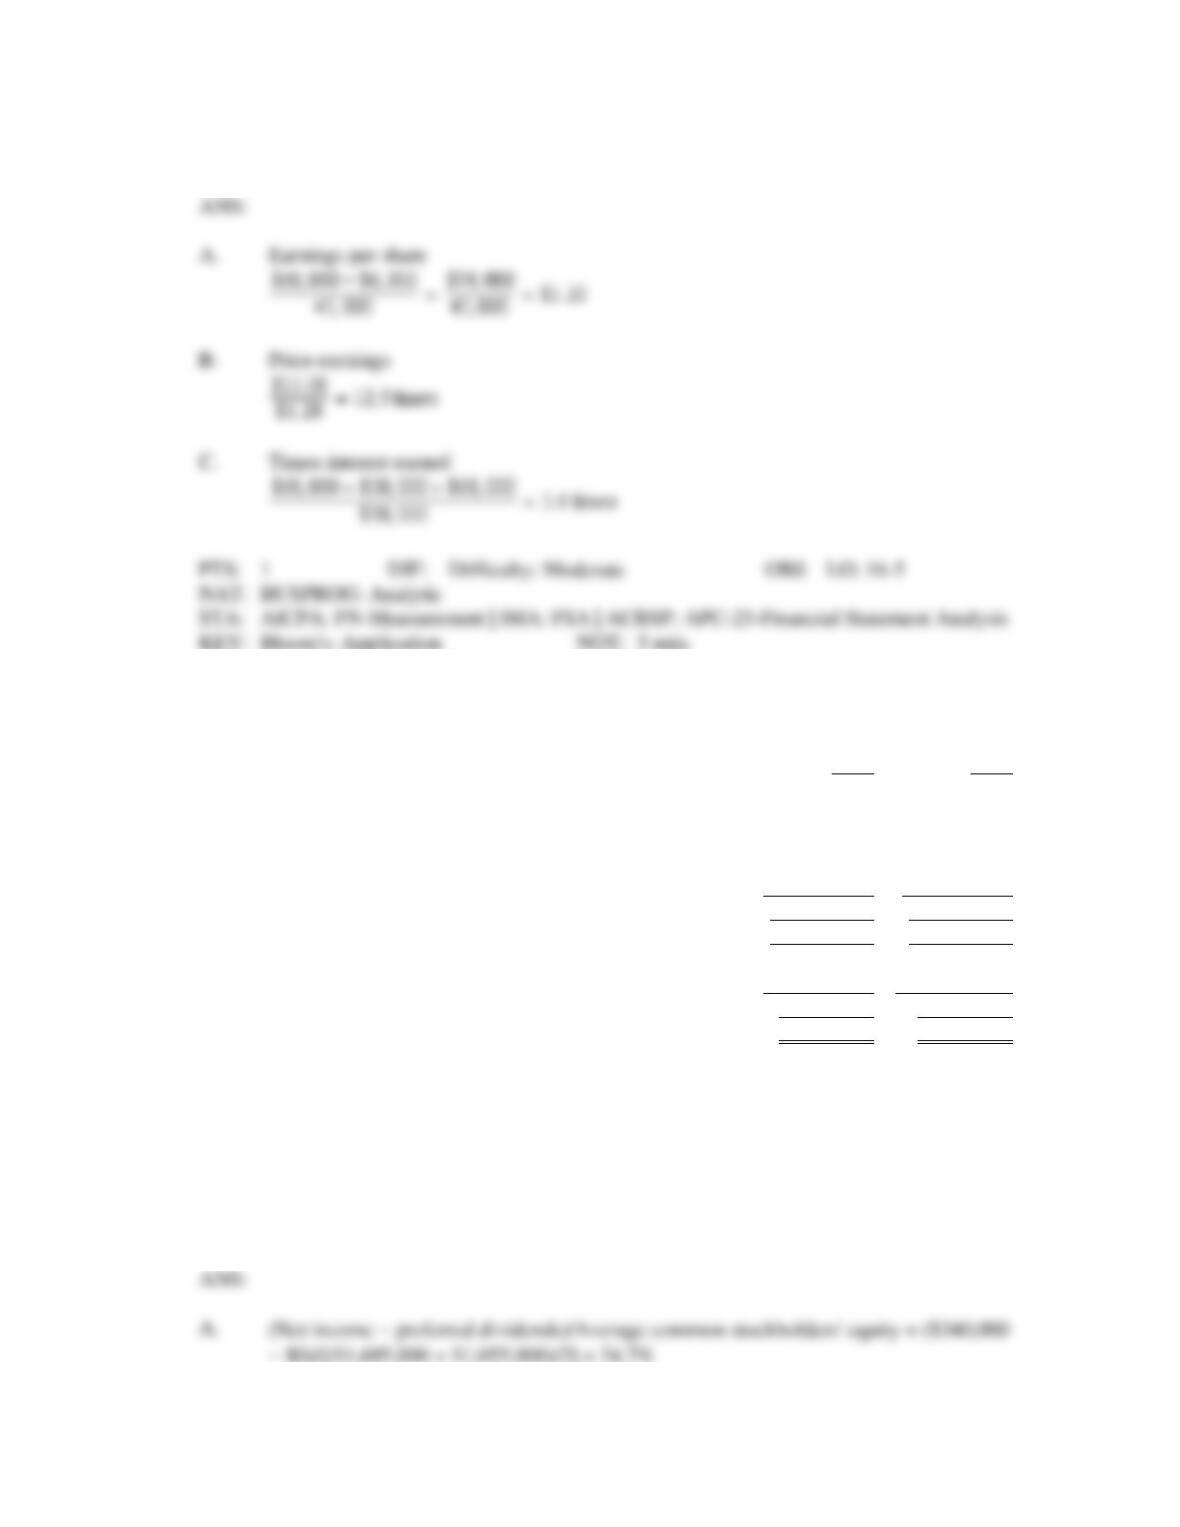
Required: Compute the following ratios for 2013:
A.
earnings per share.
B.
price-earnings.
C.
times-interest-earned ratio.
18. The following information is available from the balance sheets at the end of 2014 and 2013 for Shelley
Company:
2014
2013
Accounts payable
$ 80,000
$ 40,000
Accrued liabilities
65,000
25,000
Taxes payable
10,000
20,000
Short-term notes payable
-0-
60,000
Bonds payable due within next year
200,000
200,000
Total current liabilities
$ 355,000
$ 345,000
Bonds payable
$ 800,000
$ 300,000
Common stock, $5 par
$1,000,000
$1,000,000
Retained earnings
695,000
55,000
Total stockholders' equity
$1,695,000
$1,055,000
Total liabilities and stockholders' equity
$2,850,000
$1,700,000
Net income for 2014 and 2013 was $340,000 and $300,000, respectively. Interest expense was
$45,000 for 2014 and the tax rate is 30%. Answer the following:
A.
Calculate the return on common stockholders' equity ratio for 2014.
B.
Calculate the return on total assets ratio for 2014.
C.
What is the difference between the return on stockholders' equity and the return on
assets?
19. The following ratios have been computed for Gilbert Company for 2014.
Return on sales
20%
Times-interest-earned ratio
15
Accounts receivables turnover ratio
5
Acid-test ratio
1.60 : 1
Current ratio
3 : 1
Debt ratio
26%
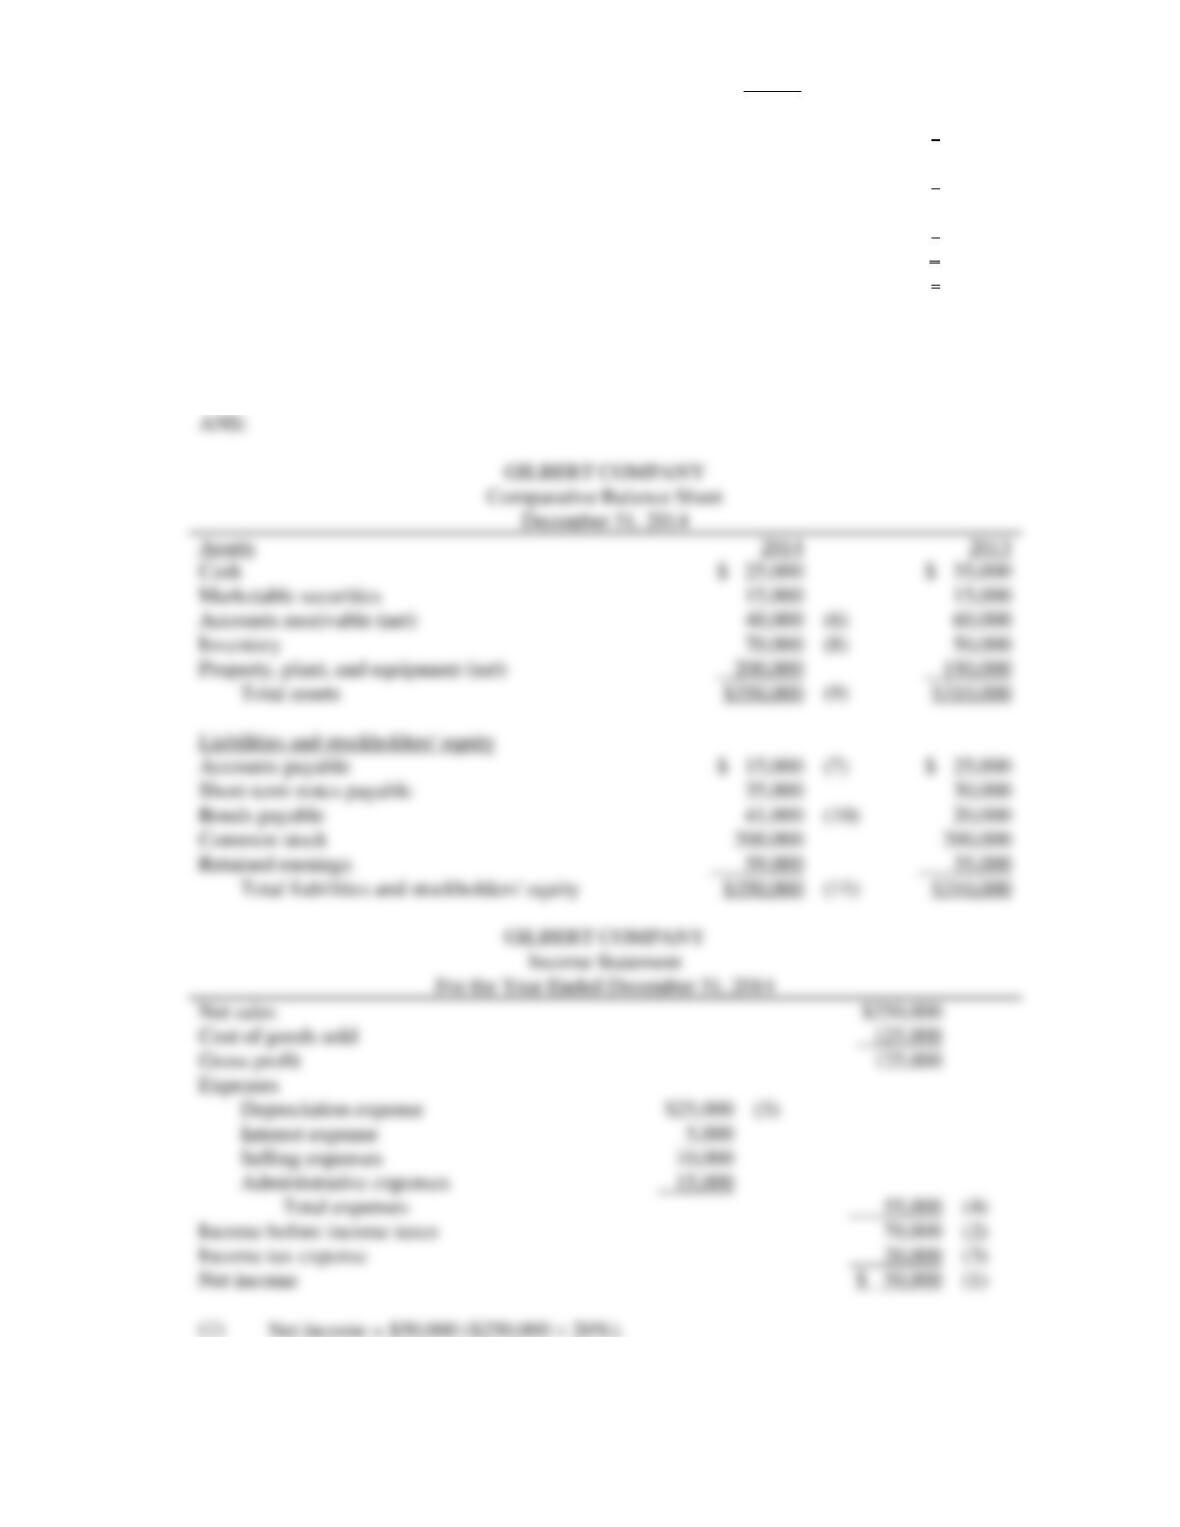
Gilbert Company's 2014 financial statements with missing information follow:
GILBERT COMPANY
Comparative Balance Sheet
December 31, 2014
Assets
2014
2013
Cash
$ 25,000
$ 35,000
Short-term Investments
15,000
15,000
Accounts receivable (net)
?
(6)
60,000
Inventory
?
(8)
50,000
Property, plant, and equipment (net)
200,000
150,000
Total assets
$ ?
(9)
$310,000
Liabilities and stockholders' equity
Accounts payable
$ ?
(7)
$ 25,000
Short-term notes payable
35,000
30,000
Bonds payable
?
(10)
20,000
Common stock
200,000
200,000
Retained earnings
59,000
35,000
Total liabilities and stockholders' equity
$ ?
(11)
$310,000
GILBERT COMPANY
Income Statement
For the Year Ended December 31, 2014
Net sales
$250,000
Cost of goods sold
125,000
Gross profit
125,000
Expenses:
Depreciation expense
$ ?
(5)
Interest expense
5,000
Selling expenses
10,000
Administrative expenses
15,000
Total expenses
?
(4)
Income before income taxes
?
(2)
Income tax expense
?
(3)
Net income
$
?
(1)
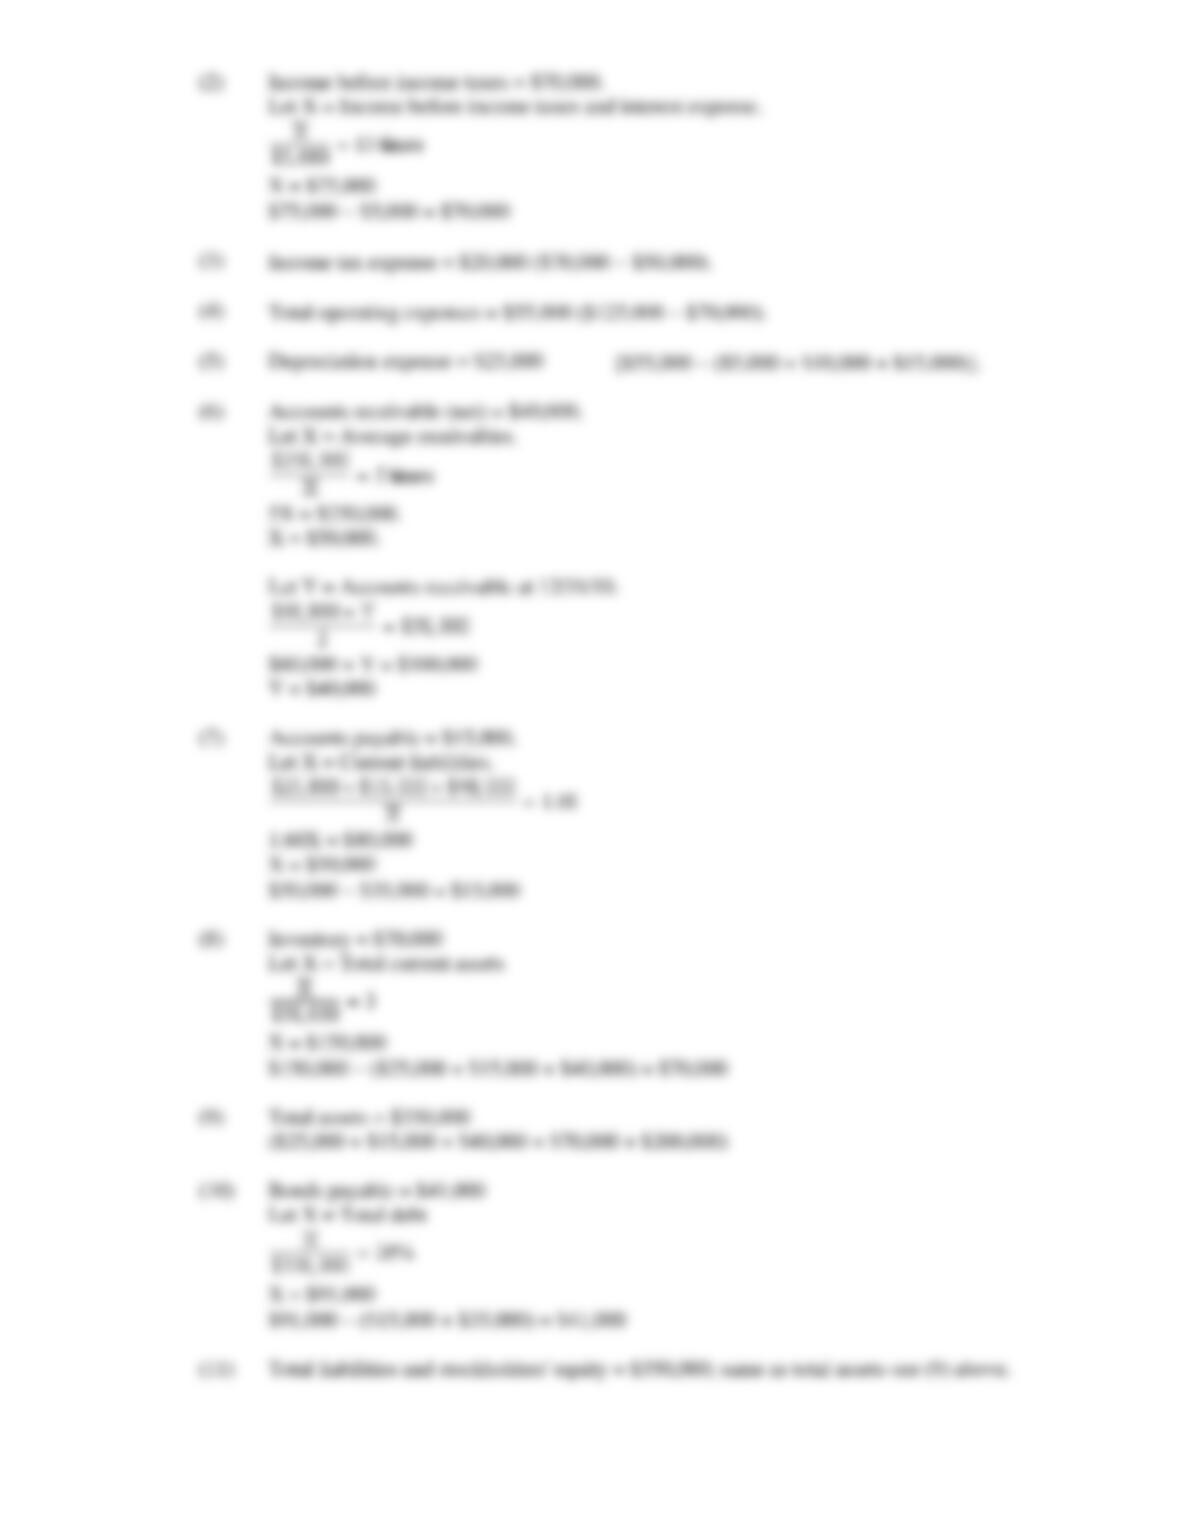
Required: Use the above ratios and information from the Gilbert Company financial statements to fill
in the missing information on the financial statements. Follow the sequence indicated. Show
computations that support your answers.
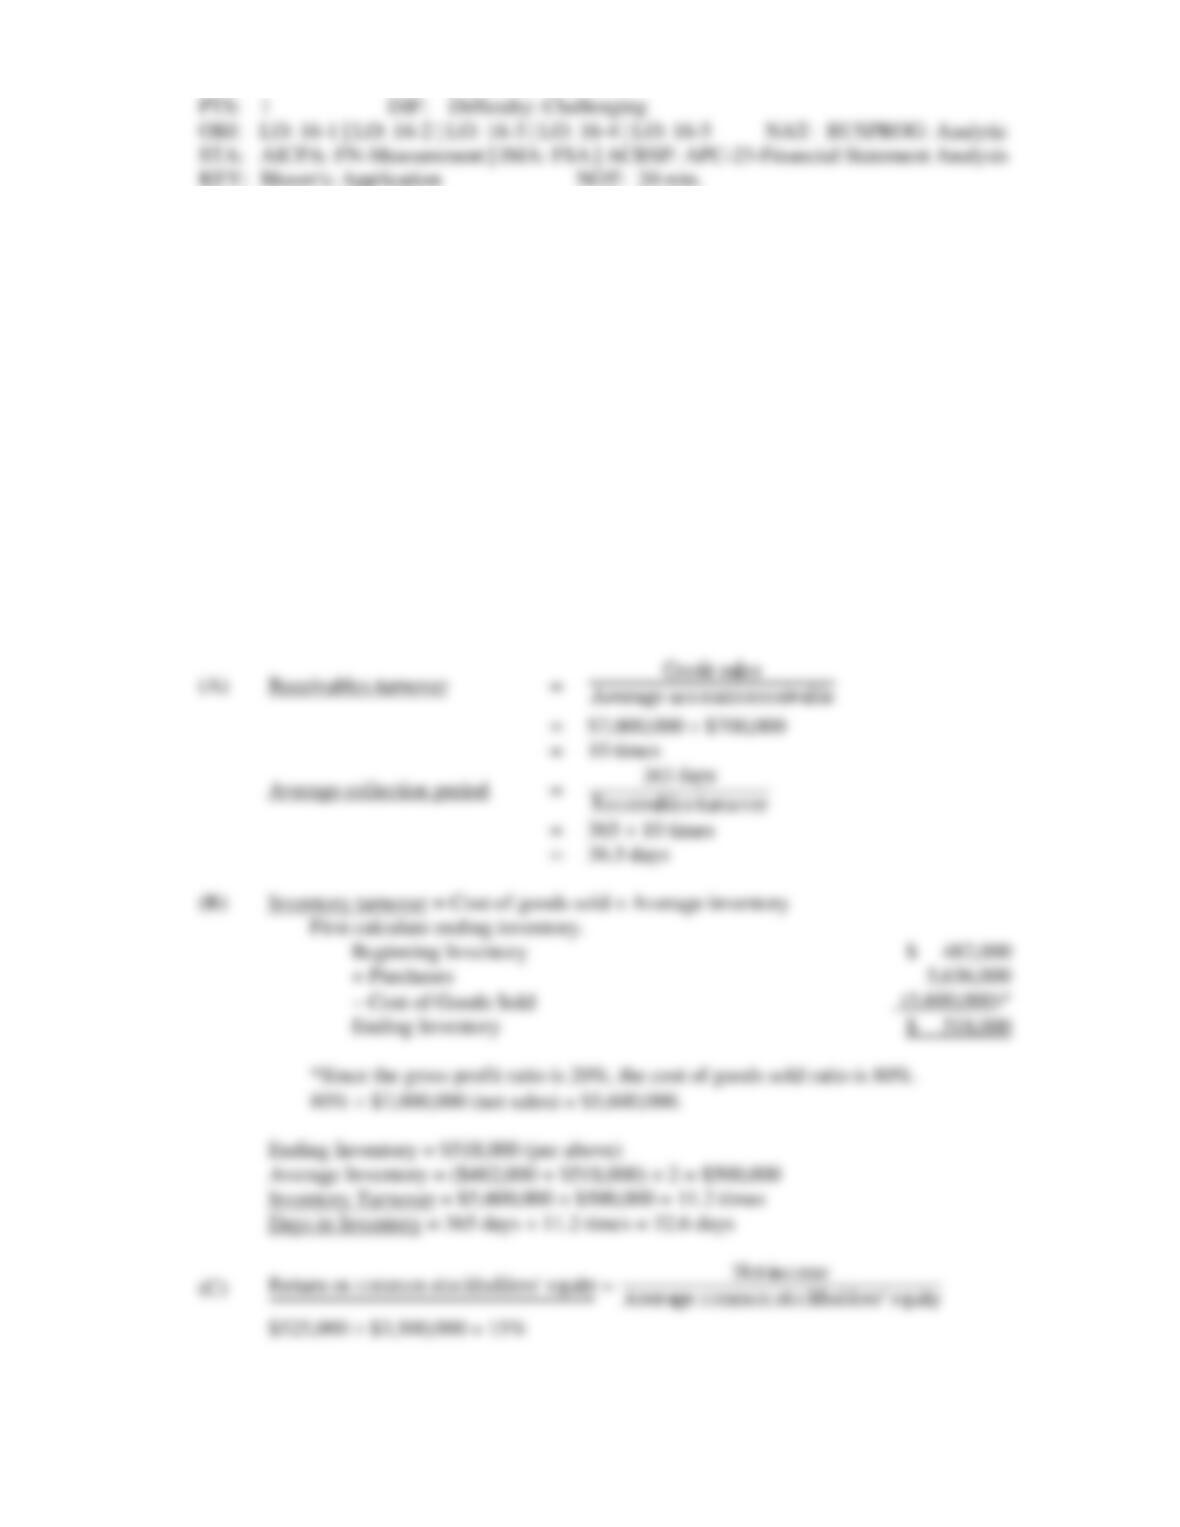
20. Winter Corporation has issued common stock only. The company has been successful and has a gross
profit rate of 20%. The information shown below was taken from the company's financial statements.
Beginning inventory
$ 482,000
Purchases
5,636,000
Ending inventory
?
Average accounts receivable
700,000
Average common stockholders' equity
3,500,000
Sales (all on credit)
7,000,000
Net income
525,000
Required: Compute the following:
A.
Receivables turnover and the average collection period.
B.
Inventory turnover and the days in inventory.
C.
Return on common stockholders' equity.
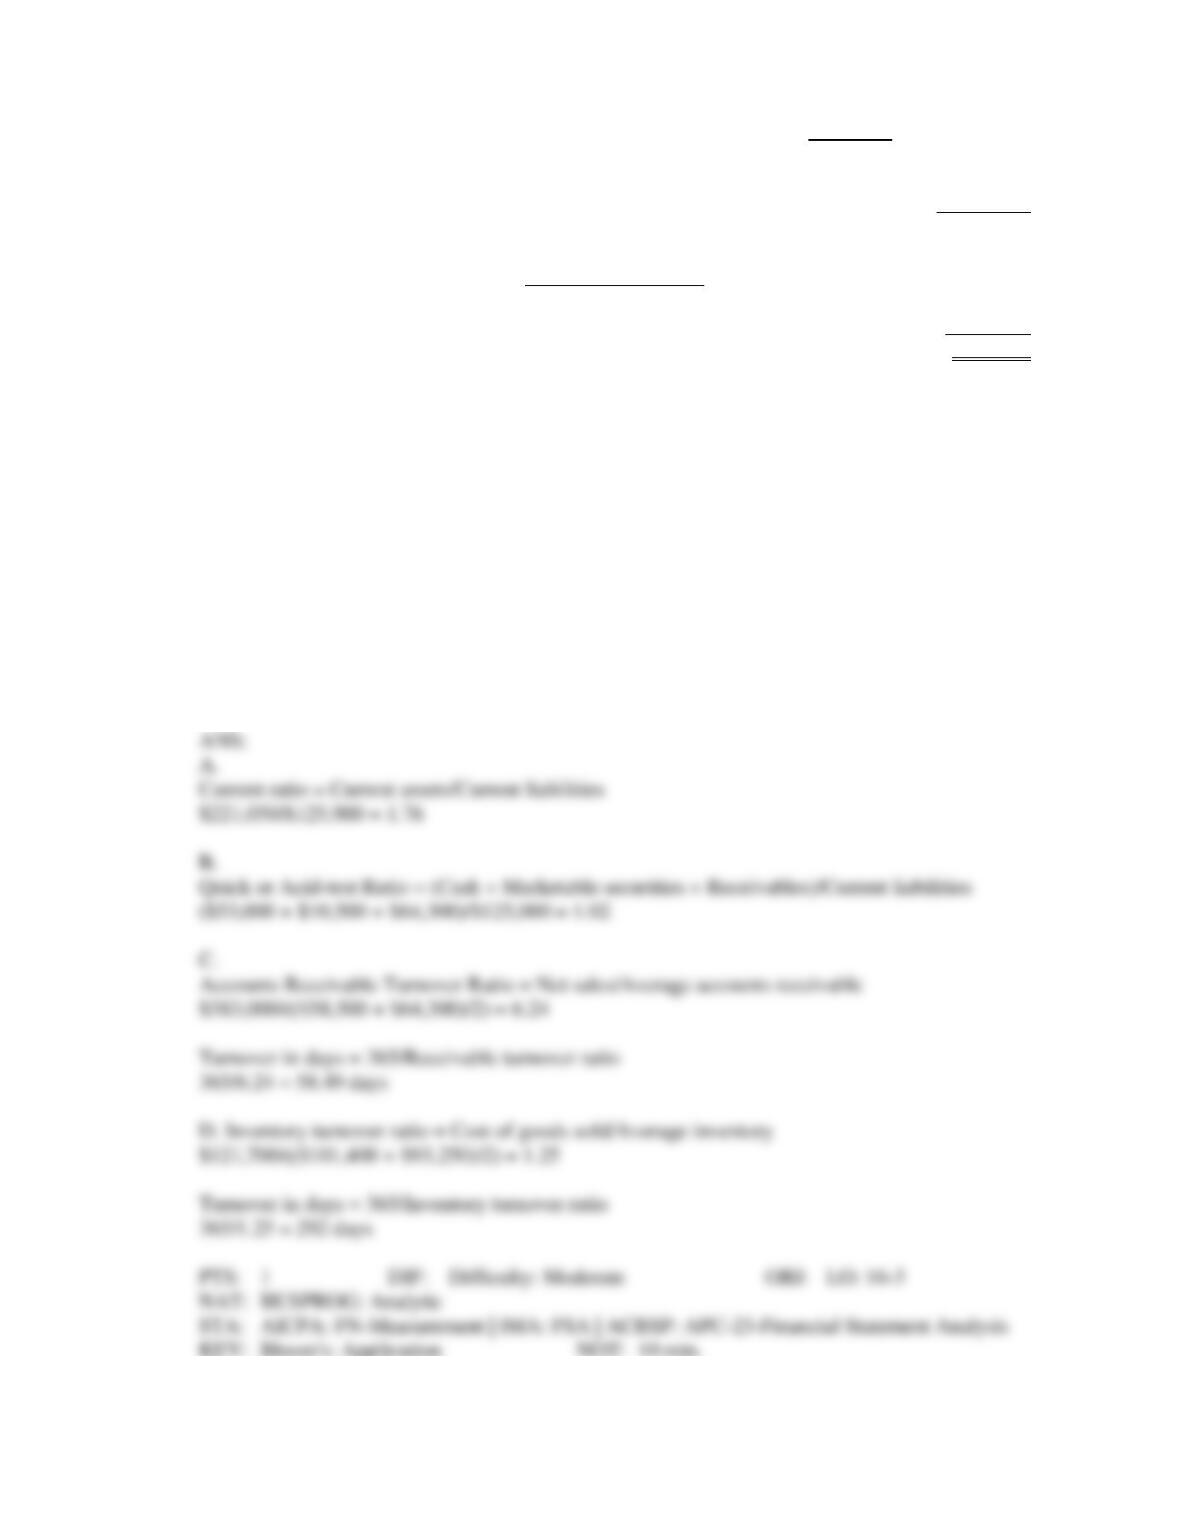
ANS:
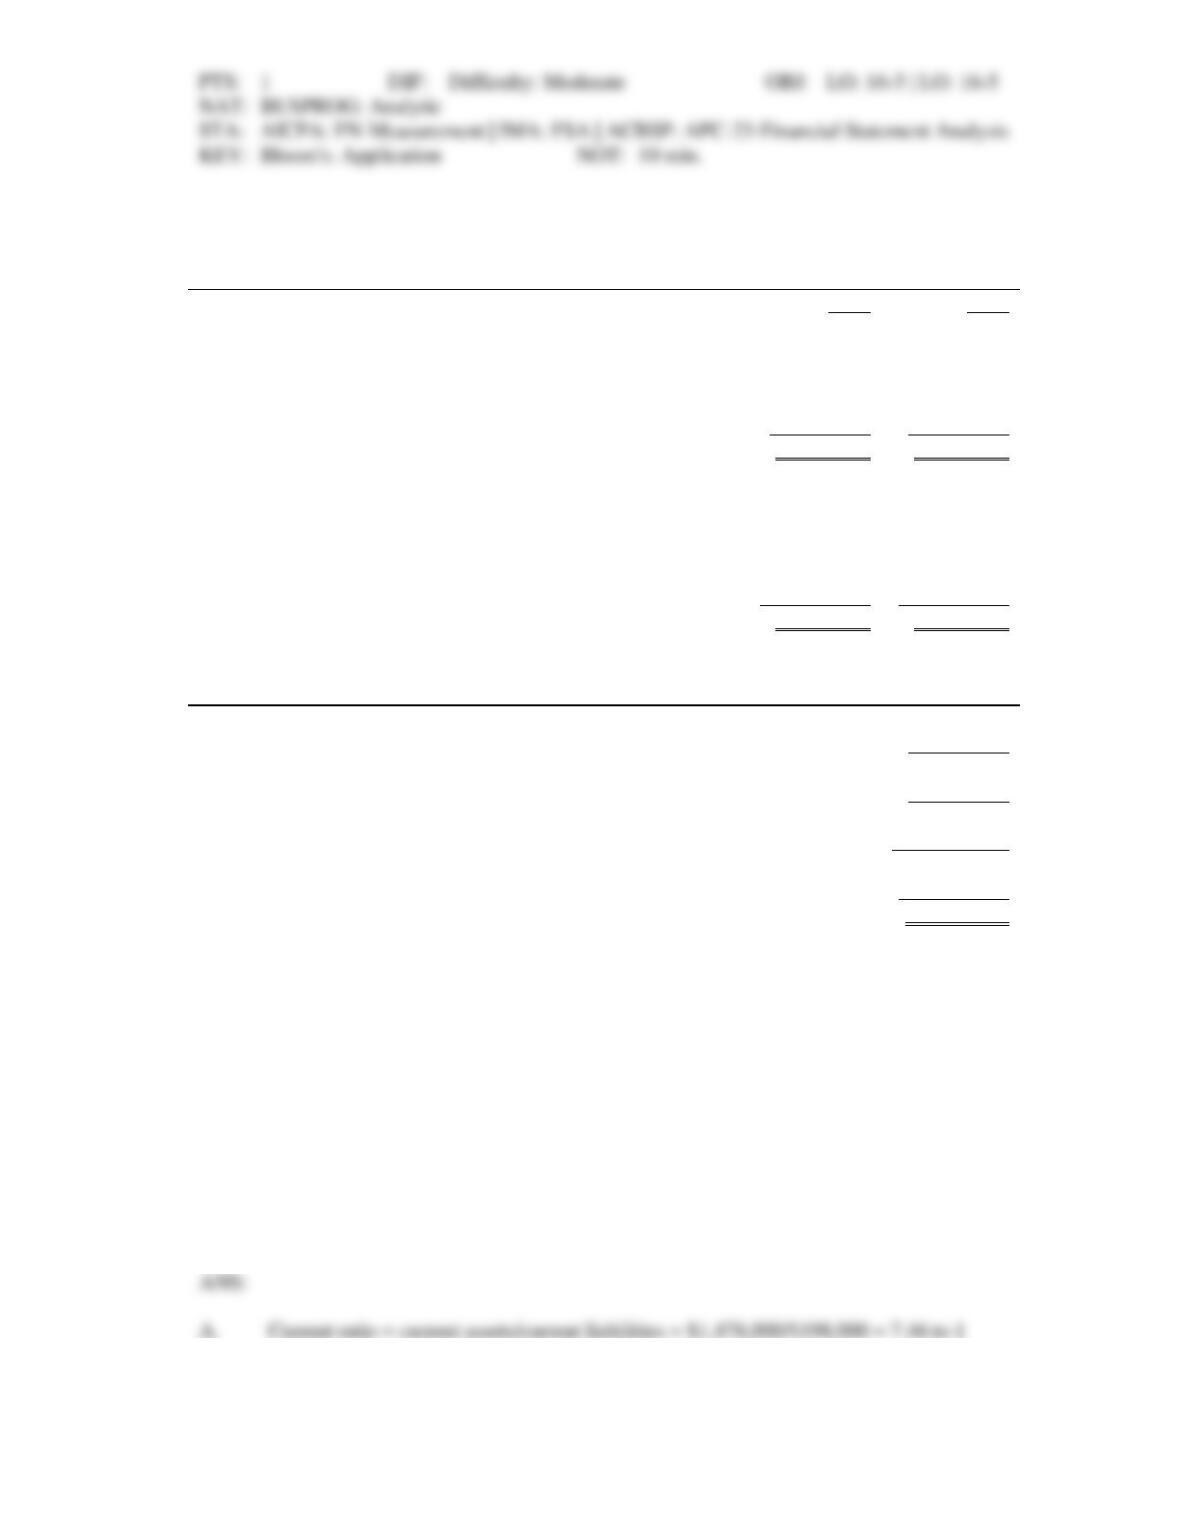
Figure 16-4.
Condensed financial statements for Black Company appear below:
Comparative Balance Sheets
2014
2013
Cash
$ 128,000
$ 201,000
Accounts receivable
472,000
438,000
Inventories
797,000
673,000
Prepaid expenses
81,000
92,000
Plant and equipment (net)
2,655,000
2,428,000
Total assets
$4,133,000
$3,832,000
Accounts payable
$ 198,000
$ 280,600
Long-term bonds payable
1,000,000
1,000,000
Preferred stock, 10%, $100 par
450,000
450,000
Common stock, no par
1,800,000
1,800,000
Retained earnings
685,000
301,400
Total liabilities and stockholders’ equity
$4,133,000
$3,832,000
Income Statement
December 31, 2014
Sales, net
$5,400,000
Less cost of goods sold
3,240,000
Gross margin
2,160,000
Less operating expenses
1,010,000
Net operating income
1,150,000
Interest expense
80,000
Net income before taxes
1,070,000
Less income taxes
321,000
Net income
$ 749,000
There were 72,000 shares of common stock outstanding throughout the 2014. Dividends on common
stock amounted to $320,400 and dividends on preferred stock amounted to $45,000. The market value
of a share of common stock was $54 at the end of 2014. The income tax rate is 30%.
21. Refer to Figure 16-4.
Required: Calculate the following liquidity ratios for 2014.
A.
Current Ratio
B.
Quick Ratio
C.
Accounts Receivable Turnover Ratio
D.
Inventory Turnover Ratio
E.
Inventory Turnover in Days
22. Refer to Figure 16-4.
Required: Calculate the following leverage ratios for 2014:
A.
times-interest-earned ratio
B.
debt ratio
C.
debt-to-equity ratio
23. Refer to Figure 16-4.
Required: Calculate the following profitability ratios for 2014.
A.
Return on Sales
B.
Return on Total Assets
C.
Return on Common Stockholders' Equity
D.
Earnings per share
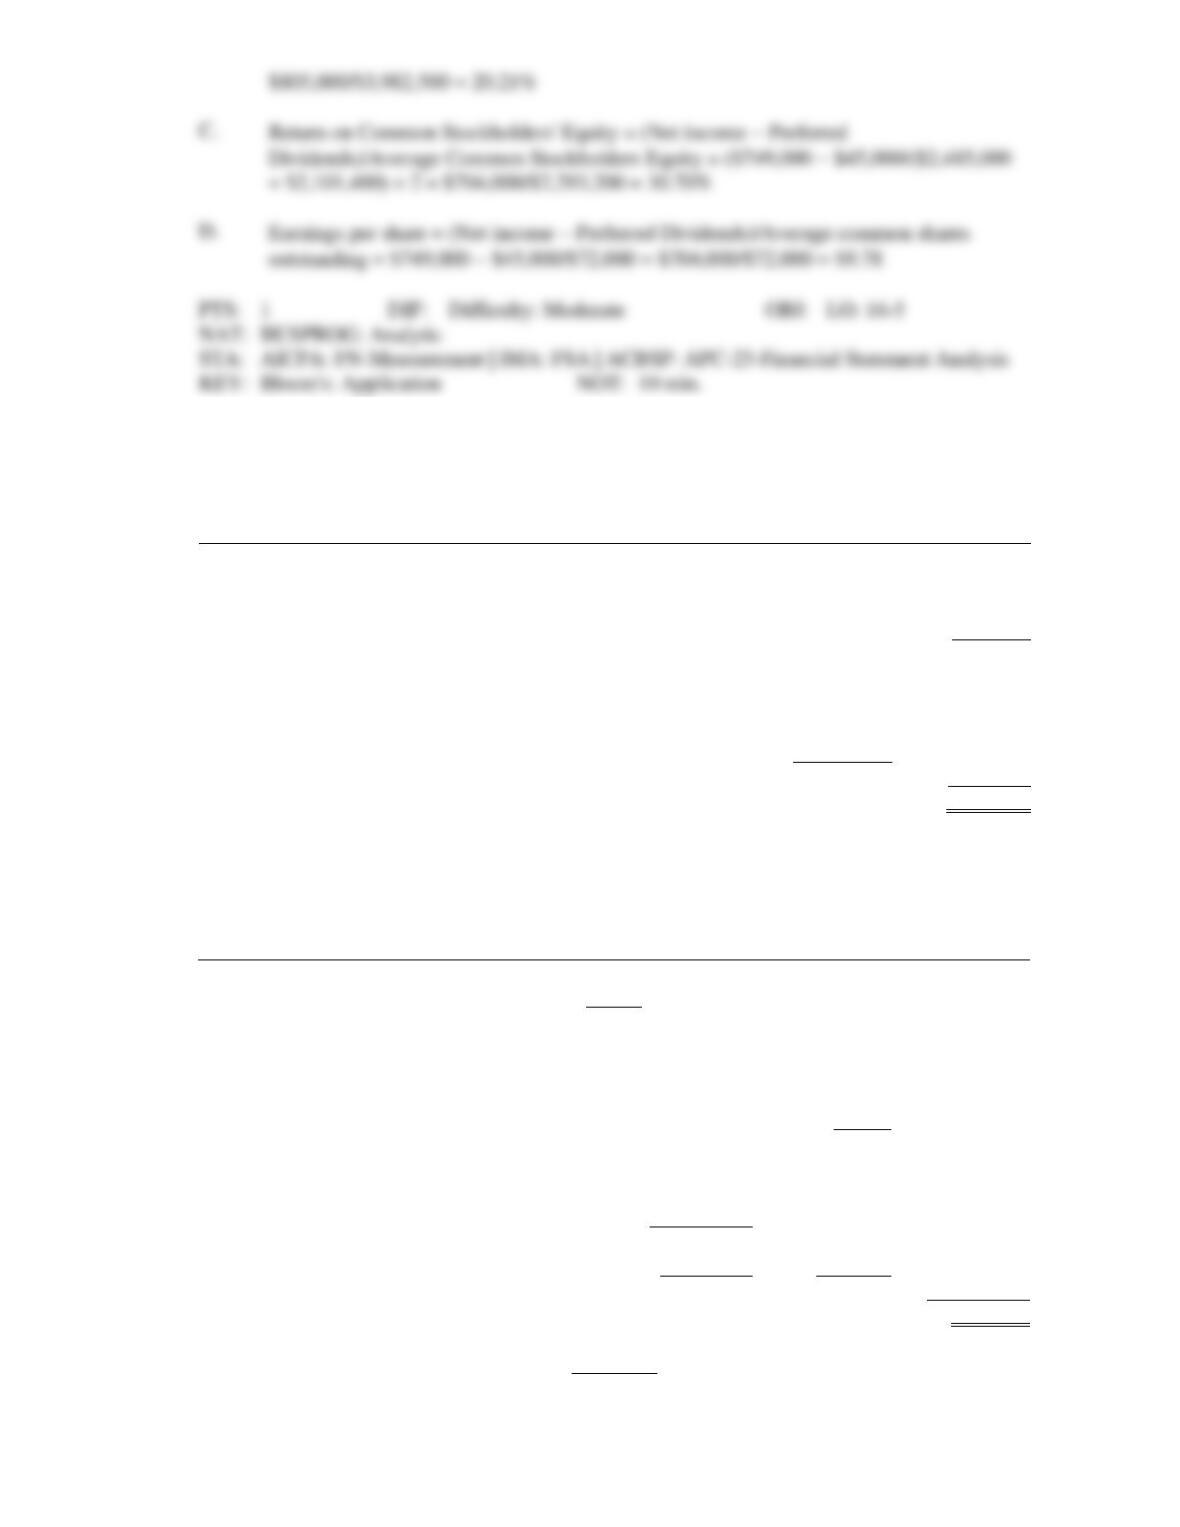
Figure 16-7
Kooper Co.
Income Statement
For the Year Ended December 31, 2013
Revenues:
Net sales
$383,000
Less: Cost of goods sold
$121,700
Gross margin
261,300
Less: Operating expenses
Selling expenses
41,500
Administrative expenses
56,500
Interest expense
12,000
Total expenses
100,000
Net income
$ 151,300
Kooper Co.
Balance Sheet
December 31, 2013
Assets
Current assets:
Cash
$53,000
Accounts receivable
64,300
Marketable securities
10,500
Inventory
93,250
Total current assets
$221,050
Property, plant, and equipment:
Store equipment
$325,000
Less Accumulated depreciation
162,100
$162,900
Office equipment
$ 149,750
Less Accumulated depreciation
72,750
77,000
Total property, plant, and equipment
239,900
Total assets
$460,950
Liabilities
Current liabilities:
Accounts payable
$97,200
Salaries payable
28,700
Total current liabilities
$ 125,900
Long-term liabilities:
Note payable (due 2013)
154,000
Total liabilities
$279,900
Stockholders’ Equity
Total stockholders’ equity
181,050
Total liabilities and equity
$460,950
There were 30,000 shares of common stock outstanding throughout 2013. Dividends on common
stock amounted to $21,000 and dividends on preferred stock amounted to $30,000. The market value
of a share of common stock was $36 at the end of 2013. The income tax rate is 40%. The accounts
receivable and inventory accounts had beginning balances of $58,500 and $101,400 respectively.
Total assets at the beginning of the year were $430,500.
24. Refer to Figure 16-7.
Required: Calculate the following ratios:
A. Current ratio
B. Quick ratio
C. Accounts receivable turnover ratio and accounts receivable turnover in days
D. Inventory turnover ratio and inventory turnover in days
25. Refer to Figure 16-7.
Required: Calculate the following ratios:
A. return on sales
B. return on total assets
C. earnings per share
D. price-earnings ratio
26. Refer to Figure 16-7.
Required: Calculate the following ratios:
A. Debt ratio
B. Debt-to-equity ratio
State what information each ratio is providing to the company.
ESSAY
1. The two major forms of common-size analysis are horizontal analysis and vertical analysis. What type
of information or insights can be obtained by using these two techniques of financial statement
analysis? Explain how the output of horizontal analysis and vertical analysis can be compared to
industry averages and/or competitive companies.
2. Ratios by themselves tell little about the financial well-being of a company. For meaningful analysis,
the ratios should be compared with a standard. Describe the two standards commonly used.
3. Why is liquidity important for businesses?
4. What do profitability ratios measure and what is their significance?
5. Carter Company has a return on total assets of 12% and a return on common stockholders' equity of
15%. What causes the difference in the two returns?
6. The use of estimates, cost, alternative accounting methods, the presence of atypical data, and
diversification of firms are all factors that may limit the usefulness of financial statement analysis.
Identify a ratio and explain how one or more of the limiting factors can affect the usefulness of that
ratio.