
In monopolistic competition
A) there are two firms in the market.
B) the size of one firm is small relative to the size of the industry.
C) the size of one firm is large relative to the size of the industry.
D) each firm is a price-taker.
E) there is only one firm in the market.
If the price of the good measured on the horizontal axis increases, the budget line
A) becomes steeper.
B) shifts leftward and becomes steeper.
C) shifts leftward and parallel to the original budget line.
D) shifts rightward and parallel to the original budget line.
E) becomes flatter.
Ceteris paribus, an increase in labour productivity results in a

A) higher real wage rate and higher potential GDP per hour of labour.
B) lower real wage rate and higher potential GDP per hour of labour.
C) higher real wage rate and lower potential GDP per hour of labour.
D) lower real wage rate and lower potential GDP per hour of labour.
E) constant real wage rate in the long run.
Use the table below to answer the following questions.
Table 1A.3.3
Refer to Table 1A.3.3. If we were to draw a graph of this relationship, when would the
slope be positive?
A) never
B) only if x is less than 5
C) only if x equals 5
D) only if x is greater than 5
E) We do not have enough information to tell.

Which of the following is an explanation for the existence of trade restrictions?
A) Tariffs generate revenue for the government.
B) rent seeking
C) inefficient quotas
D) both A and B
E) both A and C
In 1963, the production possibilities per person in Canada were ________ than those in
Hong Kong. Between 1963 and 2013, Hong Kong’s production possibilities have
________ Canada’s production possibilities.
A) smaller; expanded more quickly than
B) smaller; not expanded as quickly as
C) greater; not expanded as quickly as
D) greater; expanded more quickly than
E) greater; expanded at the same rate as
Refer to Table 2.1.1. As we increase the production of X,

A) the amount of Y that is given up for each additional unit of X decreases.
B) the output of Y increases.
C) the opportunity cost of each additional unit of X increases.
D) unemployment increases.
E) the amount of X increases at an increasing rate.
Which one of the following reduces the inequality of income or wealth relative to the
market distribution?
A) government payments to the poor
B) a regressive income tax
C) large inheritances
D) assortative mating
E) large families
Use the table below to answer the following questions.
Table 1A.3.2

In Table 1A.3.2, suppose that w is measured along the x-axis. The slope of the line
relating w and u is
A) positive with a decreasing slope.
B) negative with a decreasing slope.
C) positive with an increasing slope.
D) negative with a constant slope.
E) positive with a constant slope.
The air in the atmosphere is
A) nonrival and nonexcludable.
B) rival and nonexcludable.
C) nonrival and excludable.
D) rival and excludable.
E) a private good.

Refer to the production possibilities frontier in Figure 2.1.2. At point A, the opportunity
cost of producing 3 more units of X
A) is 30 units of Y.
B) is 3 units of X.
C) is 20 units of Y.
D) is 10 units of Y.
E) cannot be determined from the diagram.
Firms in monopolistic competition in the short run always
A) set price above marginal cost.
B) make an economic profit.
C) set price equal to marginal cost.
D) produce at the minimum average total cost.
E) break even.
An increase in labour hours will lead to

A) an upward shift of the aggregate production function.
B) a movement along the aggregate production function.
C) both a movement along and an upward shift of the aggregate production function.
D) neither a movement along nor a shift of the aggregate production function.
E) a downward shift of the aggregate production function.
Which one of the following does not occur in the long run when firms in a market make
an economic profit?
A) Firms enter the market.
B) The market supply curve shifts rightward.
C) Each firm increases production.
D) Economic profit of each firm decreases.
E) Market price falls.
Use the information below to answer the following question.
Fact 14.3.1

Suppose that at one of the Talbots shops, marginal cost of a coat is constant at $150, and
total fixed cost is $3,000 a day. The shop maximizes its profit by selling 15 coats a day
at $500 per coat. Then the shops nearby increase their advertising. The Talbots shop
responds by spending $1,500 a day more on advertising its coats. As a result, its
profit-maximizing number of coats sold increases to 25 a day at $400 per coat.
Refer to Fact 14.3.1. As a result of increased advertising, Talbots’ markup
A) decreases by $100.
B) increases by $50.
C) increases by $75.
D) decreases by $60.
E) decreases by an unknown amount.
Refer to Figure 1A.2.3. Which of the graphs shows a positive relationship between x
and y?
A) (a)
B) (b)
C) (c)
D) (d)
E) both (b) and (d)
An external cost
A) is a marginal benefit.
B) results in underproduction.
C) is a payment from the government to a producer.
D) is a cost that affects someone other than the seller.
E) is a payment from a producer to the government.
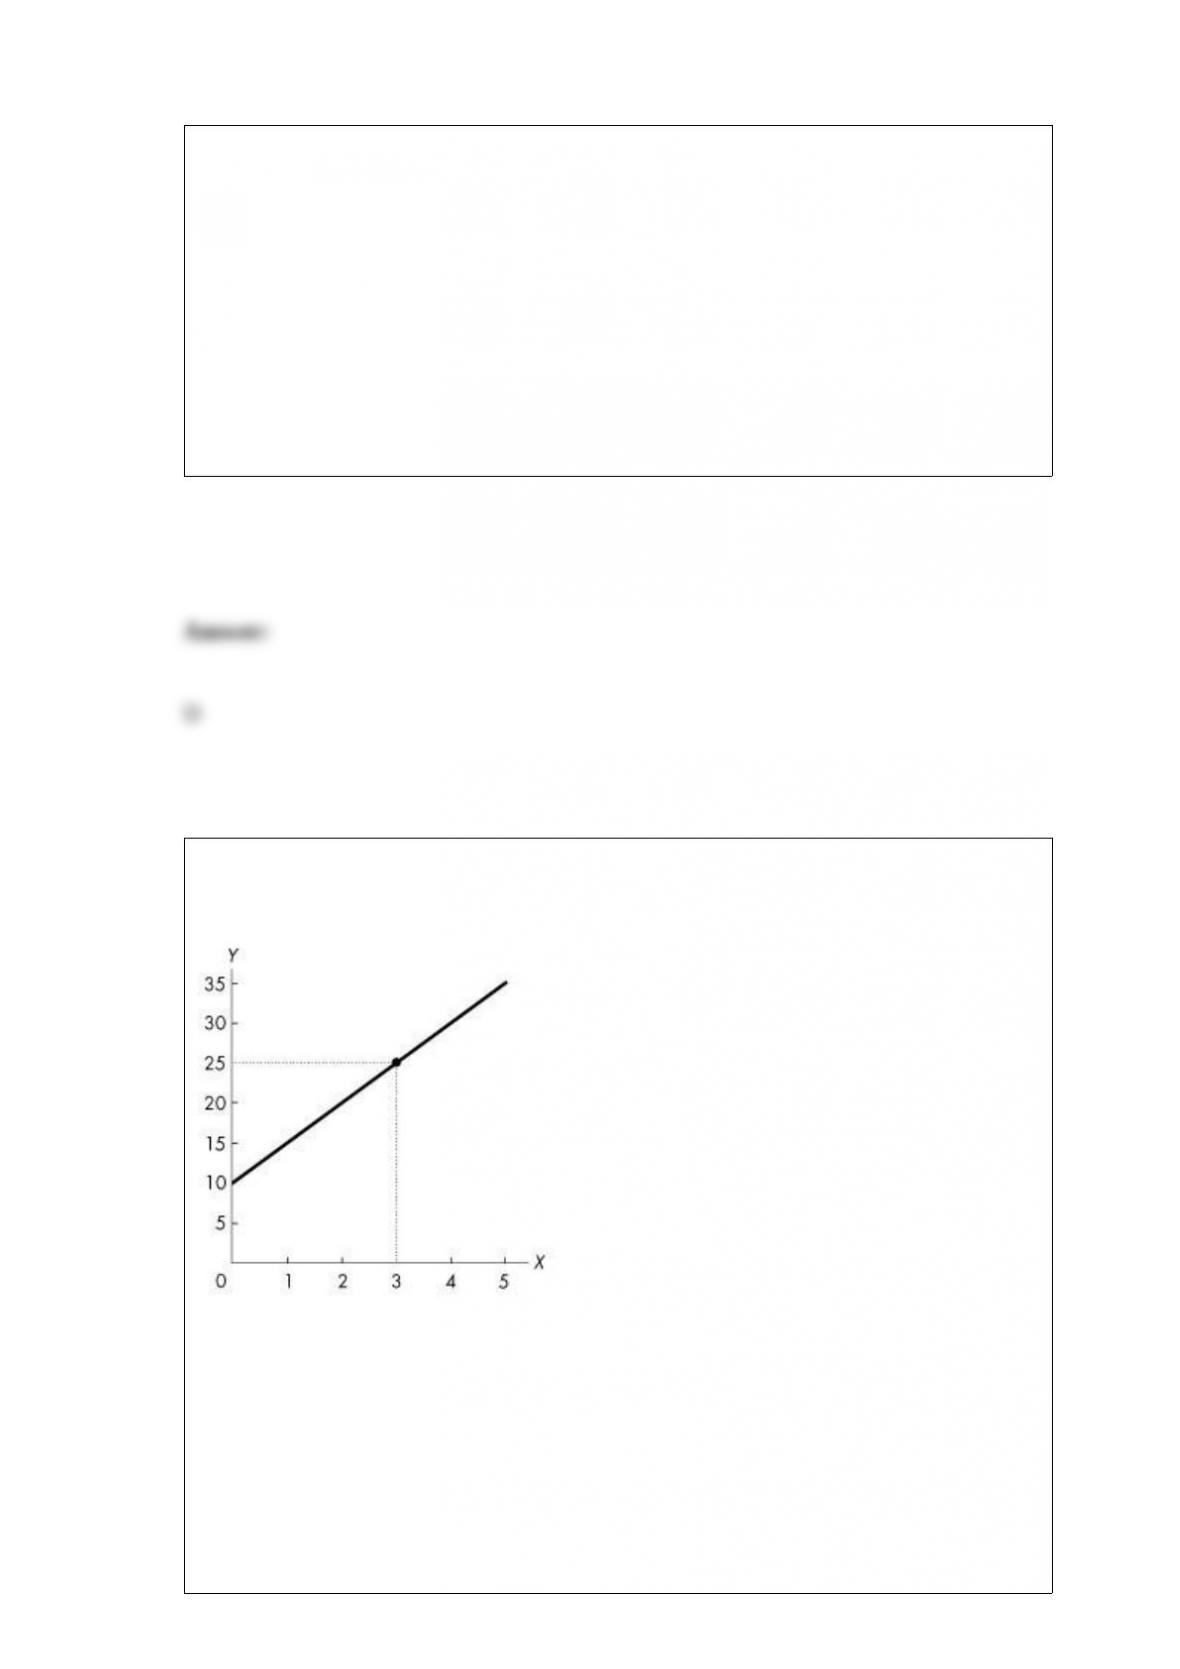
Use the figure below to answer the following question.
Figure 1A.5.4
Refer to Figure 1A.5.4. The graph shows the relationship between two variables, x and
y. This relationship is described by the equation
A) y = 5x2 + 10.
B) y = 10x + 5.

C) y = -5x + 10.
D) y = 5x + 10.
E) x = 10 + 5y.
Which statement is true for a normal good?
A) The income effect dominates the substitution effect.
B) The income effect reinforces the substitution effect.
C) As income increases, consumption decreases.
D) As income increases, consumption remains constant.
E) As price falls, we do not know whether consumption increases or decreases.
The relative price of beer to bacon is 2:1. If Bob’s current consumption is at a level
where MUbeer/MUbacon is 1:2, then to maximize total utility Bob must
A) consume more beer and less bacon.
B) not change his current consumption of beer and bacon.
C) consume less beer and more bacon.

D) raise the price of beer.
E) consume twice as much beer and half as much bacon.
Majority rule allocates resources in the way that
A) politicians choose.
B) a majority of voters choose.
C) democracies choose.
D) all voters choose.
E) the military chooses.
During 2014, the country of Economia had real GDP of $115 billion and the population
was 0.9 billion. In 2013, real GDP was $105 billion and the population was 0.85 billion.
In 2013, real GDP per person was
A) $128.
B) $124.
C) $135.
D) $117.

E) $1,235.
Refer to Table 19.4.2. The table shows three tax payment schemes. Which tax payment
plan has no effect on inequality?
A) Plan B
B) Plan C
C) Plan A
D) Plan A and Plan C
E) Plan B and Plan C
A market demand curve is constructed by
A) adding the prices all consumers are willing to pay for any given quantity.
B) determining the quantity supplied by all producers at all possible prices.
C) subtracting the quantity supplied by all producers from the quantity demanded by all
individuals at each price.
D) adding the quantities demanded by all individuals at each price.

E) subtracting the quantity demanded by all individuals from the quantity supplied by
all producers at each price.
The legal responsibility for debts incurred by a sole proprietorship falls upon
A) the shareholders.
B) the partners of the sole proprietorship.
C) the owner.
D) the creditors.
E) the managers.
Refer to Table 11.2.1 which gives Tania’s total product schedule. Average product of
labour reaches its maximum for the ________ worker.
A) first
B) second
C) third
D) fourth
E) fifth

An import quota is
A) a tariff that is a fixed percentage of the price of a good.
B) a tariff that is a fixed dollar amount per unit of a good.
C) an agreed upon price for a good to be imported at a specified future date.
D) a restriction that specifies the maximum amount of a good that may be imported.
E) the same as an export subsidy.
Refer to Figure 16.2.1. The figure shows the marginal private cost curve, the marginal
social cost curve and the market demand curve. If the market is unregulated, then at the
equilibrium output the marginal social cost of production is
A) less than the marginal benefit to consumers.
B) greater than the marginal benefit to consumers.
C) equal to the marginal benefit to consumers.
D) equal to the marginal private cost of production.
E) less than the marginal private cost of production.
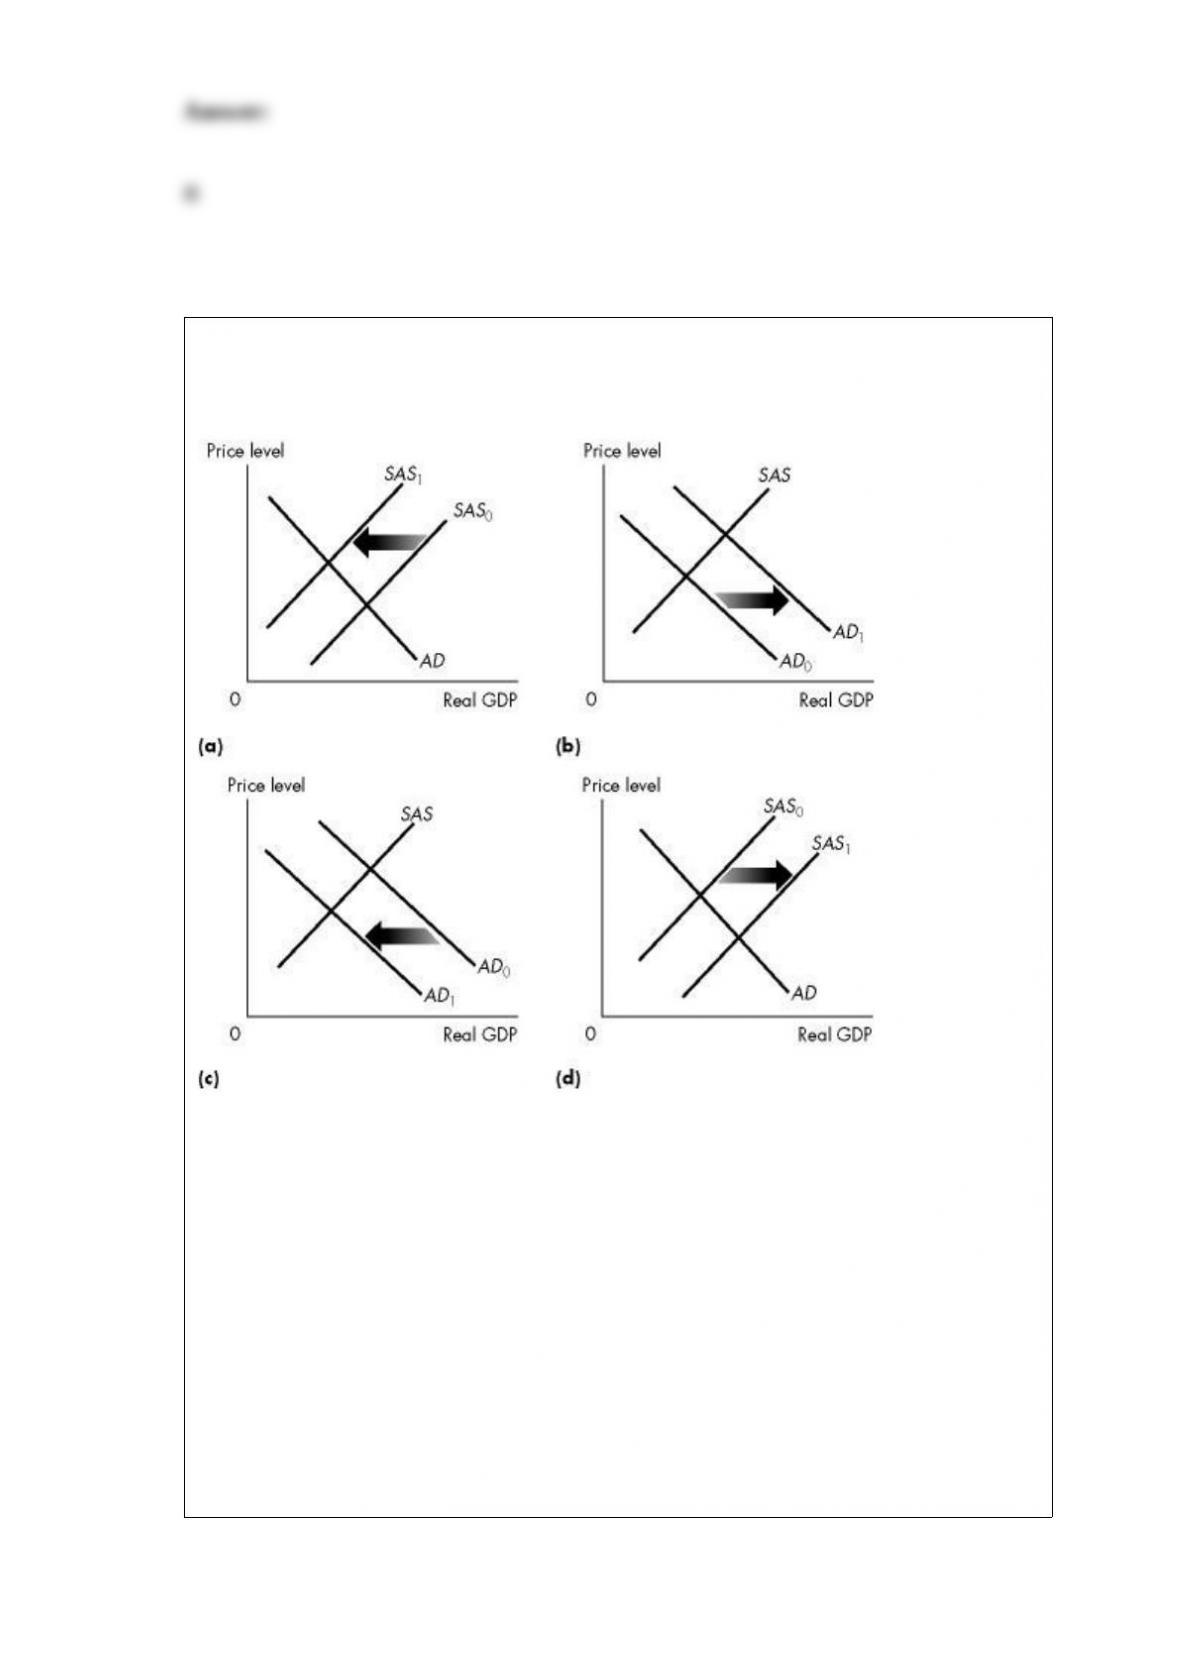
Use the figure below to answer the following question.
Figure 28.2.5
Refer to Figure 28.2.5. Which one of the graphs in the figure represents an economy
experiencing stagflation?
A) (a) only
B) (b) only
C) (c) only
D) (d) only
E) Both (a) and (c)

Use the table below to answer the following question.
Table 1A.2.2
Refer to Table 1A.2.2. What type of relationship exists between y and z?
A) negative
B) positive
C) inverse
D) No consistent relationship exists.
E) first a positive relationship, then a negative one
When the price of a good increased by 5 percent, the quantity demanded of it decreased
10 percent. The price elasticity of demand is ________. A price rise will ________ total
revenue.
A) 2.0; decrease
B) 0.5; decrease
C) 2.0; increase
D) 0.5; increase

E) -2.0; decrease