Campbell Biology, 10e (Reece)
Chapter 53 Population Ecology
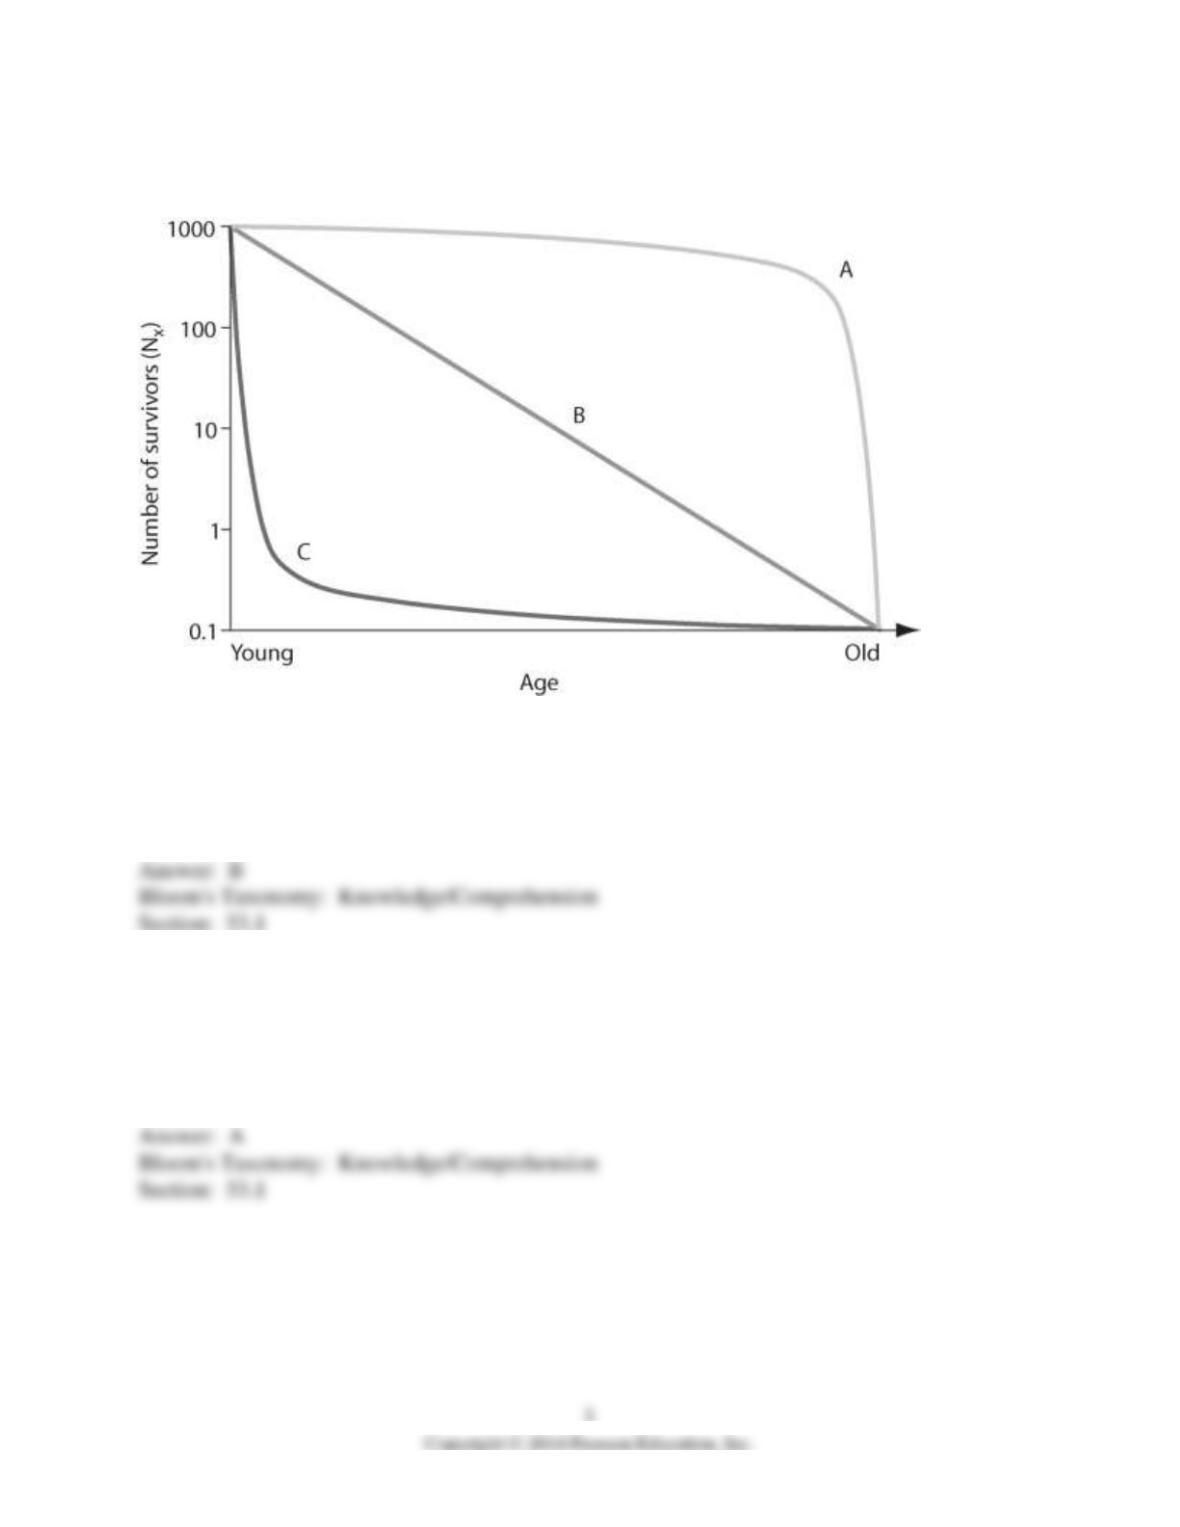
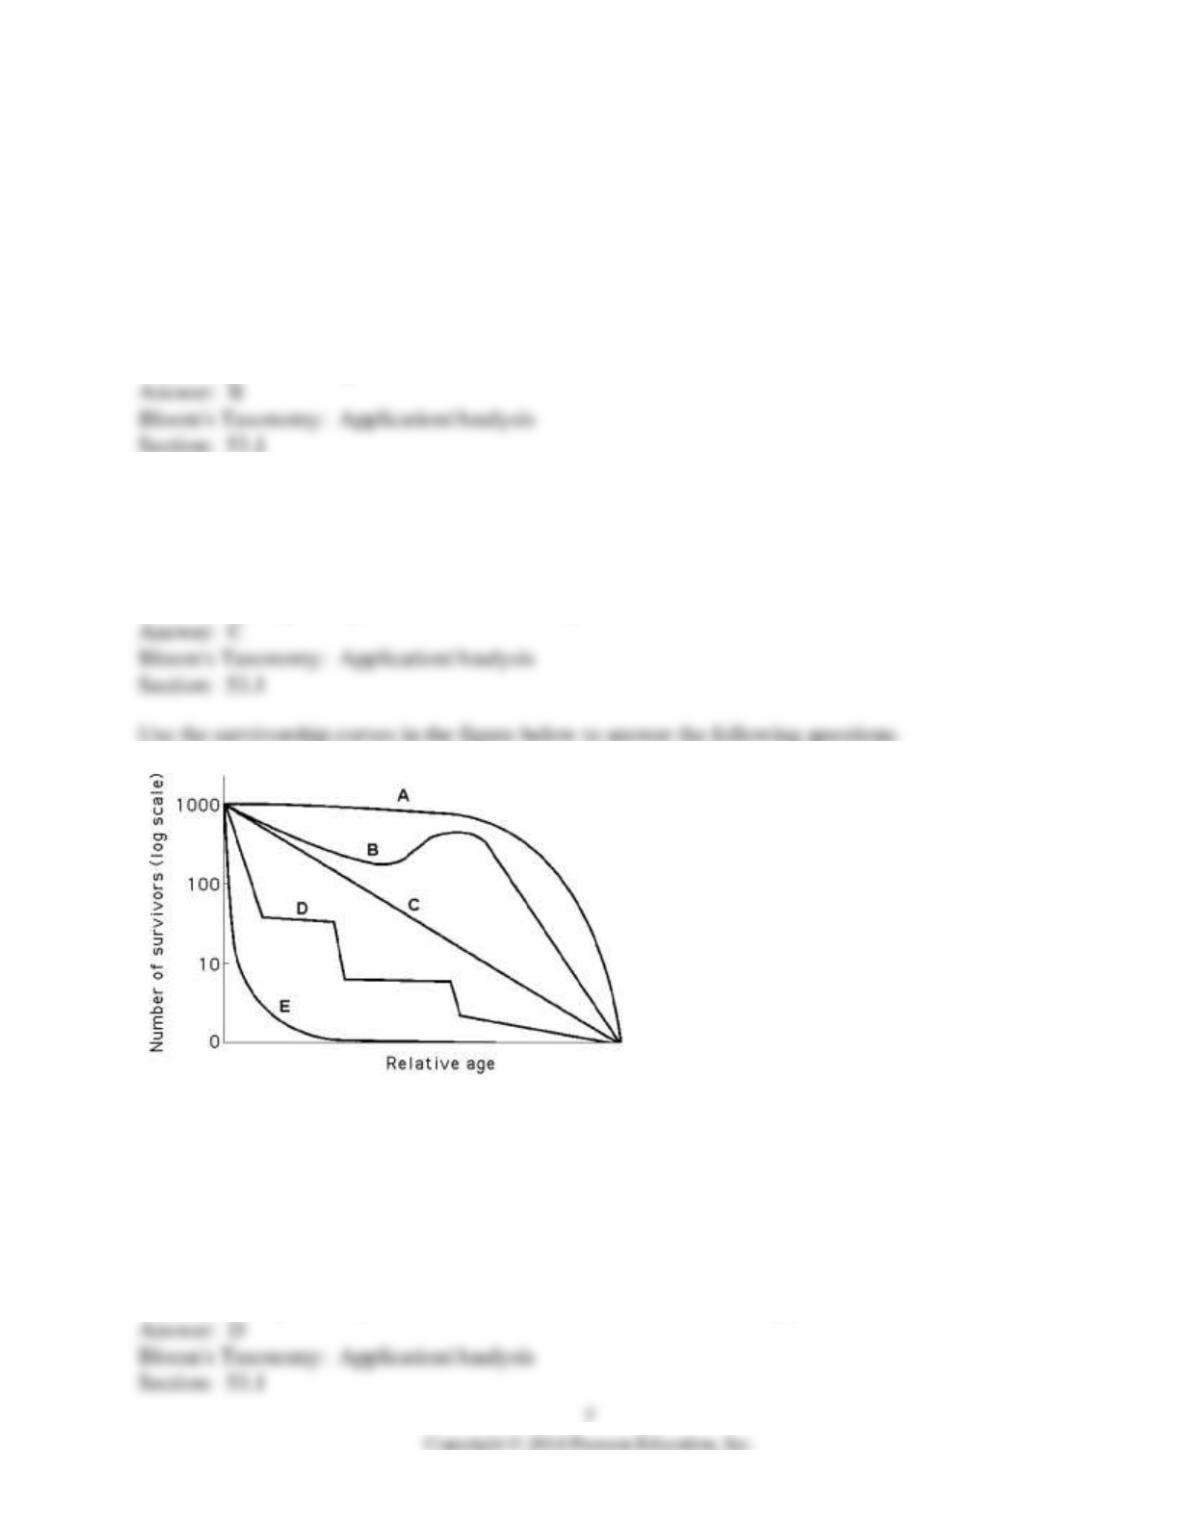
1) In the figure above, which of the following survivorship curves implies that an animal may lay
many eggs, of which a regular number die each year on a logarithmic scale?
A) curve A
B) curve B
C) curve C
2) In the figure above, which of the following survivorship curves most applies to humans living
in developed countries?
A) curve A
B) curve B
C) curve C
D) curve A or curve B
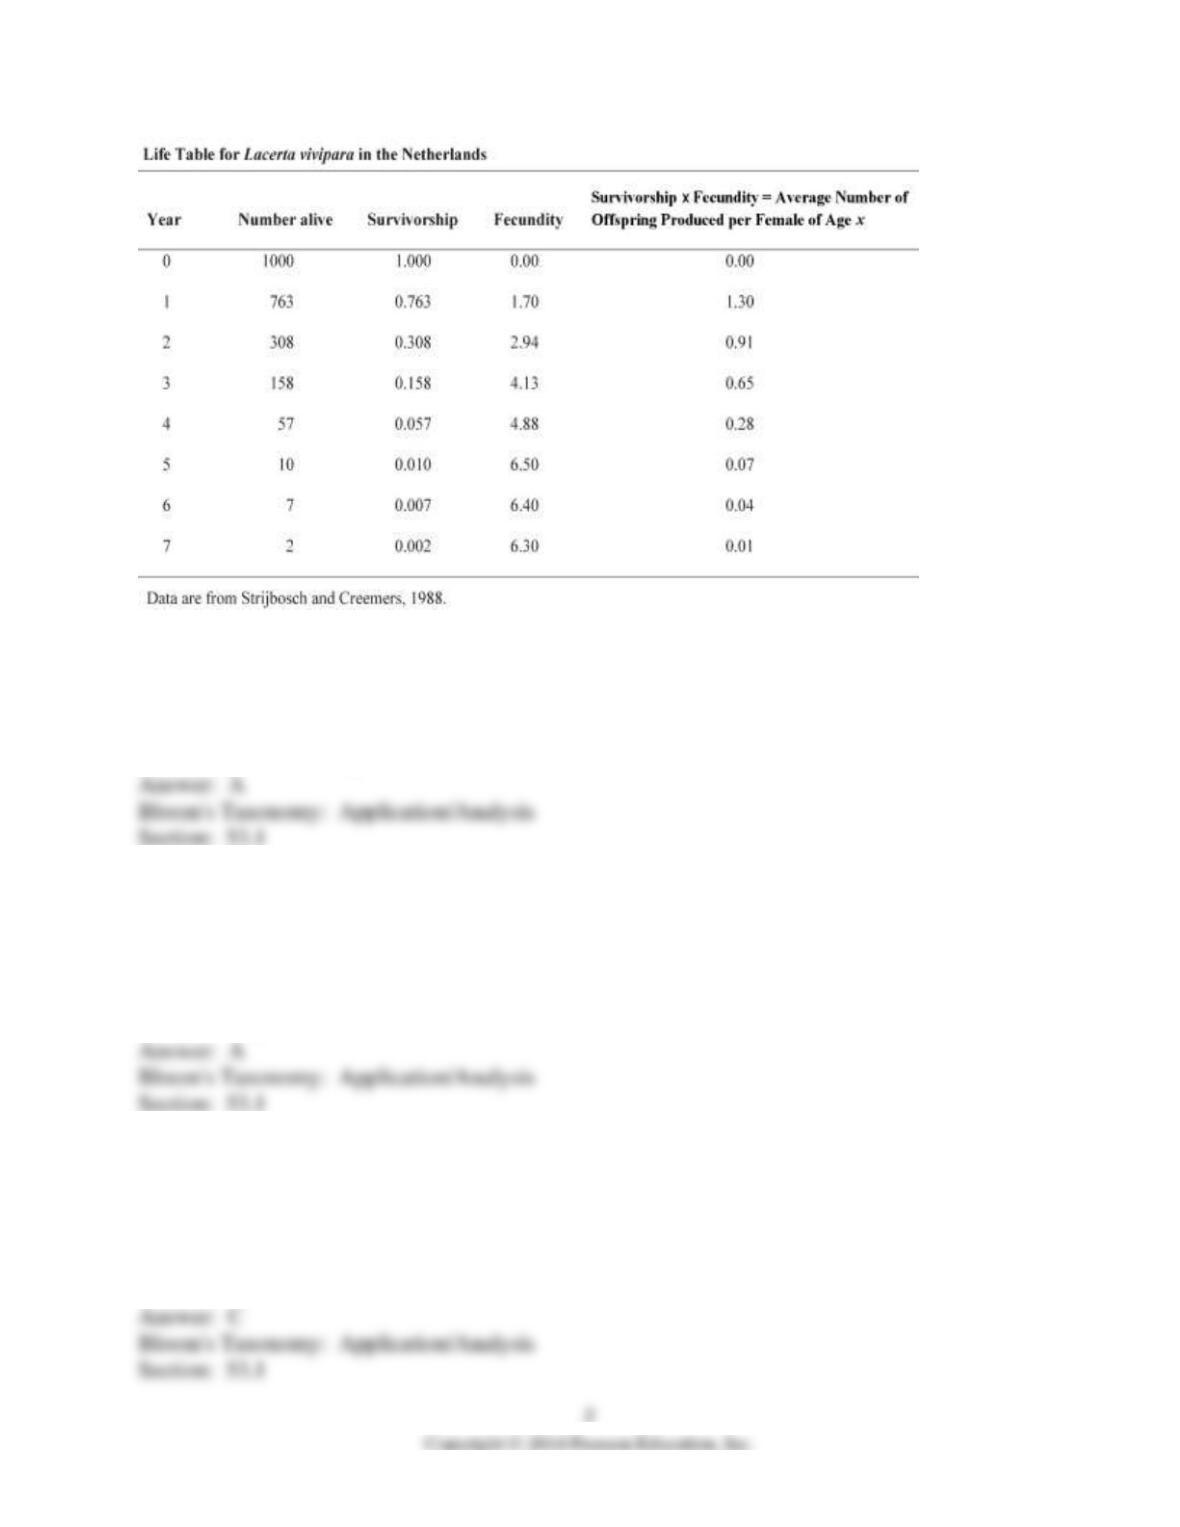
3) Using the table above, how would you describe the population dynamics of L. vivipara?
A) The population is increasing.
B) The population is decreasing.
C) The population is stable.
D) The figure does not provide this information.
4) Using the table above, determine which age class year would hurt the population growth most
if it were wiped out by disease.
A) age class year 1
B) age class year 2
C) age class year 3
D) age class year 4
5) Suppose researchers marked 800 turtles and later were able to trap a total of 300 individuals in
that population, of which 150 were marked. What is the estimate for total population size?
A) 200
B) 1050
C) 1600
D) 2100
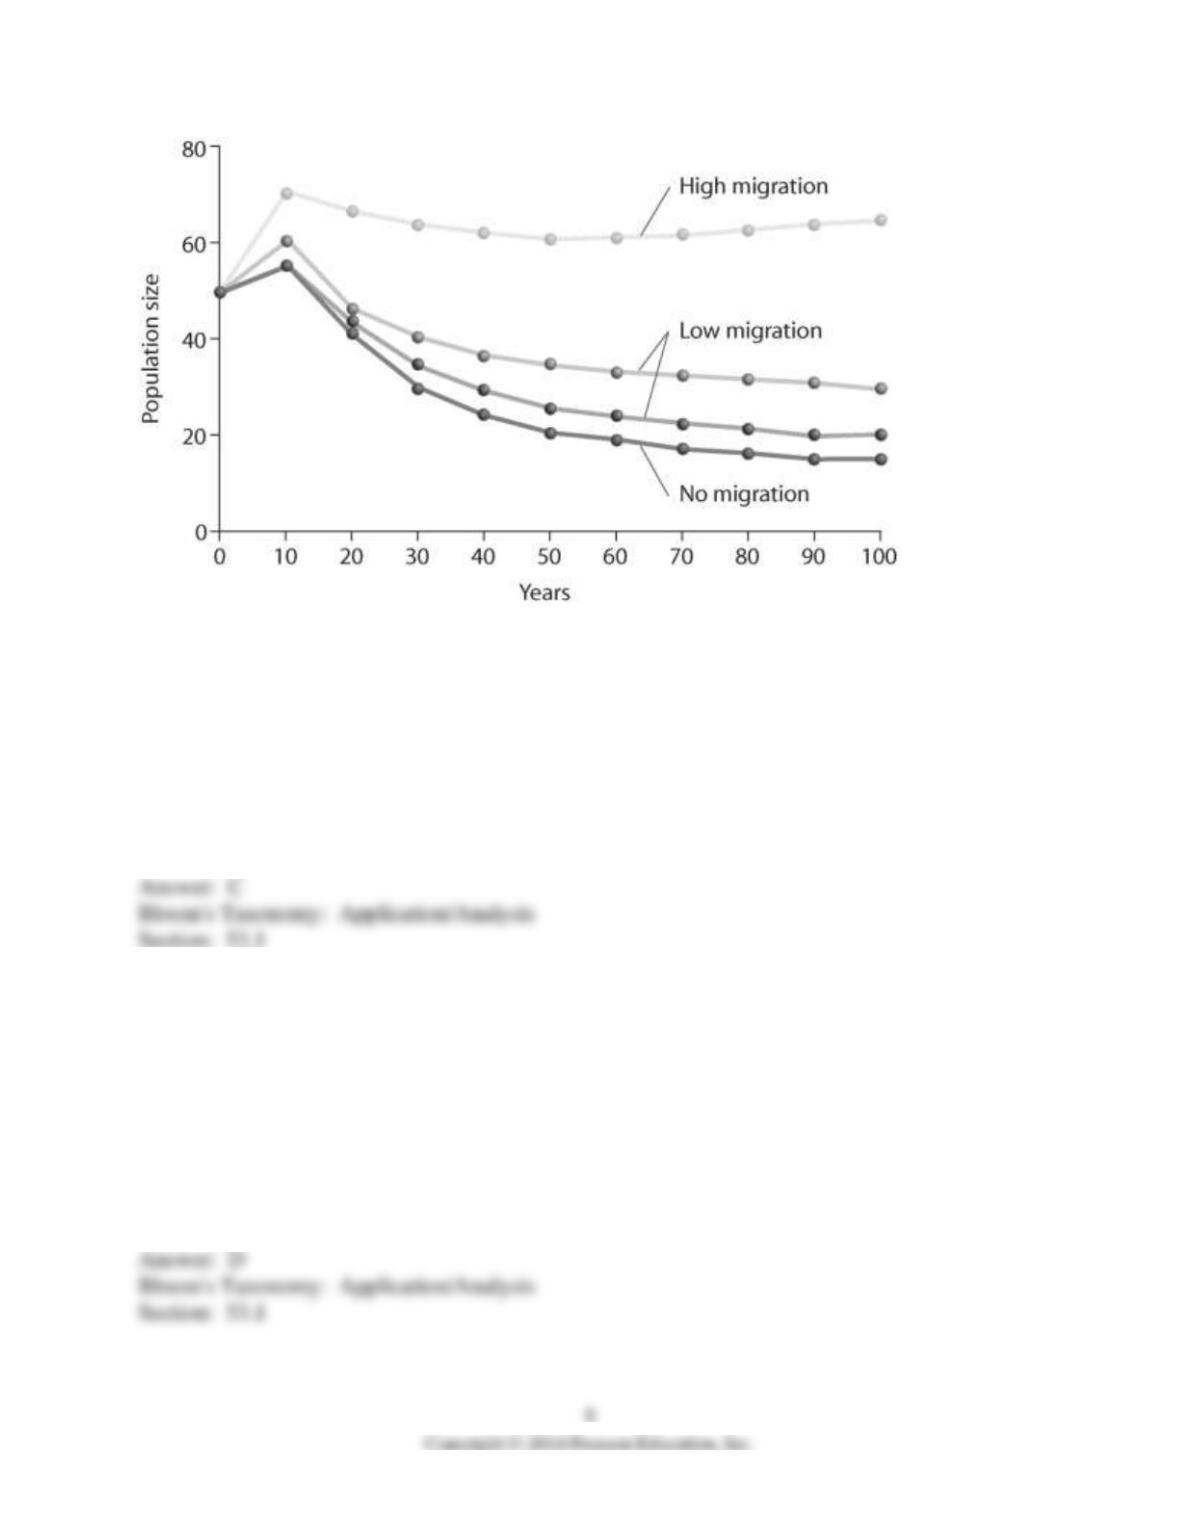
6) Looking at the figure above, what is contributing significantly to stabilizing population size
over time?
I) no migration
II) low migration
III) high migration
A) only I
B) only II
C) only III
D) only II and III
7) Which of the following assumptions have to be made regarding the mark-recapture estimate of
population size?
I) Marked and unmarked individuals have the same probability of being trapped.
II) The marked individuals have thoroughly mixed with the population after being marked.
III) No individuals have entered or left the population by immigration or emigration, and no
individuals have been added by birth or eliminated by death during the course of the estimate.
A) I only
B) II only
C) I and II only
D) I, II, and III
8) Which of the following is the most important assumption for the mark-recapture method to
estimate the size of wildlife populations?
A) More individuals emigrate from, as opposed to immigrate into, a population.
B) Over 50% of the marked individuals need to be trapped during the recapture phase.
C) There is a 50:50 ratio of males to females in the population before and after trapping and
recapture.
D) Marked individuals have the same probability of being recaptured as unmarked individuals
during the recapture phase.
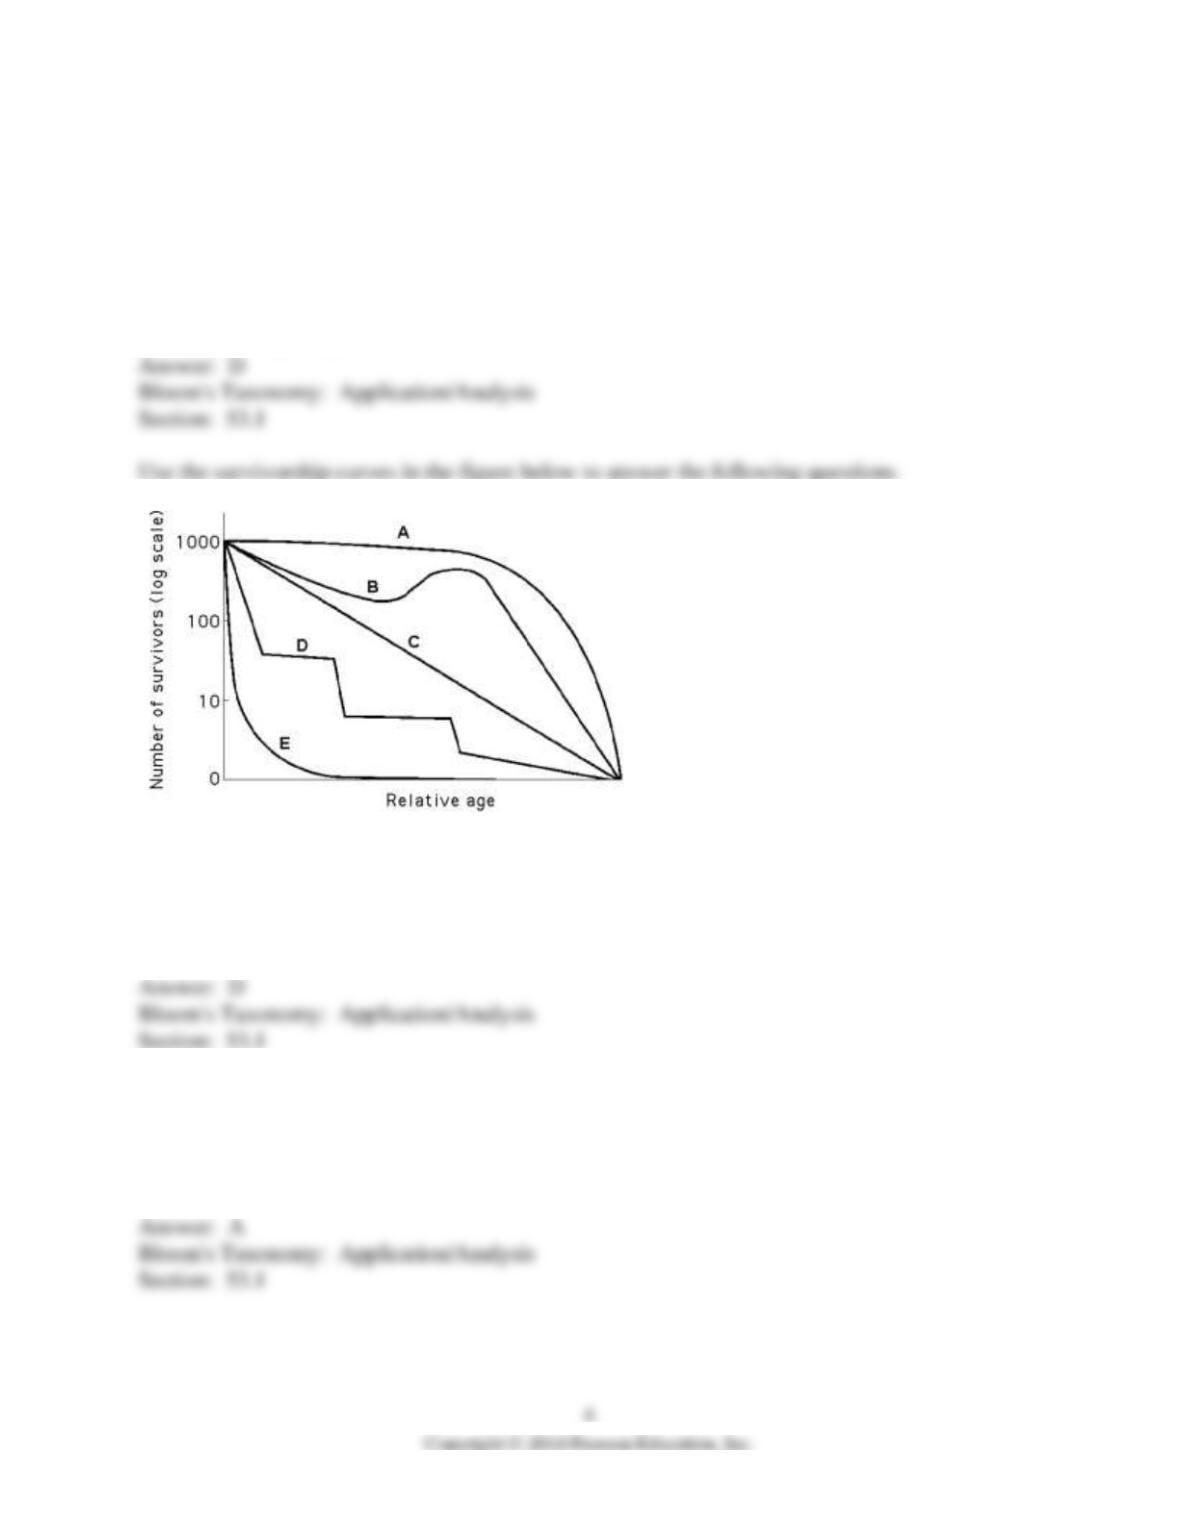
9) Refer to the figure above. Which curve best describes survivorship in marine molluscs?
A) A
B) B
C) C
D) E
10) Refer to the figure above. Which curve best describes survivorship in elephants?
A) A
B) B
C) C
D) E

11) To measure the population of lake trout in a 250-hectare lake, 400 individual trout were
netted and marked with a fin clip, then returned to the lake. The next week, the lake was netted
again, and out of the 200 lake trout that were caught, 50 had fin clips. Using the mark-recapture
estimate, the lake trout population size could be closest to which of the following?
A) 200
B) 400
C) 1,600
D) 80,000
12) Long-term studies of Belding’s ground squirrels show that immigrants move nearly 2
kilometers from where they are born and become 1%-8% of the males and 0.7%-6% of the
females in other populations. On an evolutionary scale, why is this significant?
A) These immigrants make up for the deaths of individuals, keeping the other populations’ size
stable.
B) These immigrants provide a source of genetic diversity for the other populations.
C) Those individuals that emigrate to these new populations are looking for less crowded
conditions with more resources.
D) Gradually, the populations of ground squirrels will move from a clumped to a uniform
population pattern of dispersion.
13) A population is correctly defined as having which of the following characteristics?
I) inhabiting the same general area
II) belonging to the same species
III) possessing a constant and uniform density and dispersion
A) III only
B) I and II only
C) II and III only
D) I, II, and III

14) An ecologist recorded twelve white-tailed deer, Odocoileus virginianus, per square kilometer
in one woodlot and twenty per square kilometer in another woodlot. What was the ecologist
comparing?
A) density
B) dispersion
C) carrying capacity
D) range
15) Uniform spacing patterns in plants such as the creosote bush are most often associated with
_____.
A) patterns of high humidity
B) the random distribution of seeds
C) competitive interaction between individuals of the same population
D) the concentration of nutrients within the population’s range
16) Which of the following groups would be most likely to exhibit uniform dispersion?
A) red squirrels, who actively defend territories
B) cattails, which grow primarily at edges of lakes and streams
C) dwarf mistletoes, which parasitize particular species of forest tree
D) lake trout, which seek out cold, deep water high in dissolved oxygen
17) Which of the following examples would most accurately measure the density of the
population being studied?
A) counting the number of times a one-kilometer transect is intersected by tracks of red squirrels
after a snowfall
B) counting the number of coyote droppings per hectare
C) counting the number of moss plants in one-square-meter quadrants
D) counting the number of zebras from airplane census observations.
18) Which of the following scenarios would provide the most relevant data on population
density?
A) Count the number of nests of a particular species of songbird and multiply this by a factor that
extrapolates these data to actual animals.
B) Count the number of pine trees in several randomly selected 10-meter-square plots and
extrapolate this number to the fraction of the study area these plots represent.
C) Use the mark-recapture method to estimate the size of the population.
D) Calculate the difference between all of the immigrants and emigrants to see if the population
is growing or shrinking.
19) Which of the following is the best natural example of uniform distribution?
A) bees collecting pollen in a wildflower meadow
B) snails in an intertidal zone at low tide
C) territorial songbirds in a mature forest during mating season
D) mushrooms growing on the floor of an old growth forest
20) Refer to the figure above. Which statement best explains survivorship curve B?
A) It is likely a species that provides little postnatal care, but lots of care for offspring during
midlife as indicated by increased survivorship.
B) This curve is likely for a species that produces lots of offspring, only a few of which are
expected to survive.
C) It is likely a species where no individuals in the cohort die when they are at 60-70% relative
age.
D) Survivorship can only decrease; therefore, this curve could not happen in nature.
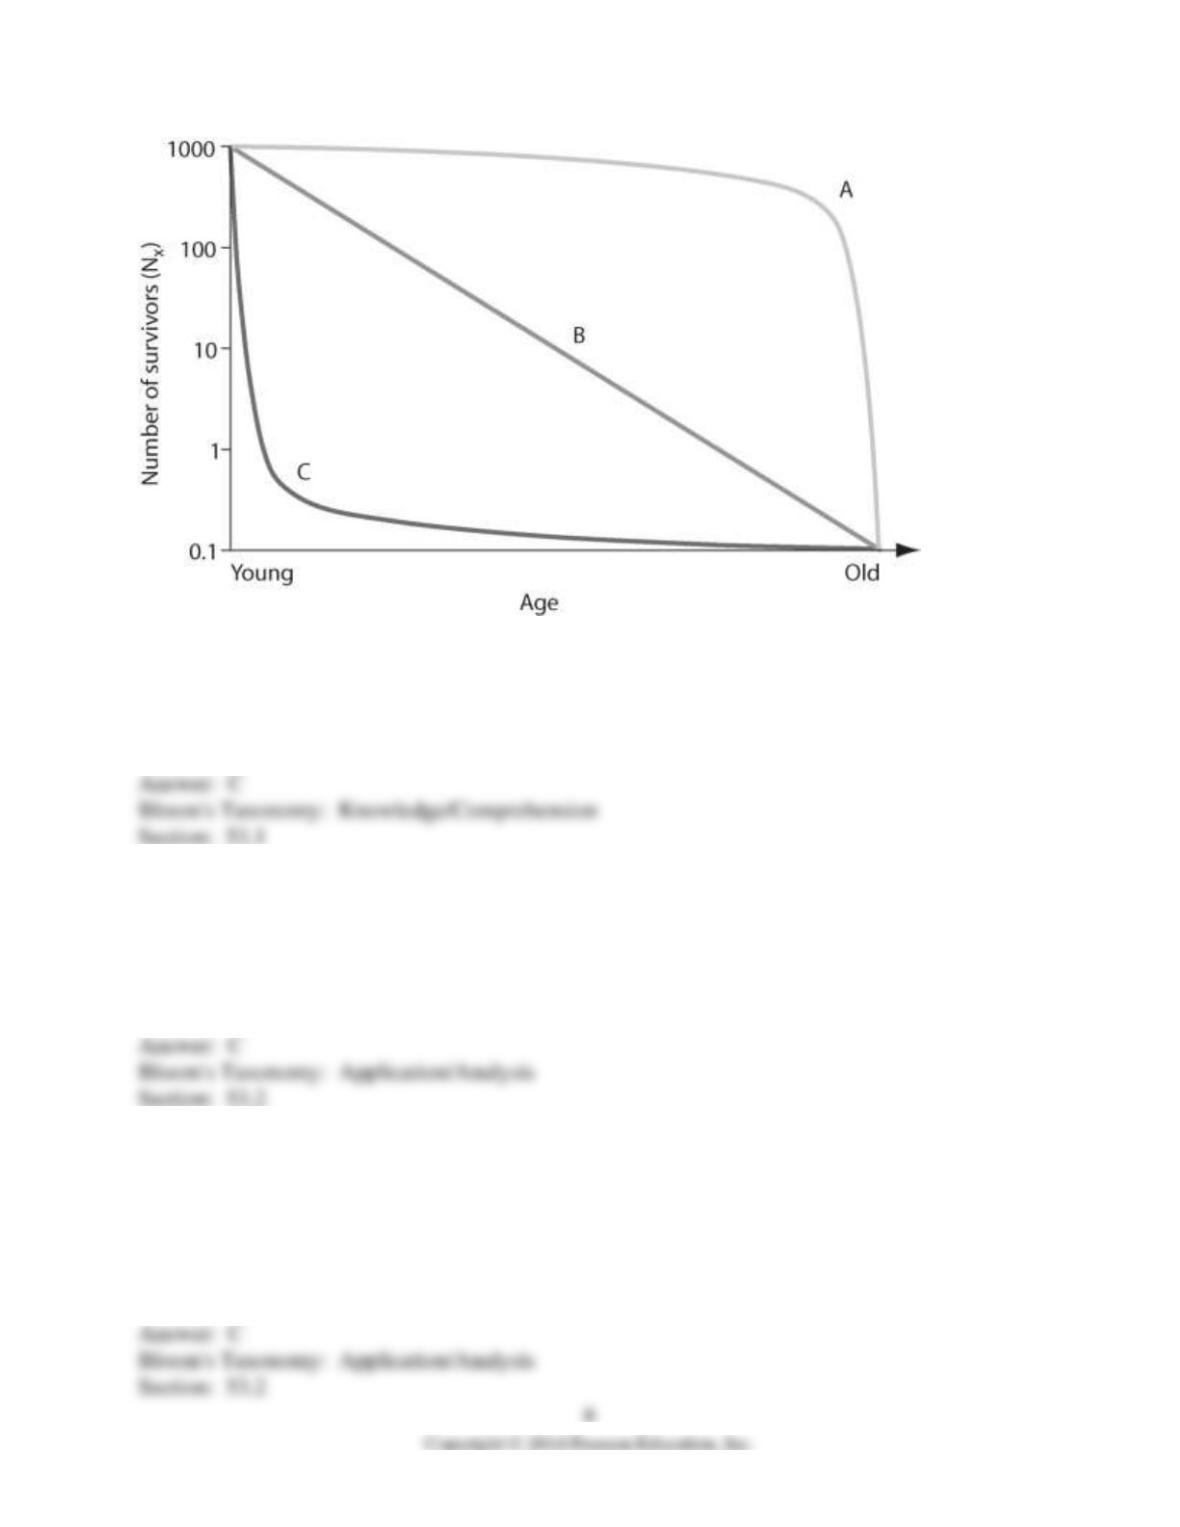
21) In the figure above, which of the following survivorship curves applies to most plant
species?
A) curve A
B) curve B
C) curve C
22) In July 2008, the United States had a population of approximately 302,000,000 people. How
many Americans were there in July 2009, if the estimated 2008 growth rate was 0.88%?
A) 5,500,000
B) 303,000,000
C) 304,000,000
D) 2,710,800,000
23) In 2008, the population of New Zealand was approximately 4,275,000 people. If the birth
rate was 14 births for every 1000 people, approximately how many births occurred in New
Zealand in 2008?
A) 6,000
B) 42,275
C) 60,000
D) 140,000
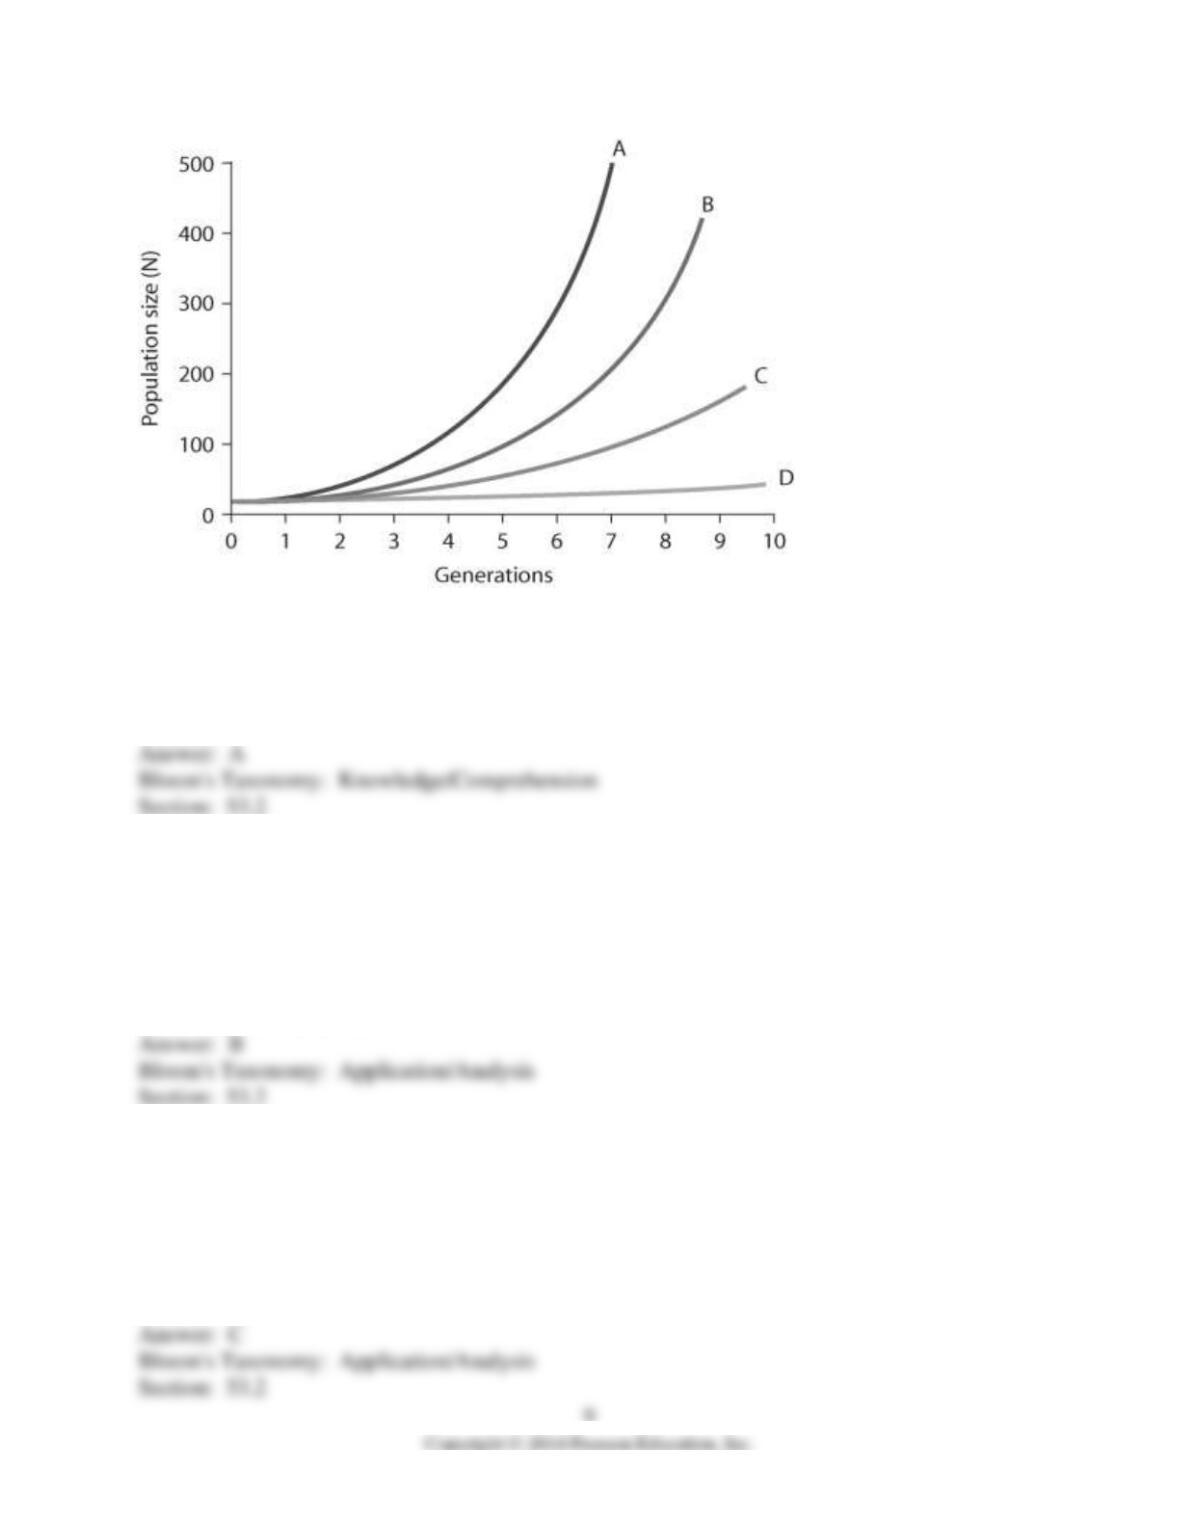
24) In the figure above, which of the lines represents the highest per-capita rate increase (r)?
A) line A
B) line B
C) line C
D) line D
25) A population of ground squirrels has an annual per capita birth rate of 0.06 and an annual per
capita death rate of 0.02. Calculate an estimate of the total number of individuals added to (or
lost from) a population of 1000 individuals in one year.
A) 120 individuals added
B) 40 individuals added
C) 20 individuals added
D) 400 individuals added
26) Starting from a single individual, what is the size of a population of bacteria at the end of a
two-hour time period if they reproduce by binary fission every twenty minutes? (Assume
unlimited resources and no mortality.)
A) 16
B) 32
C) 64
D) 128
27) Which of the following graphs illustrates the population growth curve of single bacterium
growing in a flask of ideal medium at optimum temperature over a two-hour period?
A)
B)
C)
D)

28) During exponential growth, a population always _____.
A) grows at its maximum per capita rate
B) quickly reaches its carrying capacity
C) cycles through time
D) loses some individuals to emigration
29) Consider two old-growth forests: one is undisturbed while the other is being logged. In
which region are species likely to experience exponential growth, and why?
A) Old growth, because of stable conditions that would favor exponential growth of all species in
the forest.
B) Old growth, because each of the species is well established and can produce many offspring.
C) Logged, because the disturbed forest affords more resources for increased specific
populations to grow.
D) Logged, because the various populations are stimulated to a higher reproductive potential.
30) Imagine that you are managing a large game ranch. You know from historical accounts that a
species of deer used to live there, but they have been extirpated. After doing some research to
determine what might be an appropriately sized founding population, you reintroduce them. You
then watch the population increase for several generations, and graph the number of individuals
(vertical axis) against the number of generations (horizontal axis). With no natural predators
impacting the population, the graph will likely appear as _____.
A) a diagonal line, getting higher with each generation
B) an “S” that ends with a vertical line
C) an upside-down “U”
D) a “J,” increasing with each generation
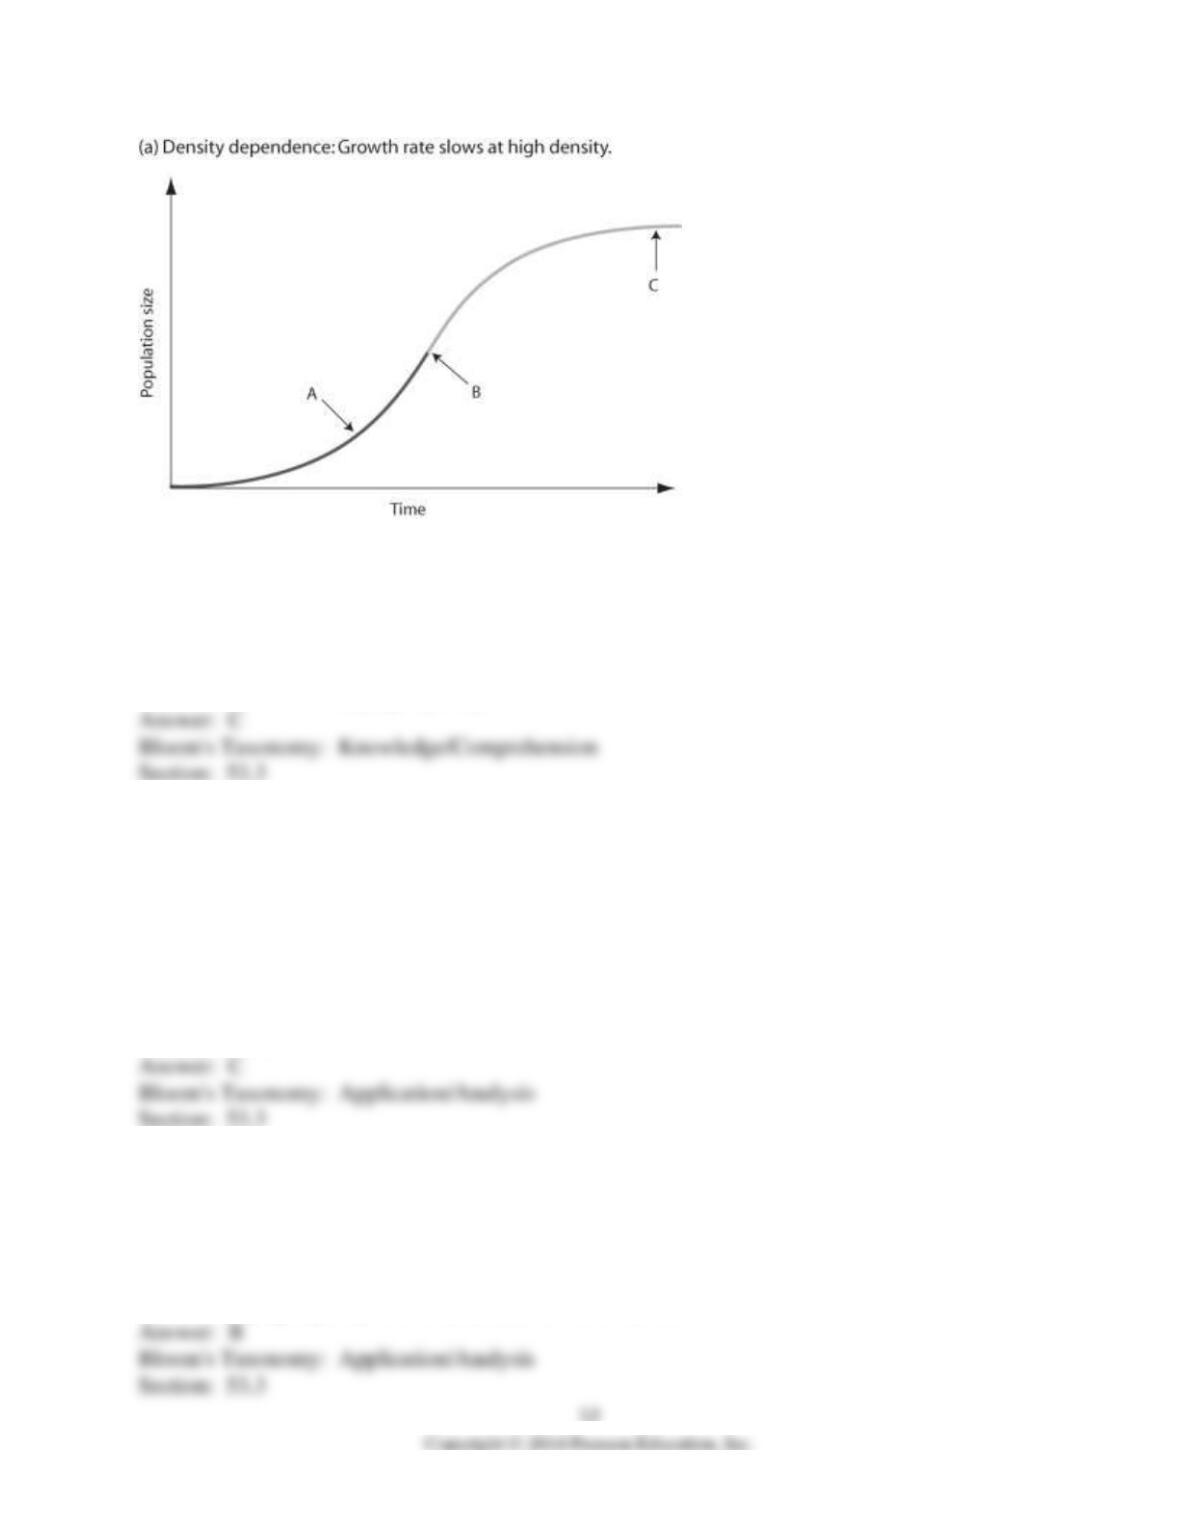
31) In the figure above, which of the arrows represents the carrying capacity?
A) arrow A
B) arrow B
C) arrow C
D) Carrying capacity cannot be found in the figure because species under density-dependent
control never reach carrying capacity.
32) Which statements about K are correct?
I) K varies among populations.
II) K varies in space.
III) K varies in time.
IV) K is constant for any given species.
A) only I and III
B) only II and IV
C) only I, II, and III
D) only II, III, and IV
33) As N approaches K for a certain population, which of the following is predicted by the
logistic equation?
A) The growth rate will not change.
B) The growth rate will approach zero.
C) The population will increase exponentially.
D) The carrying capacity of the environment will increase.

34) Which of the following causes populations to shift most quickly from an exponential to a
logistic population growth?
A) favorable climatic conditions
B) removal of predators
C) decreased death rate
D) competition for resources
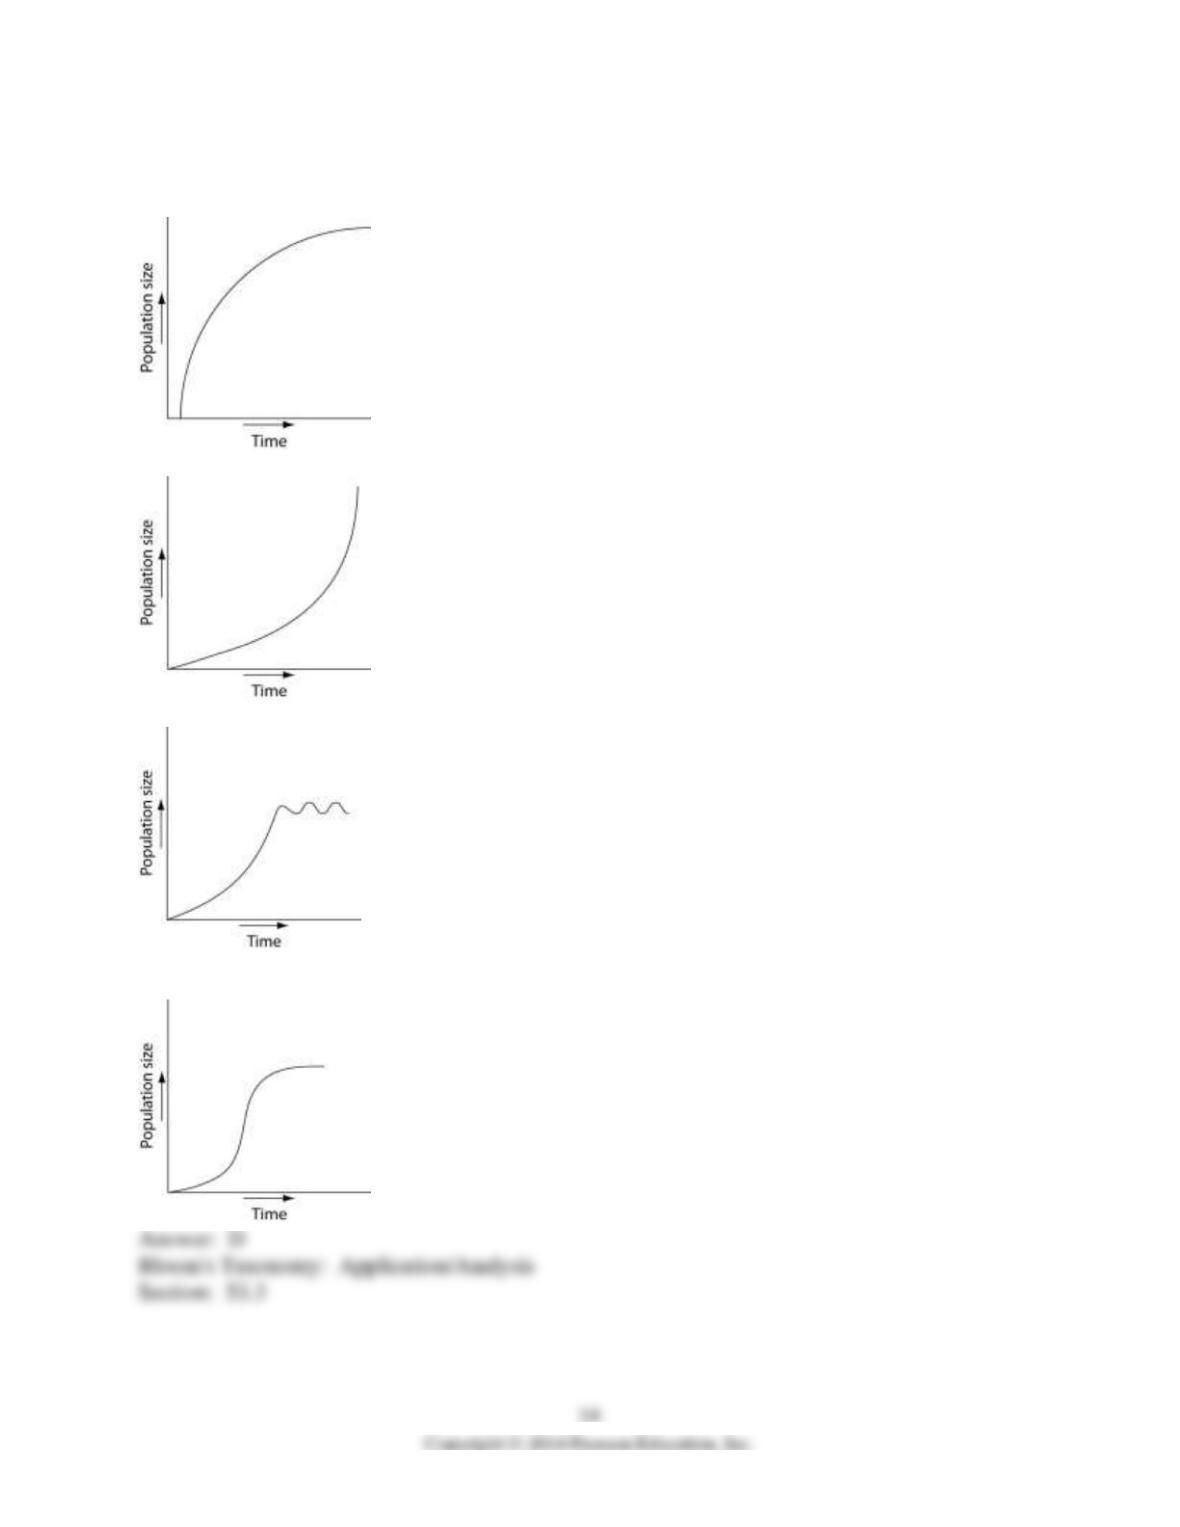
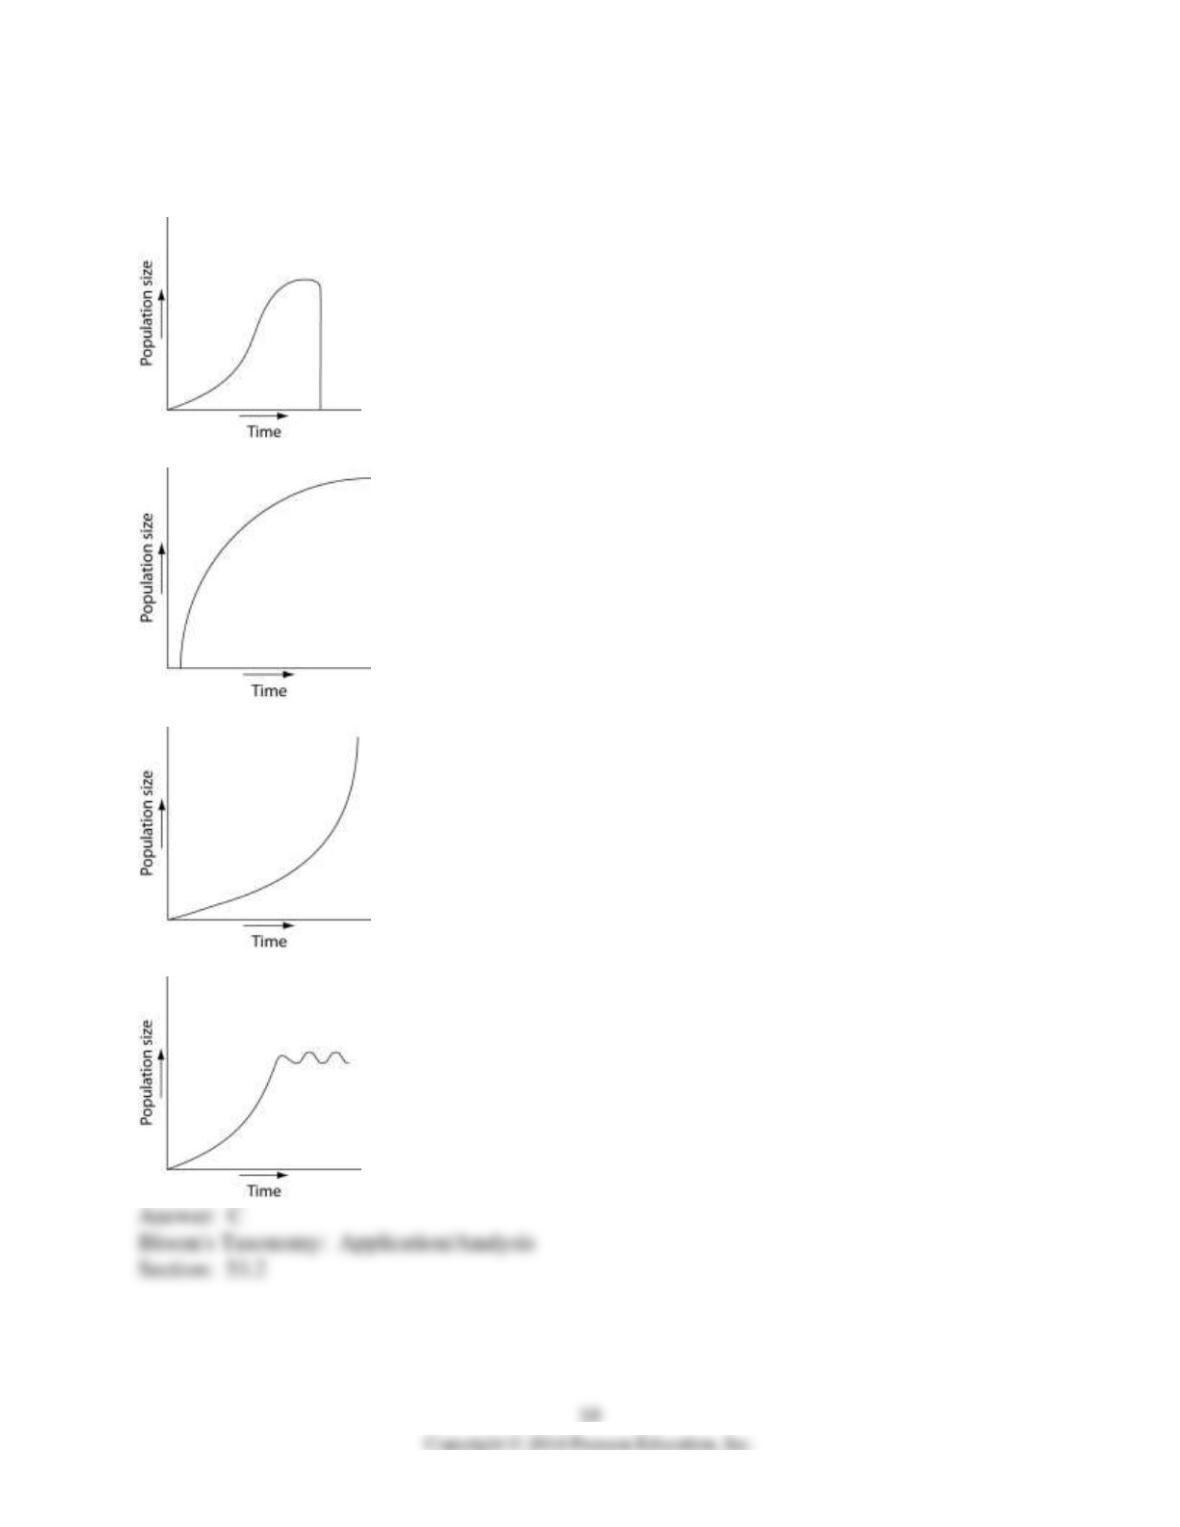
35) Which of the following graphs best illustrates the growth curve of a small population of
rodents that has increased to a static carrying capacity?
A)
B)
C)
D)