Chapter 8 – Cost-volume-profit analysis
MULTIPLE CHOICE
1. Total contribution margin is calculated by subtracting
a.
cost of goods sold from total revenues.
b.
fixed costs from total revenues.
c.
total manufacturing costs from total revenues.
d.
total variable costs from total revenues.
2. Which of the following items would NOT be considered in cost-volume-profit analysis?
a.
units of production
b.
fixed costs
c.
product mix
d.
gross profit margin
3. The contribution margin at the break-even point
a.
equals total fixed costs.
b.
is zero.
c.
plus total fixed costs equals total revenues.
d.
is greater than variable costs.
4. The break-even point is
a.
the volume of activity where all fixed costs are recovered.
b.
where fixed costs equal total variable costs.
c.
where total revenues equal total costs.
d.
where total costs equal total contribution margin.
Figure 8-1
The Kringel Company provides the following information:
Sales (200,000 units)
£500,000
Manufacturing costs:
Variable
170,000
Fixed
30,000
Selling and administrative costs:
Variable
80,000
Fixed
20,000
5. Refer to Figure 8-1. What is the break-even point in units for Kringel?
a.
33,334 units
b.
100,000 units
c.
40,000 units
d.
200,000 units
Figure 8-2
Lewis Production Company had the following projected information for 2011:
Selling price per unit
£150
Variable cost per unit
£90
Total fixed costs
£300,000
6. Refer to Figure 8-2. What is the break-even point in units?
a.
2,000 units
b.
5,000 units
c.
3,333 units
d.
60,000 units
7. Refer to Figure 8-2. What is the profit when one unit more than the break-even point is sold?
a.
£150
b.
£60
c.
£1,500,150
d.
£600,060
8. Refer to Figure 8-2. What is the contribution margin ratio?
a.
0.400
b.
1.667
c.
2.500
d.
0.600
Figure 8-3
Sarah Smith, a sole proprietor, has the following projected figures for next year:
Selling price per unit
£150.00
Contribution margin per unit
£45.00
Total fixed costs
£630,000
9. Refer to Figure 8-3. What is the break-even point in monetary terms?
a.
£426,000
b.
£2,100,000
c.
£189,000
d.
£900,000
10. Refer to Figure 8-3. How many units must be sold to obtain a target before-tax profit of £270,000?
a.
6,000 units
b.
20,000 units
c.
8,572 units
d.
14,000 units
11. Refer to Figure 8-3. What selling price per unit is needed to obtain a before-tax profit of £270,000 at a
volume of 4,000 units?
a.
£150.00
b.
£330.00
c.
£225.00
d.
£105.00
Figure 8-4
Dirth Company sells only one product at a regular price of £7.50 per unit. Variable expenses are 60 per
cent of sales and fixed expenses are £30,000. Management has decided to decrease the selling price to
£6.00 in hopes of increasing its volume of sales.
12. Refer to Figure 8-4. What is the monetary sales level required to break even at the old price of £7.50?
a.
£75,000
b.
£12,000
c.
£18,000
d.
£50,000
13. Refer to Figure 8-4. What sales pound level is needed to obtain a before-tax profit of £60,000 when the
selling price is £6.00 per unit?
a.
£360,000
b.
£120,000
c.
£72,000
d.
£90,000
14. Refer to Figure 8-4. What is the new break-even point in units for Dirth Company when the selling
price is £6.00?
a.
10,000 units
b.
6,667 units
c.
4,000 units
d.
20,000 units
15. Which of the following is a TRUE statement about sales mix?
a.
Profits may decline with an increase in total monetary sales if the sales mix shifts to sell
more of the high contribution margin product.
b.
Profits may decline with an increase in total monetary sales if the sales mix shifts to sell
more of the lower contribution margin product.
c.
Profits will remain constant with an increase in total monetary sales if the total sales in
units remains constant.
d.
Profits will remain constant with a decrease in total monetary sales if the sales mix also
remains constant.
Figure 8-5
Information about the Harmon Company’s two products includes:
Product X
Product Y
Unit selling price
£9.00
£9.00
Unit variable costs:
Manufacturing
£5.25
£6.75
Selling
__.75
__.75
Total
£6.00
£7.50
Monthly fixed costs are as follows:
Manufacturing
£ 82,500
Selling and administrative
__45,000
Total
£127,500
16. Refer to Figure 8-5. What is the total monthly sales volume in units required to break even when the
sales mix in units is 70 per cent Product X and 30 per cent Product Y?
a.
8,333 units
b.
50,000 units
c.
16,667 units
d.
56,667 units
17. Refer to Figure 8-5. If the sales mix in units is 50 per cent Product X and 50 per cent Product Y, the
monthly break-even total monetary sales is
a.
£150,000.
b.
£450,000.
c.
£510,000.
d.
£630,000.
18. Product 1 has a contribution margin of £6.00 per unit, and Product 2 has a contribution margin of
£7.50 per unit. Total fixed costs are £300,000. Sales mix and total volume varies from one period to
another. Which of the following is TRUE?
a.
At a sales volume in excess of 25,000 units of 1 and 25,000 units of 2, operations will be
profitable.
b.
The ratio of net profit to total sales for 2 will be larger than the ratio of net profit to total
sales for 1.
c.
The contribution margin per unit of direct materials is lower for 1 than for 2.
d.
The ratio of contribution to total sales always will be larger for 1 than for 2.
19. The following data pertain to the three products produced by Alberts Ltd.:
A
B
C
Selling price per unit
£5.00
£7.00
£6.00
Variable costs per unit
_4.00
_5.00
_3.00
Contribution margin per unit
£1.00
£2.00
£3.00
Fixed costs are £90,000 per month.
Sixty per cent of all units sold are Product A, 30 per cent are Product B, and 10 per cent are Product C.
What is the monthly break-even point for total units?
a.
45,000 units
b.
36,000 units
c.
60,000 units
d.
180,000 units
20. On a profit-volume graph, the profit line intersects the horizontal axis at
a.
the origin.
b.
the break-even point.
c.
a volume of 1,000 units.
d.
a point where profit is greater than zero.
21. Which of the following statements is TRUE?
a.
The slope of the total cost line is dependent on the variable cost per unit.
b.
The total cost line normally begins at zero.
c.
The total revenue line typically begins above zero.
d.
The slope of the total revenue line is the contribution margin per unit.
22. Cost-volume-profit models assume that
a.
the sales mix may vary among multiple products.
b.
unit selling prices are constant.
c.
inventories are dynamic and subject to change.
d.
the total cost function is quadratic.
23. Which of the following assumptions does NOT pertain to cost-profit-volume analysis?
a.
Sales price per unit remains constant.
b.
The sales mix is constant.
c.
Inventories in a manufacturing entity may go up or down.
d.
Fixed expenses are constant at all volumes of activities within the relevant range.
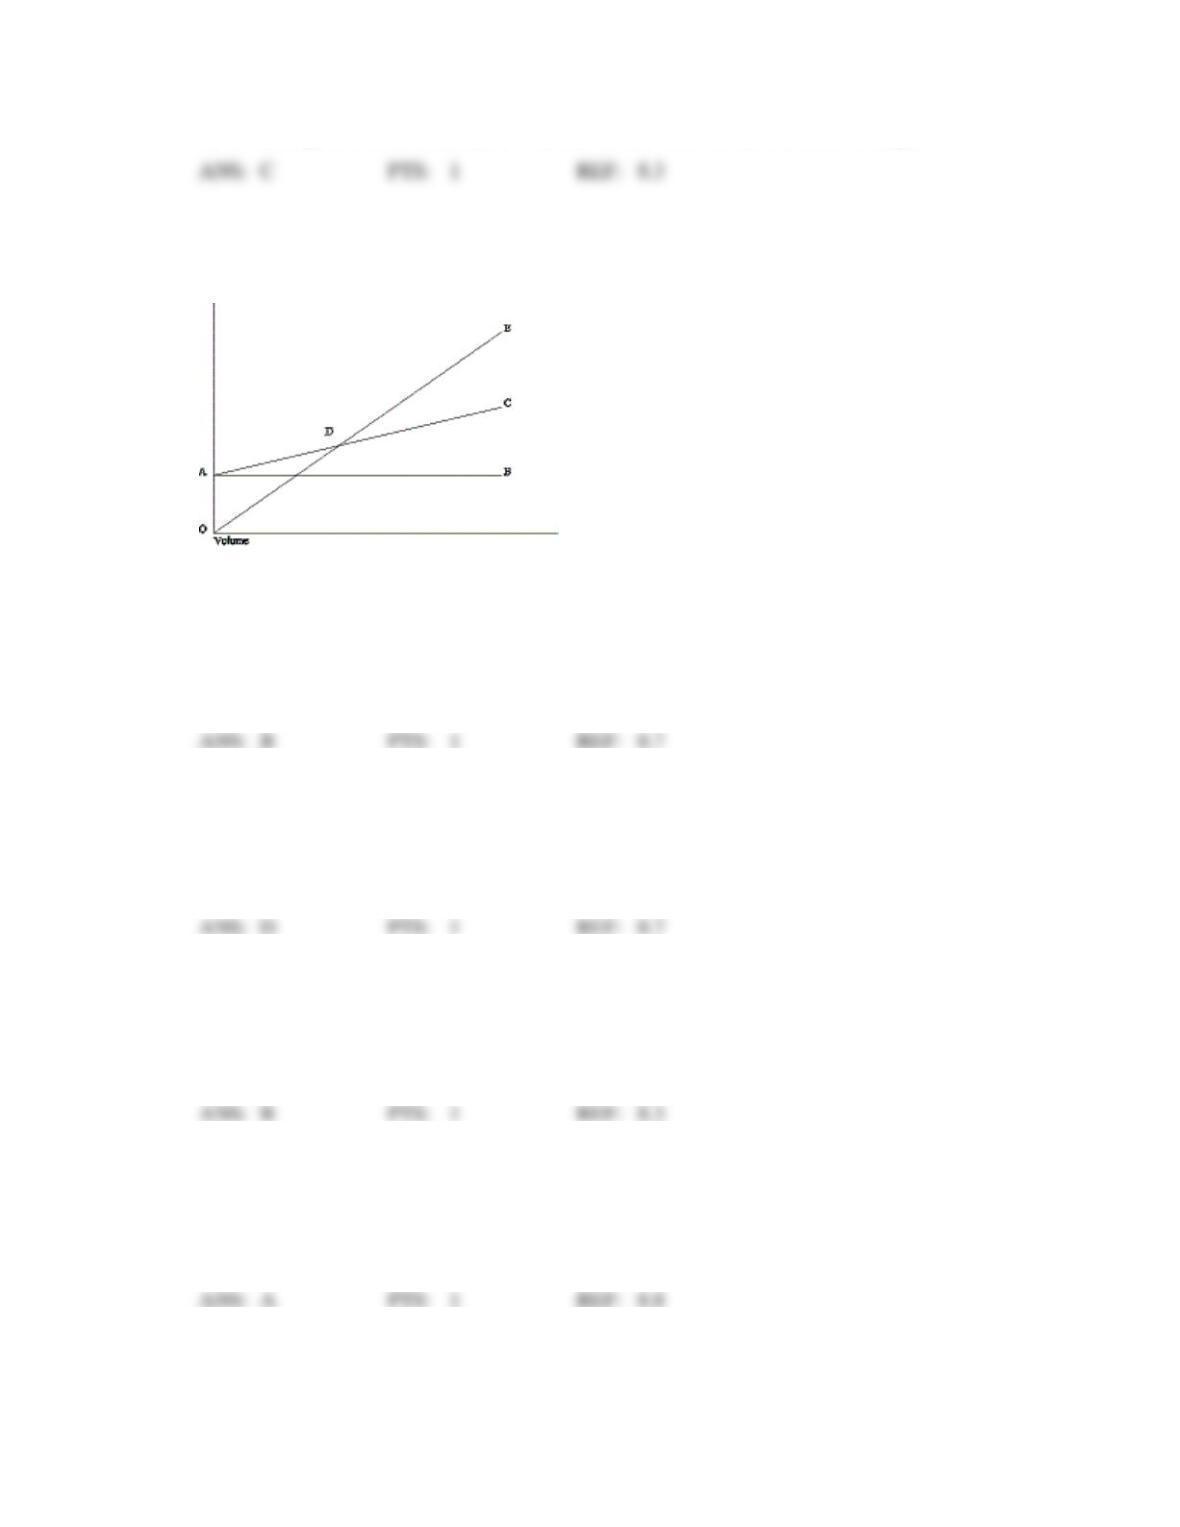
Figure 8-6
The following diagram is a cost-volume-profit graph for a manufacturing company:
24. Refer to Figure 8-6. The difference between line AB and line AC (area BAC) is the
a.
contribution ratio.
b.
total variable cost.
c.
contribution margin per unit.
d.
total fixed cost.
25. Refer to Figure 8-6. Select the answer that best describes the labeled item on the diagram.
a.
Area CDE represents the area of net loss.
b.
Line AC graphs total fixed costs.
c.
Point D represents the point at which the contribution margin per unit increases.
d.
Line AC graphs total costs.
26. When a company sells more units than the break-even point,
a.
it moves above the relevant range.
b.
profits are positive.
c.
there are no new variable costs incurred.
d.
profits are negative.
27. In a cost-volume-profit graph, the slope of the total revenue line represents
a.
the selling price per unit.
b.
the contribution margin per unit.
c.
the variable cost per unit.
d.
total contribution margin.
28. In a cost-volume-profit graph, the slope of the total cost line represents
a.
the selling price per unit.
b.
the contribution margin per unit.
c.
the variable cost per unit.
d.
total contribution margin.
29. On a profit-volume graph, the intersection of the profit line with the vertical axis provides a
a.
profit of £1,000.
b.
profit equal to zero.
c.
profit equal to fixed costs.
d.
loss equal to fixed costs.
30. A profit-volume graph
a.
measures profit or loss on the horizontal axis.
b.
illustrates total revenues, total cost, and profits at various sales volumes.
c.
is not subject to the same limiting assumptions as cost-volume-profit graphs.
d.
illustrates the relationship between volume and profits.
31. In a profit-volume graph, the slope of the profit line represents
a.
the selling price per unit.
b.
the contribution margin per unit.
c.
the variable cost per unit.
d.
total contribution margin.
32. Which of the following assumptions is NOT necessary for cost-volume-profit analysis?
a.
Total variable costs are linear.
b.
Total revenues increase when total costs increase.
c.
Inventories are constant.
d.
The product sales mix is constant.
33. Which of the following assumptions does NOT pertain to cost-volume-profit analysis?
a.
The units produced will equal the units sold.
b.
Inventories are constant.
c.
All costs are classified as fixed or variable.
d.
Sales mix may vary during the related period.
Figure 8-7
The income statement for Thomas Manufacturing Company for 2011 is as follows:
Sales (10,000 units)
£120,000
Variable expenses
__72,000
Contribution margin
£ 48,000
Fixed expenses
__36,000
Operating income
£ 12,000
34. Refer to Figure 8-7. If sales increase by £60,000, what will happen to profit?
a.
increase by £60,000
b.
increase by £24,000
c.
increase by £6,000
d.
increase by £36,000
35. Refer to Figure 8-7. What is the contribution margin per unit?
a.
£7.20
b.
£1.20
c.
£4.80
d.
£120,000
36. Assuming all other things are the same, contribution margin per unit must have ____ if there was an
increase in the break-even point.
a.
remained the same
b.
increased first, then decreased
c.
increased
d.
decreased
37. Assuming all other things are the same, selling price per unit must have ____ if there was a decrease in
the break-even point.
a.
remained the same
b.
increased first, then decreased
c.
increased
d.
decreased
38. Using cost-volume-profit analysis, we can conclude that a 20 per cent reduction in variable costs will
a.
reduce the break-even sales volume by 20 per cent.
b.
reduce total costs by 20 per cent.
c.
reduce the slope of the total cost line by 20 per cent.
d.
not affect the break-even sales volume if there is an offsetting 20 per cent increase in fixed
costs.
39. Assuming all other things are the same, variable cost per unit must have ____ if there was an increase
in the break-even point.
a.
remained the same
b.
increased first, then decreased
c.
increased
d.
depends on the circumstances
40. Assuming all other things are equal, fixed costs must have ____ if there was a decrease in the
break-even point.
a.
remained the same
b.
increased first, then decreased
c.
increased
d.
decreased
41. A decrease in the sales price in the basic cost-volume-profit model would
a.
require a recomputation of the gross profit per unit.
b.
be offset by an increase in unit costs.
c.
decrease the break-even volume.
d.
increase the break-even volume.
42. Camp Gordon has annual fixed operating costs of £150,000 and variable cost of £550 per camper.
Total fees charged to campers amount to £500 each. The camp expects 350 campers next summer.
Projected government grants are £95,000. How much must Camp Gordon raise from other sources to
break even?
a.
£45,000
b.
£37,500
c.
£97,500
d.
£72,500
Figure 8-8
Urban Company had the following information:
Activity Driver
Unit Variable Cost
Level of Activity Driver
Units sold
£ 20
—
Setups
1,200
60
Engineering hours
52
1,500
Other data:
Total fixed costs (traditional)
£600,000
Total fixed costs (ABC)
£300,000
Unit selling price
£60
43. Refer to Figure 8-8. Suppose Urban could reduce setup costs by £300 per setup and could reduce the
number of engineering hours needed to 1,400 hours. How many units must be sold to break even in
this case?
a.
10,670 units
b.
21,340 units
c.
6,350 units
d.
7,500 units
44. Which of the following statements is TRUE about relevant range?
a.
When costs reach a level above the relevant range, they are considered appropriate for
analysis.
b.
Linear estimates of an economist’s curvilinear cost function is only valid within the
relevant range.
c.
When costs reach a level below the relevant range, they are considered appropriate for
analysis.
d.
The nonlinear relevant range is ignored, and only those costs outside of this range may be
considered.
45. Management is interested in utilizing the full capacity of production facilities because it
a.
spreads variable costs over a greater number of units, thereby reducing the variable cost
per unit.
b.
spreads fixed costs over a greater number of units, thereby reducing the fixed cost per unit.
c.
reduces total variable costs.
d.
reduces total fixed costs.
46. What is the first step in classifying costs according to behaviour?
a.
identify the resources needed and the output of the activity
b.
measure the outputs and inputs
c.
determine the time horizon
d.
determine the impact of output changes on the activity cost
47. The range of operations within which a linear cost function is valid is called:
a.
the linear average.
b.
the relevant range.
c.
the marginal range.
d.
the functional range.
48. Which of the following statements is true concerning the use of linear analysis at high activity levels
(above the range for which the company’s facility was designed)?
a.
Linear analysis is well suited for estimating total costs at high activity levels.
b.
Linear analysis likely understates total costs at high activity levels.