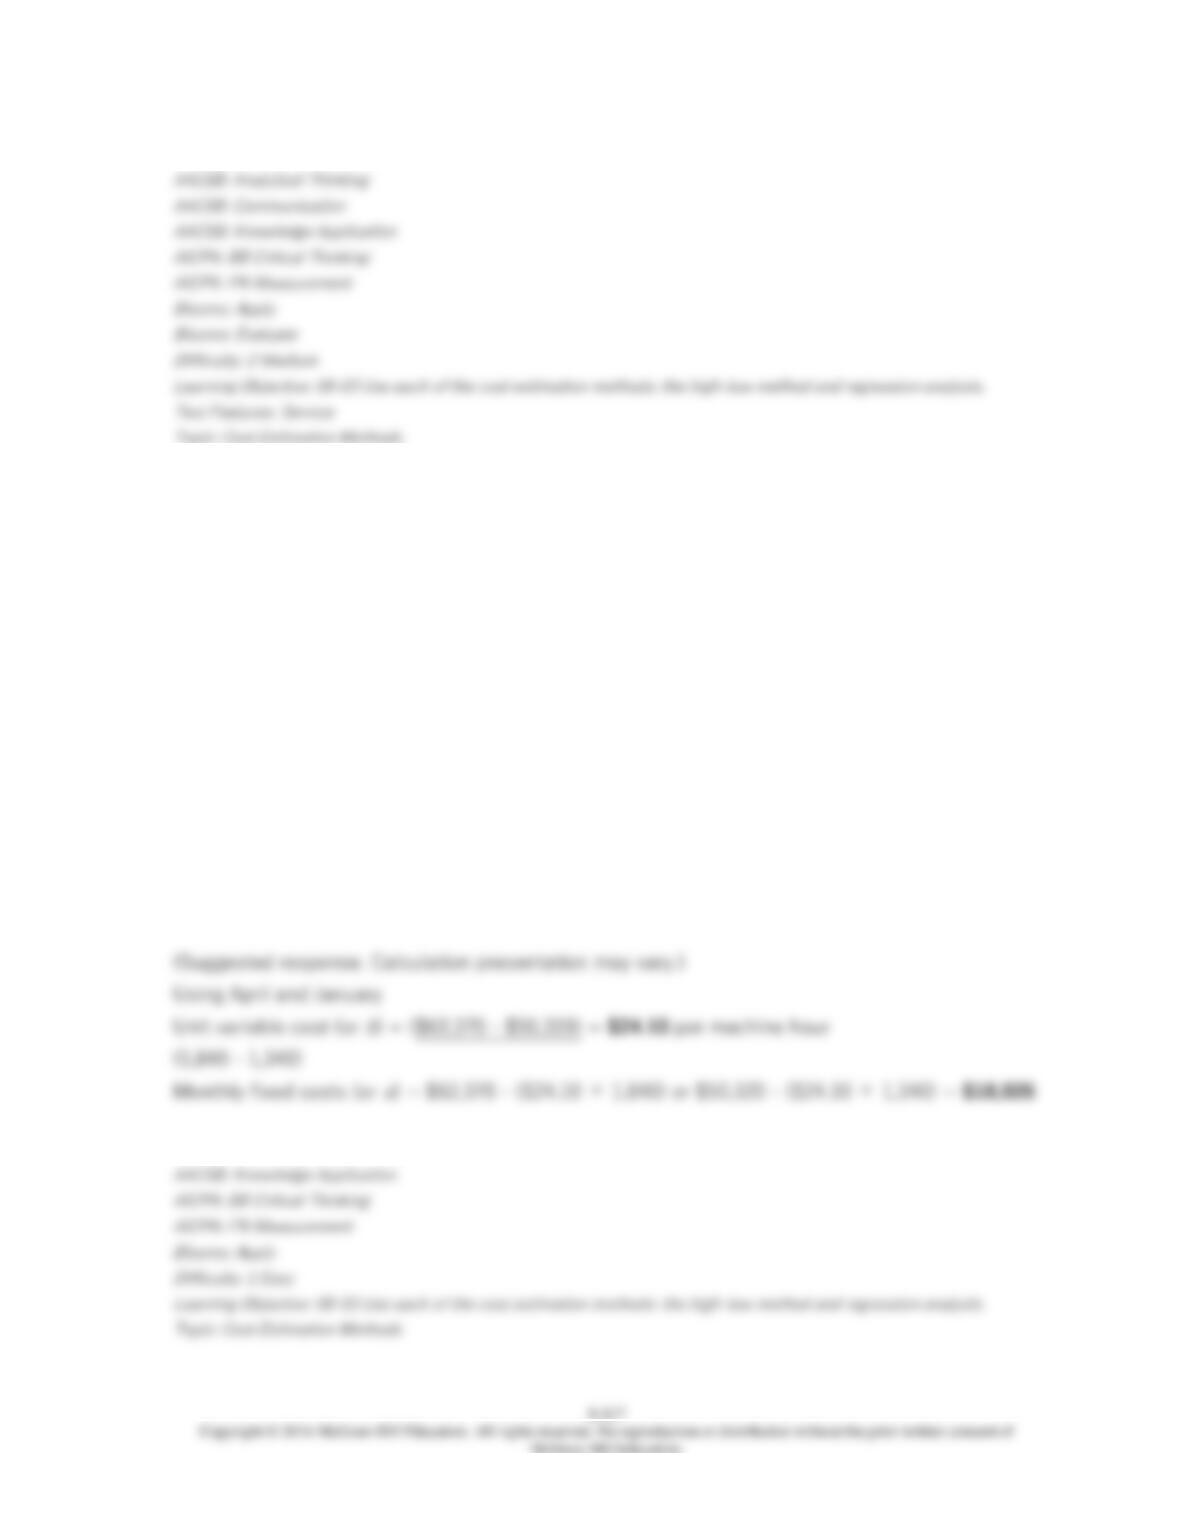
114. Train Express Co., which manufactures locomotive engines, is attempting to predict its
maintenance costs more accurately. Maintenance costs are a mixed cost. Maintenance costs and
machine hours for the first four months of the year are as follows:
Month Maintenance Costs Machine Hours
Jan. $50,320 1,340
Feb. 60,210 1,580
Mar. 58,005 1,450
Apr. 62,370 1,840
Required:
Using the high-low method, calculate unit variable cost and monthly fixed costs.
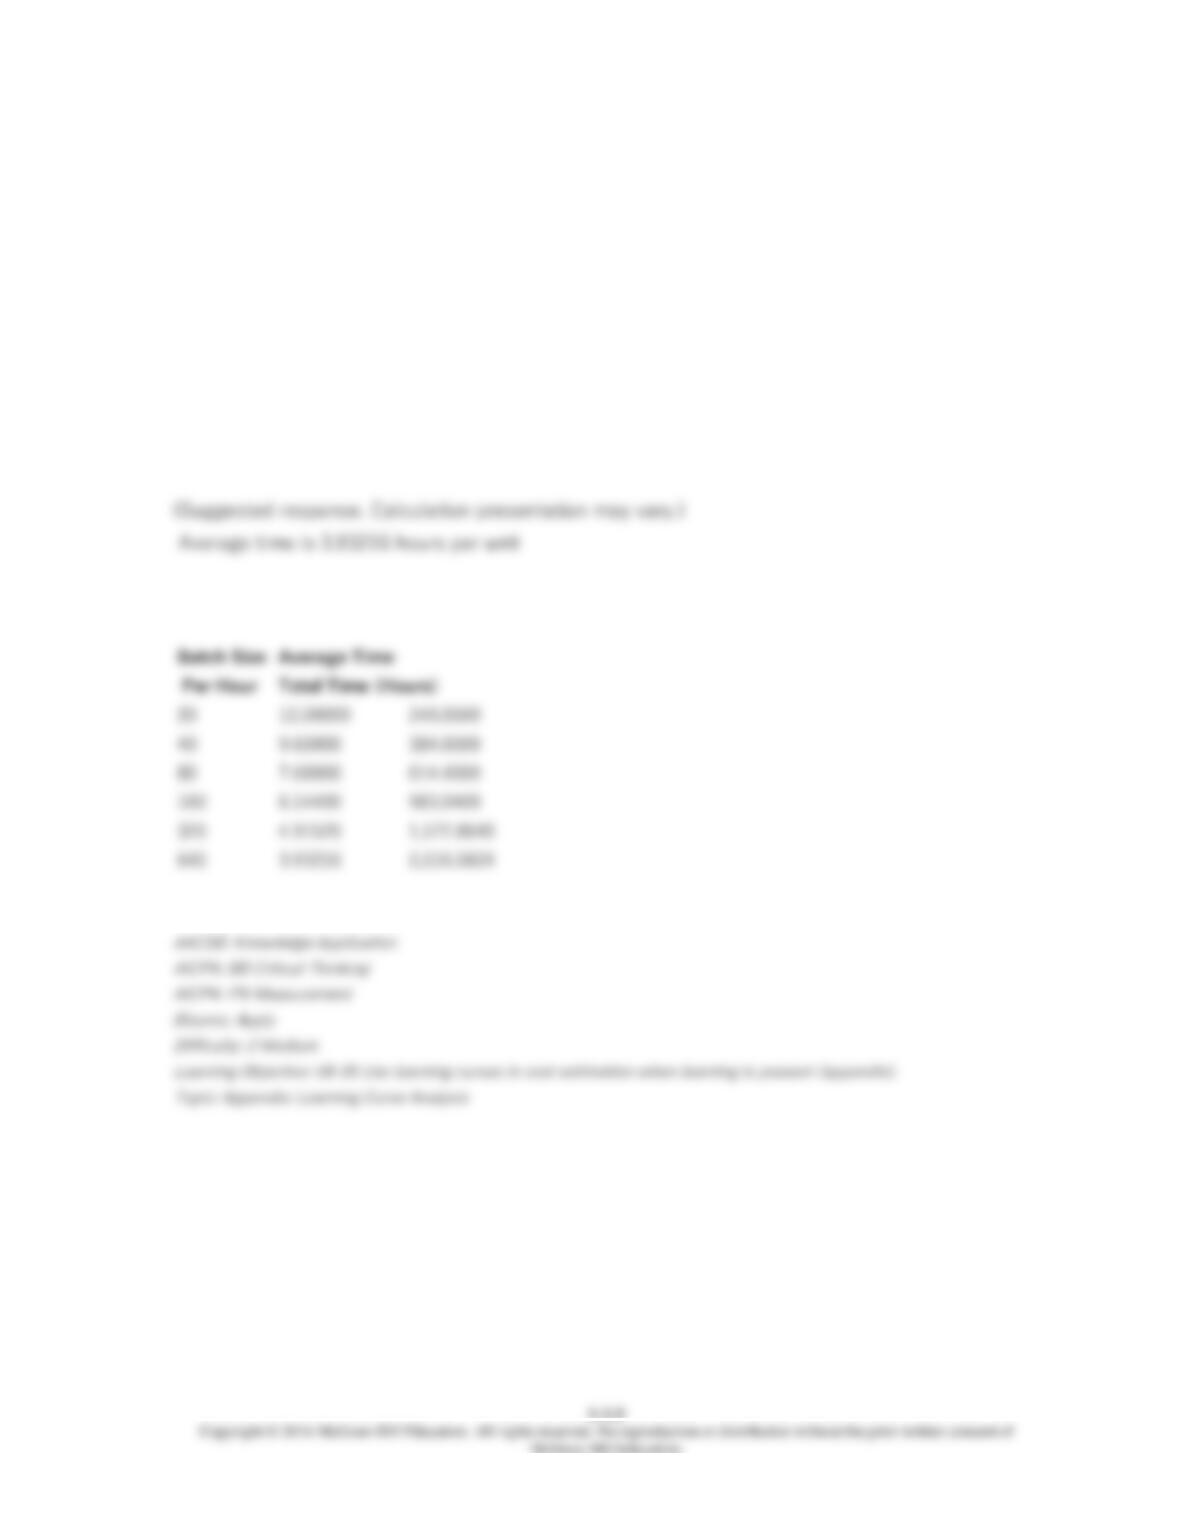
115. Patterson Equipment Inc. produced a pilot run of 20 units of a recently developed motor
used in the finished products. The pilot run required an average of 12 direct labor hours per
motor. Patterson has an eighty percent learning curve on the direct labor hours needed to
produce new motors.
Required:
Calculate the average direct labor hours per unit for the first 640 motors (including the pilot run)
produced.

116. Whittenberg Distributors, a major retailing and mail-order operation, has been in
business for the past 10 years. During that time, its mail-order operations have grown from a
sideline to represent more than 80 percent of the company’s annual sales. Of course, the
company has suffered growing pains. At times, overloaded or faulty computer programs resulted
in lost sales. And scheduling temporary workers to augment the permanent staff during peak
periods has always been a problem.
Peter Bloom, manager of mail-order operations, has developed procedures for handling most
problems. However, he is still trying to improve the scheduling of temporary workers to take
customer telephone orders. Under the current system, Peter keeps a permanent staff of 60
employees who handle the base telephone workload and supplements this staff with temporary
workers as needed. The temporary workers are hired on a daily basis; he determines the number
needed for the next day the afternoon before based on his estimate of the upcoming telephone
volume.
Peter has decided to try regression analysis to improve the hiring of temporary workers. By
summarizing the daily labor-hours into weekly totals for the past year, he determined the number
of workers used each week. In addition, he listed the number of orders processed each week.
After entering the data into a spreadsheet, Peter ran two regressions. Regression 1 related the
total number of workers (permanent staff plus temporary workers) to the number of orders
received. Regression 2 related only temporary workers to the number of orders received. The
output of these analyses follows:
Regression model: W =
a
+
b
×
T
where:
W
= workers;
T
= telephone orders
Regression 1 Regression 2
a
21.938 -46.569
b
.0043 .0051
Standard error of the estimate 3.721 1.495
t
-value 1.95 2.04
Coefficient of determination .624 .755
Durbin Watson statistic 1.33 1.67
Required:
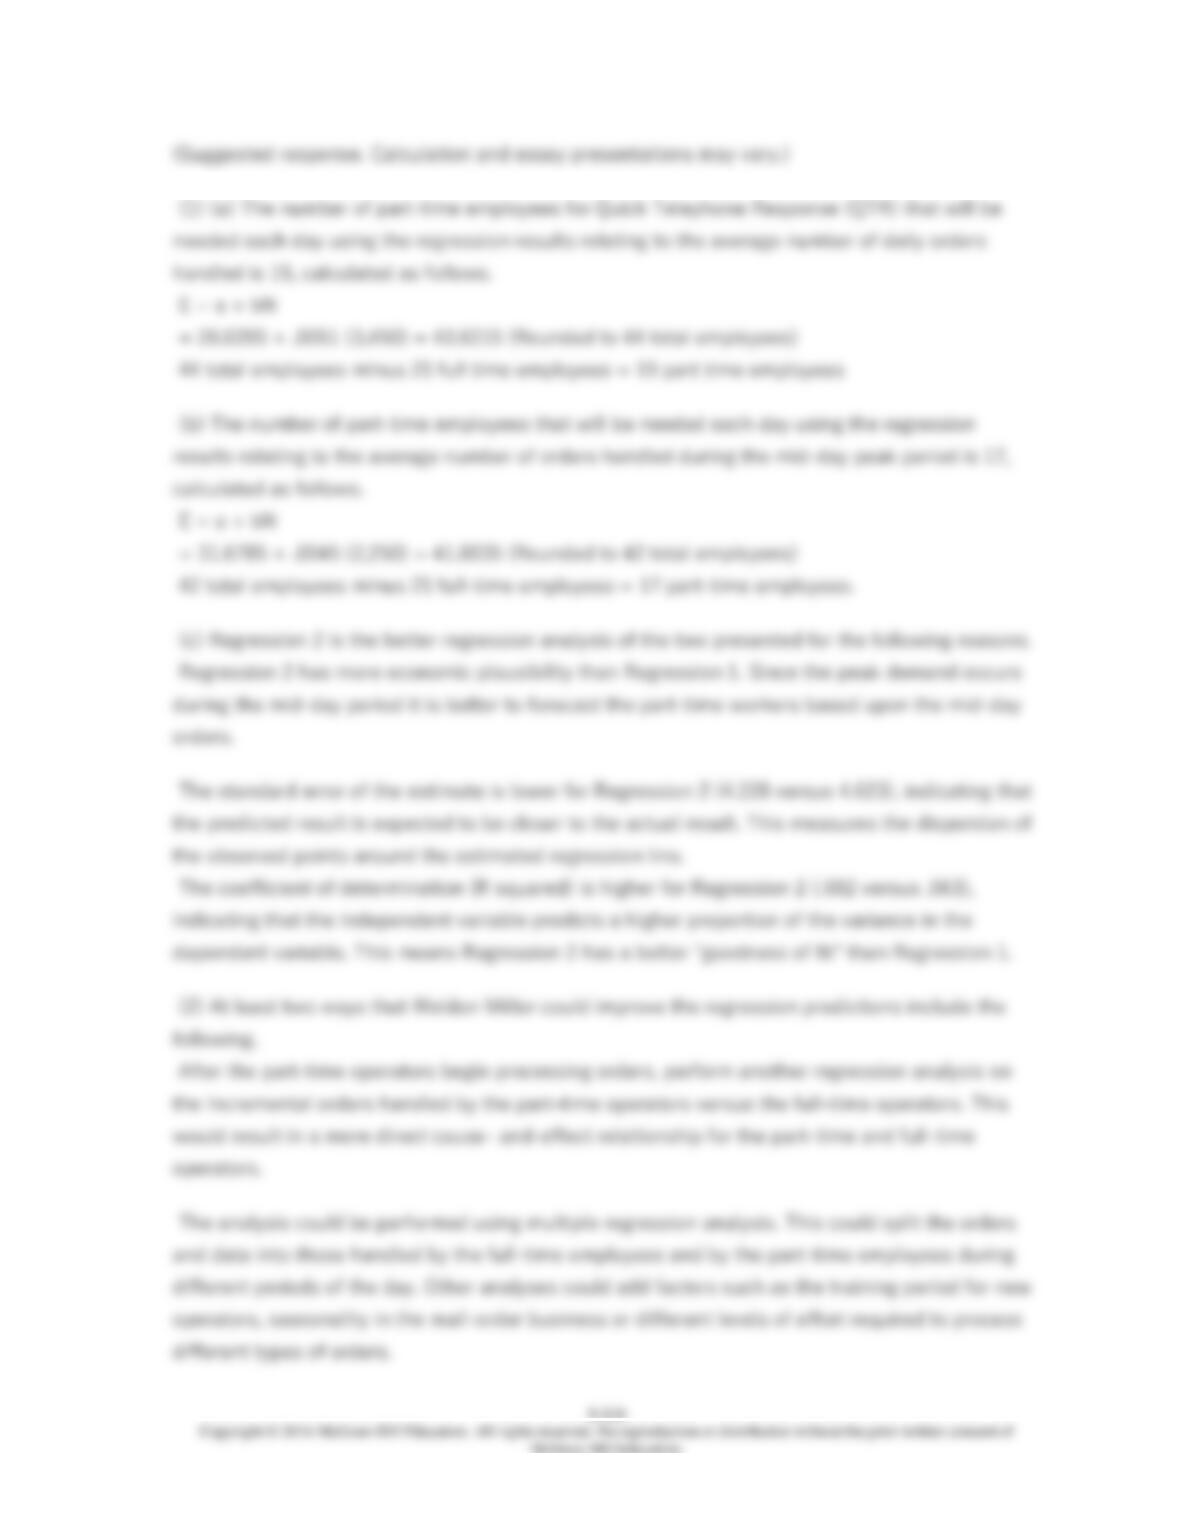
1. Peter Bloom estimates that Whittenberg Distributors will receive 12,740 orders during the
second week of December.
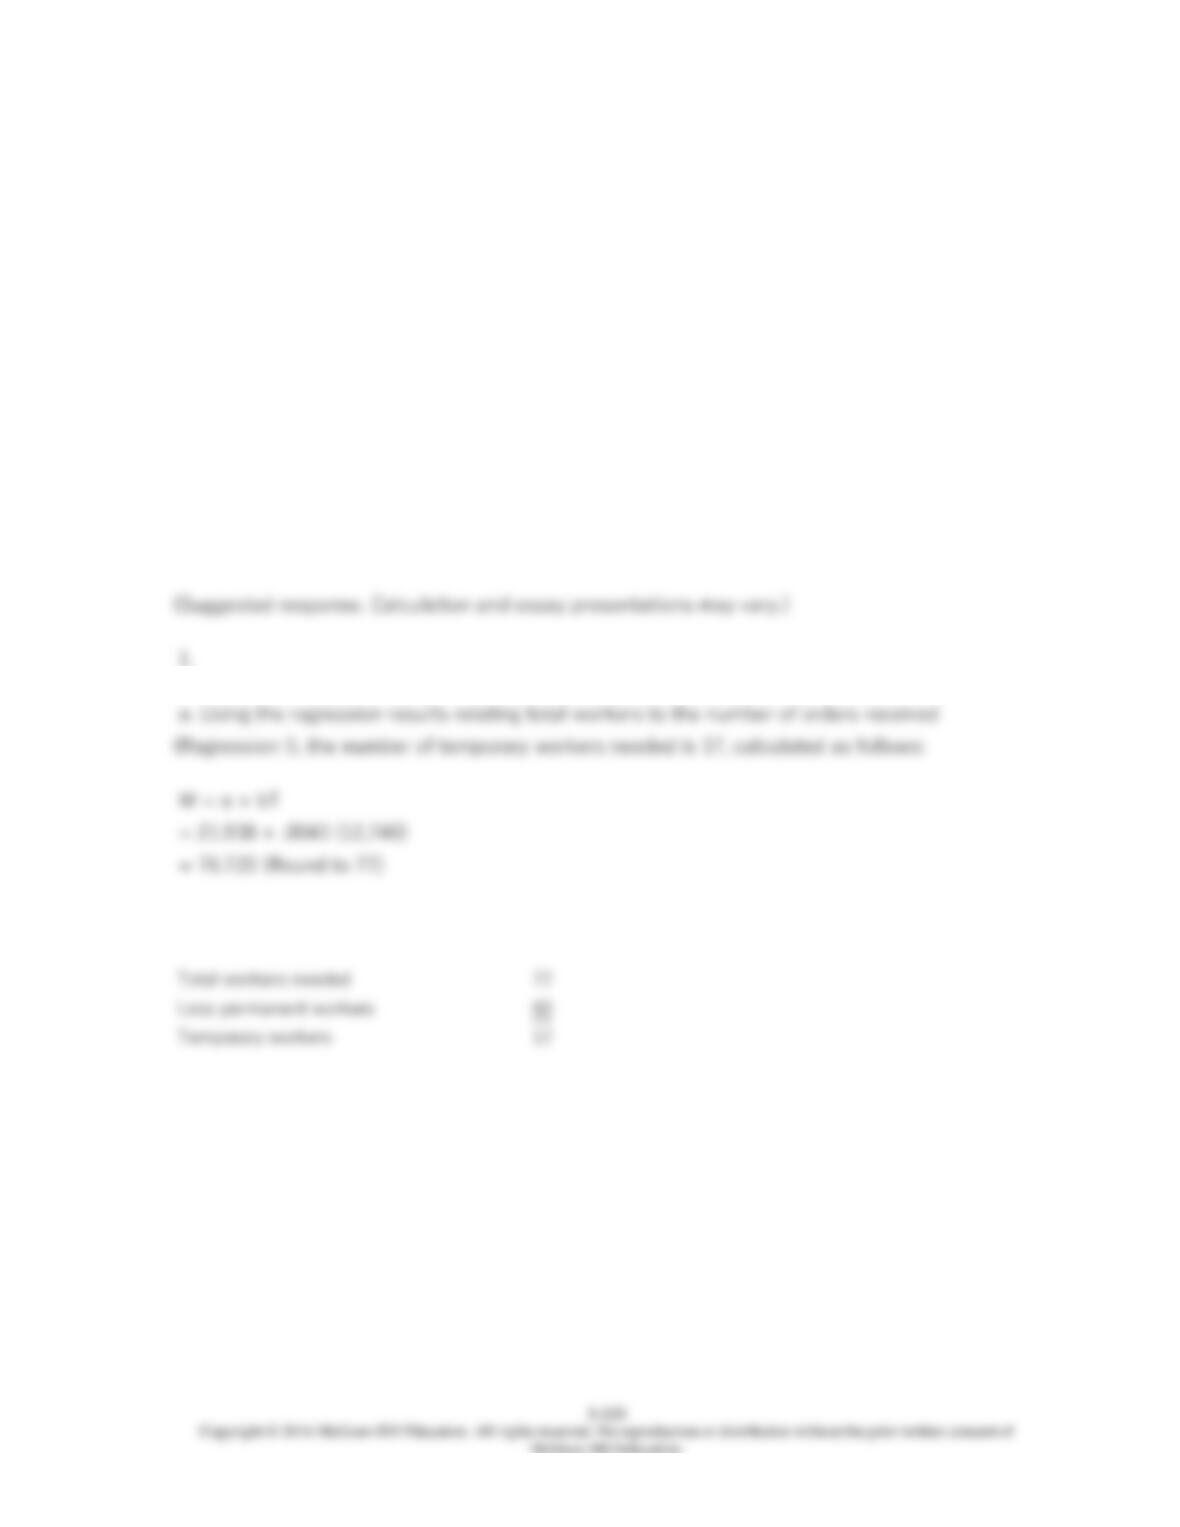
a. Predict the number of temporary workers needed for this week using regression 1. Round your
answer to the nearest whole number.
b. Using regression 2, predict the number of temporary workers needed during this week. Round
your answer to the nearest whole number.
2. Which of the two regression analyses appears to be better? Explain your answer.
3. Describe at least three ways that Peter Bloom could improve his analysis to make better
predictions than either of these regression results provides. (CMA Adapted)
117. Regression analysis is increasingly being used in business applications, often called
“business analytics” (or “predictive analytics”), in which a company studies its customers to
gather information that can be used to make each customer more profitable. Companies that do
this include Harrah’s and eHarmony, among many others.
Required:
(1) Briefly explain how a company could use regression to improve customer profitability.
(2) Do you see any ethical issues involved in the use of business analytics? Explain.
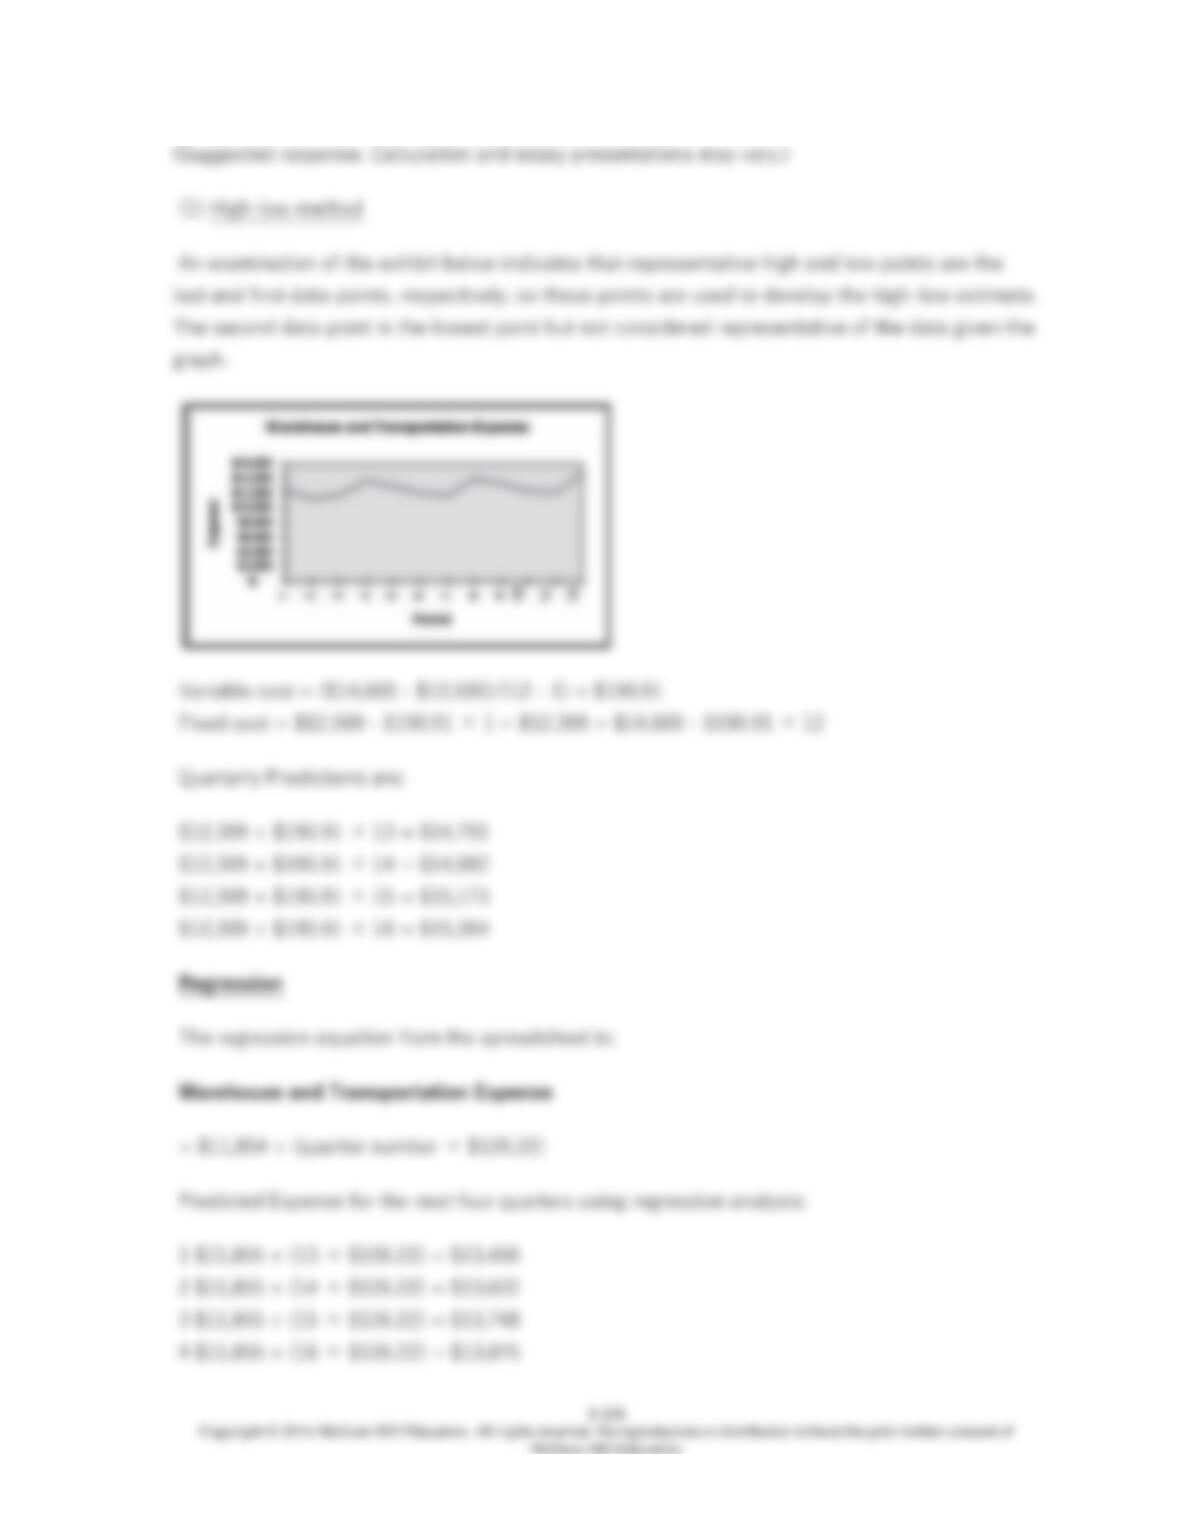
118. Clothes for U is a large merchandiser of apparel for budget-minded families.
Management recently became concerned about the amount of inventory carrying costs and
transportation costs between warehouses and retail outlets. As a starting point in further
analyses, Gregory Gonzales, the controller, wants to test different forecasting methods and then
use the best one to forecast quarterly expenses for 2016. The relevant data for the previous three
years follows:
Quarter Expense
1/2013 $12,500
2/2013 11,300
3/2013 11,600
4/2014 13,700
1/2014 12,900
2/2014 12,100
3/2014 11,700
4/2014 14,000
1/2015 13,300
2/2015 12,300
3/2015 12,100
4/2015 14,600
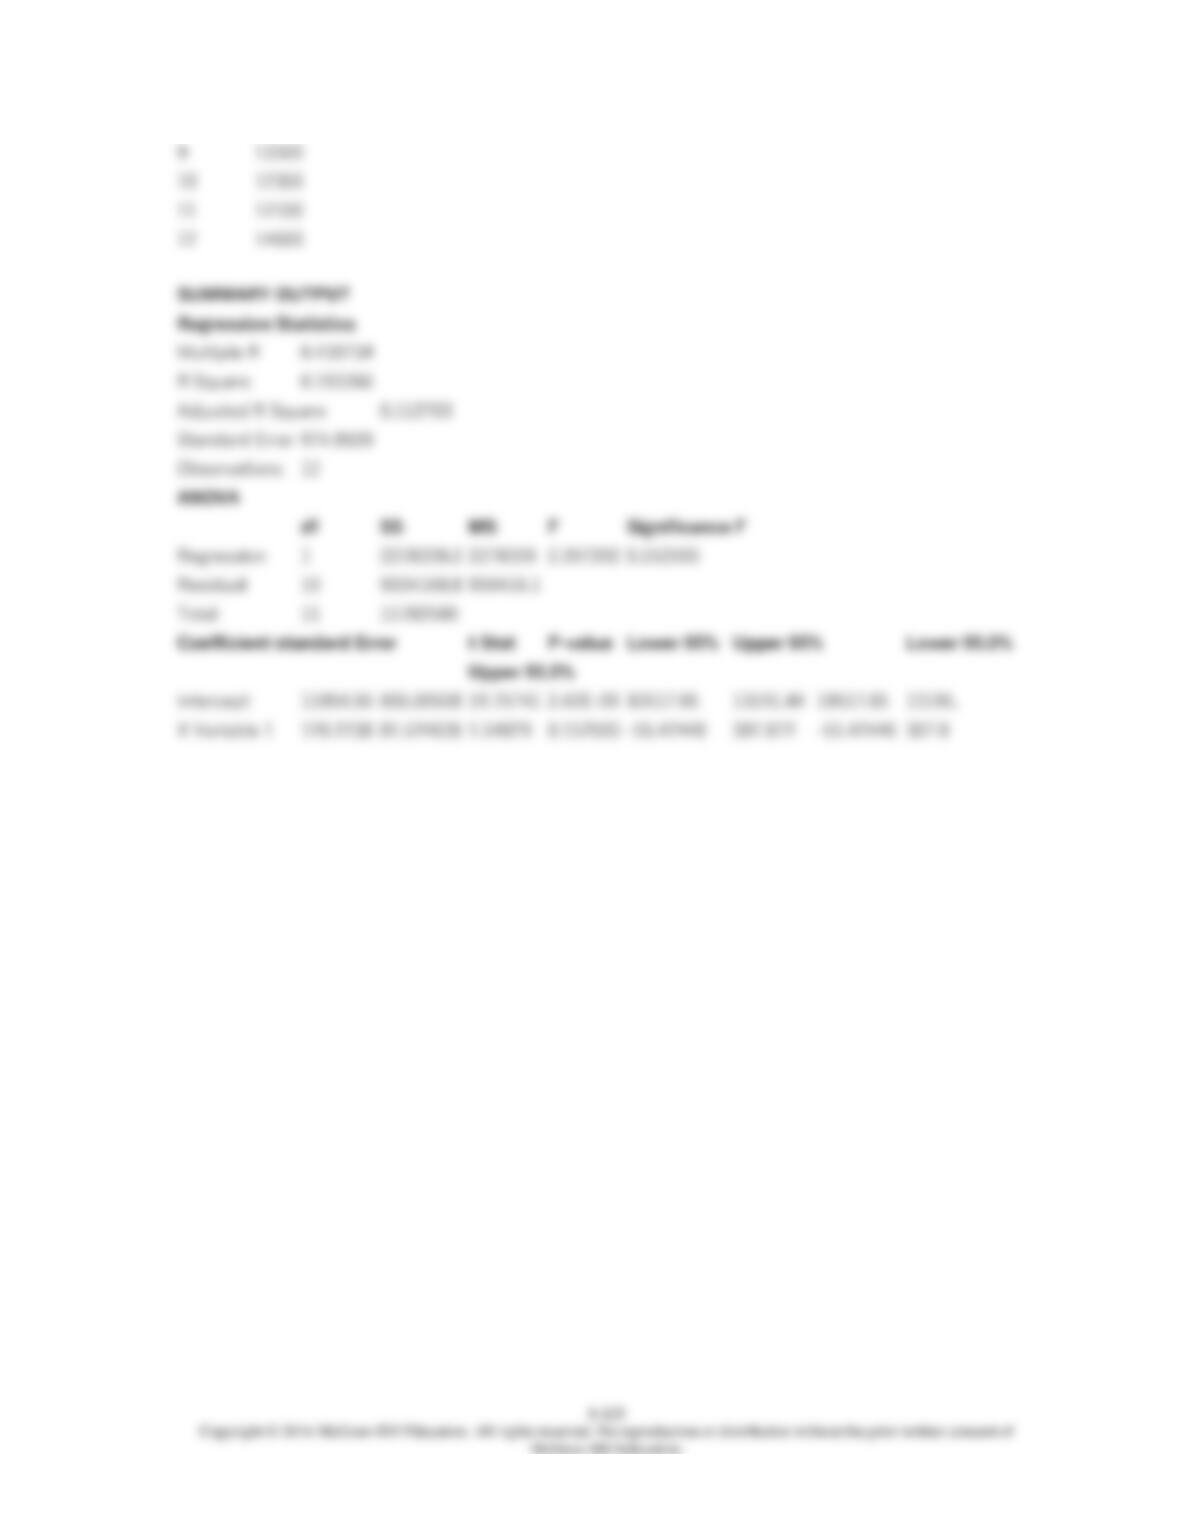
The results of a simple regression analysis using all 12 data points yielded an intercept of
$11,854.55 and a coefficient for the independent variable of $126.22 (
R
-squared = .19,
t
= 1.5,
SE
= 974).
Required:
(1) Calculate the quarterly forecasts for 2016 using the high-low method and also regression
analysis. Recommend which method Gregory should use and explain why.
(2) How does your analysis in requirement 1 change if Clothes for U is involved in global
sourcing of products for its stores?
119. Data mining and analytical software are increasingly used by large retailers and hotel
chains, restaurants, and other businesses. In recent years, the trend is for smaller companies and
manufacturers to begin to see the value of data mining, analyzing the data the company has
about its customers and competitive environment to help the company make improved decisions
about pricing, customer service strategies, new product development, and other competitive
issues.
Required:
Explain how a growing, medium-sized manufacturer of furniture for hotels, businesses, and other
commercial enterprises could use analytics to help it reach out to new customers.
120. Companies such as Walmart and UPS are committed to reducing cost and improving their
competitive position through sustainability efforts. Walmart and UPS have both reduced
significantly the amount of fuel used in their truck fleets.
Required:
Suggest how regression and correlation analysis might be used to supplement the efforts of
companies like Walmart and UPS to improve the fuel efficiency of their trucks.