
107. Kumar Co. is attempting to predict its maintenance costs more accurately. Maintenance
costs are a mixed cost. Maintenance costs and machine hours for the first four months of the
year are as follows:
Month Maintenance Costs Machine Hours
Jan. $8,430 1,320
Feb. 7,620 1,190
Mar. 8,810 1,430
Apr. 7,580 1,130
Required:
Using the high-low method, calculate unit variable cost and monthly fixed costs.
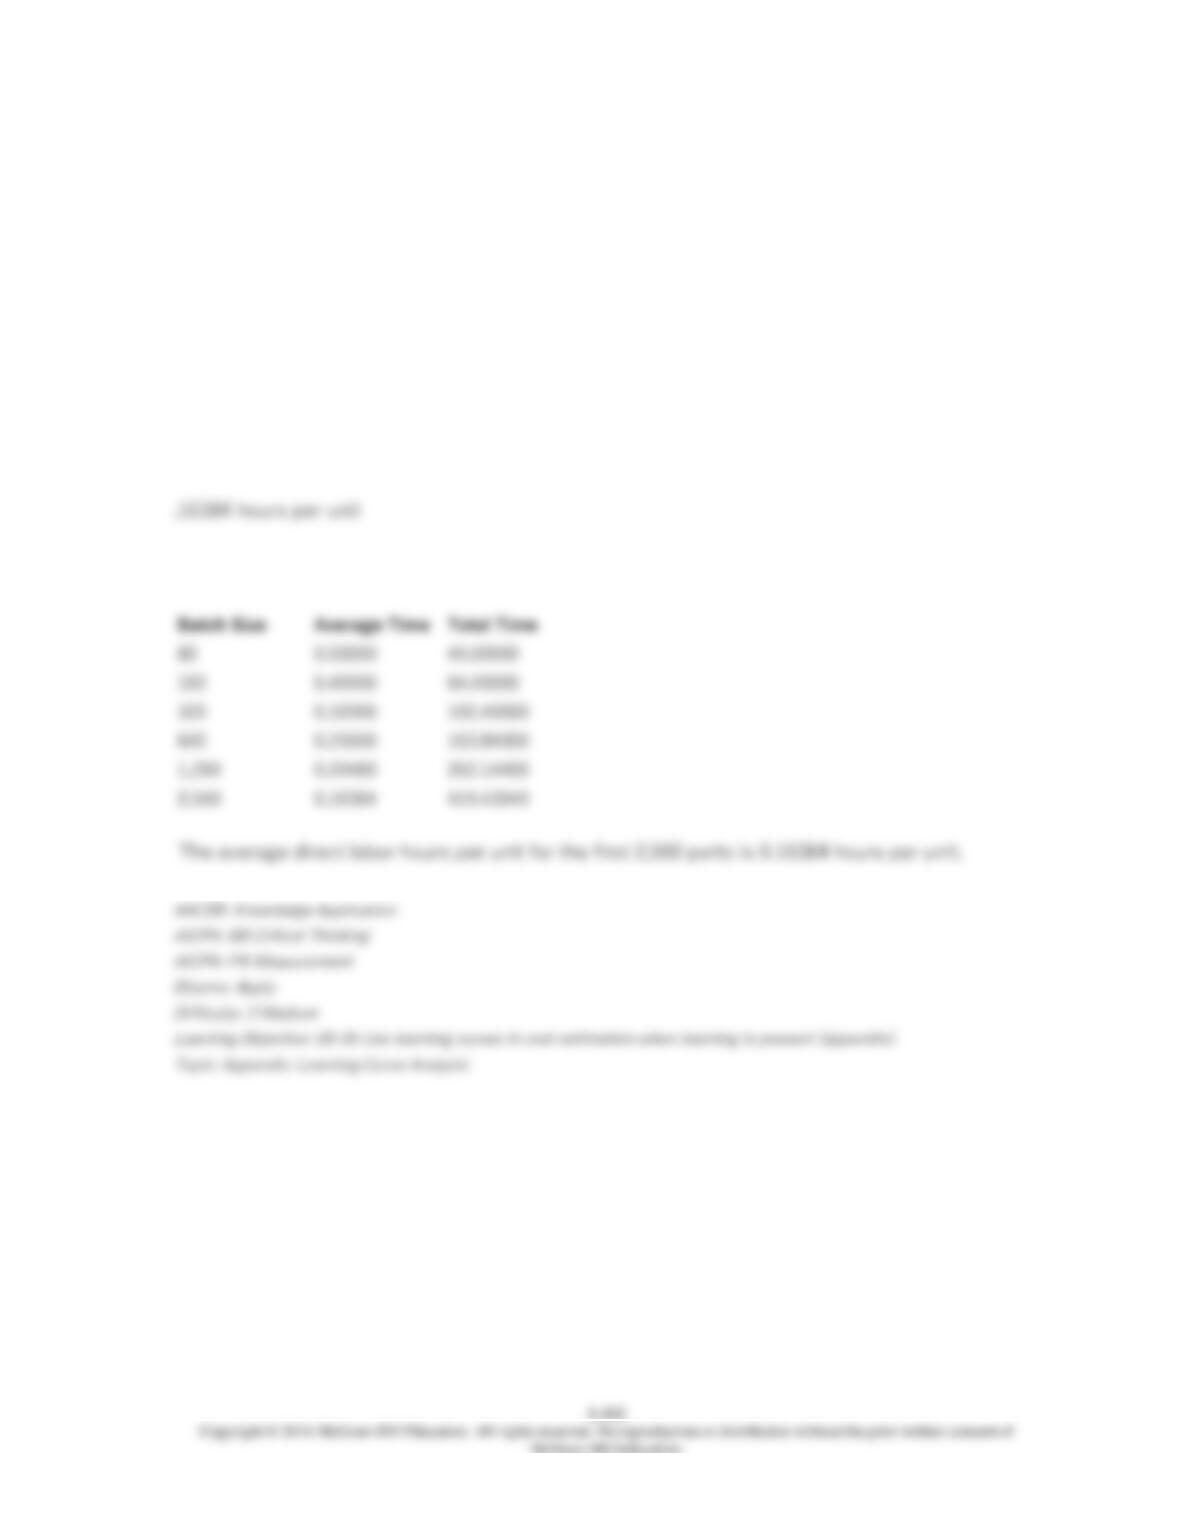
108. Austen Co. produced a pilot run of eighty units of a recently developed part used in the
finished products. Austen Co. expects to produce and sell 2,560 units annually. The pilot run
required 40 direct labor hours for the eighty units, averaging 0.5 direct labor hours per unit.
Austen experiences an eighty percent learning curve.
Required:
Calculate the average direct labor hours per unit for the first 2,560 units (including the pilot run)
produced.

109. School Kids’ Compact Disc Store expanded the size of its store in Westfield, NJ two
months ago. The owner, Montgomery Brown, has asked you to develop an analysis of the cost
structure in his store, as a basis for assessing the profitability of his business. He provides you
with account data for the most recent month, which he explains is representative of what these
costs are in most months of the year; there is not much seasonality in his business. Last month,
May, 890 compact discs were sold. This month Montgomery expects to sell 1,100 CDs.
Account June May
Salesperson’s Wages $2,200 $1,780
Compact Disc Purchases 8,250 6,675
Rent 2,025 2,025
Depreciation 40 40
Shopping Bags 22 18
Insurance 75 75
Advertising 65 65
Utilities 125 125
Mr. Brown’s Salary 2,850 2,850
$15,652 $13,653
NOTE: Assume that Mr. Brown purchases promptly on a day–to-day basis to replace inventory,
so that the level of inventory remains constant.
Required:
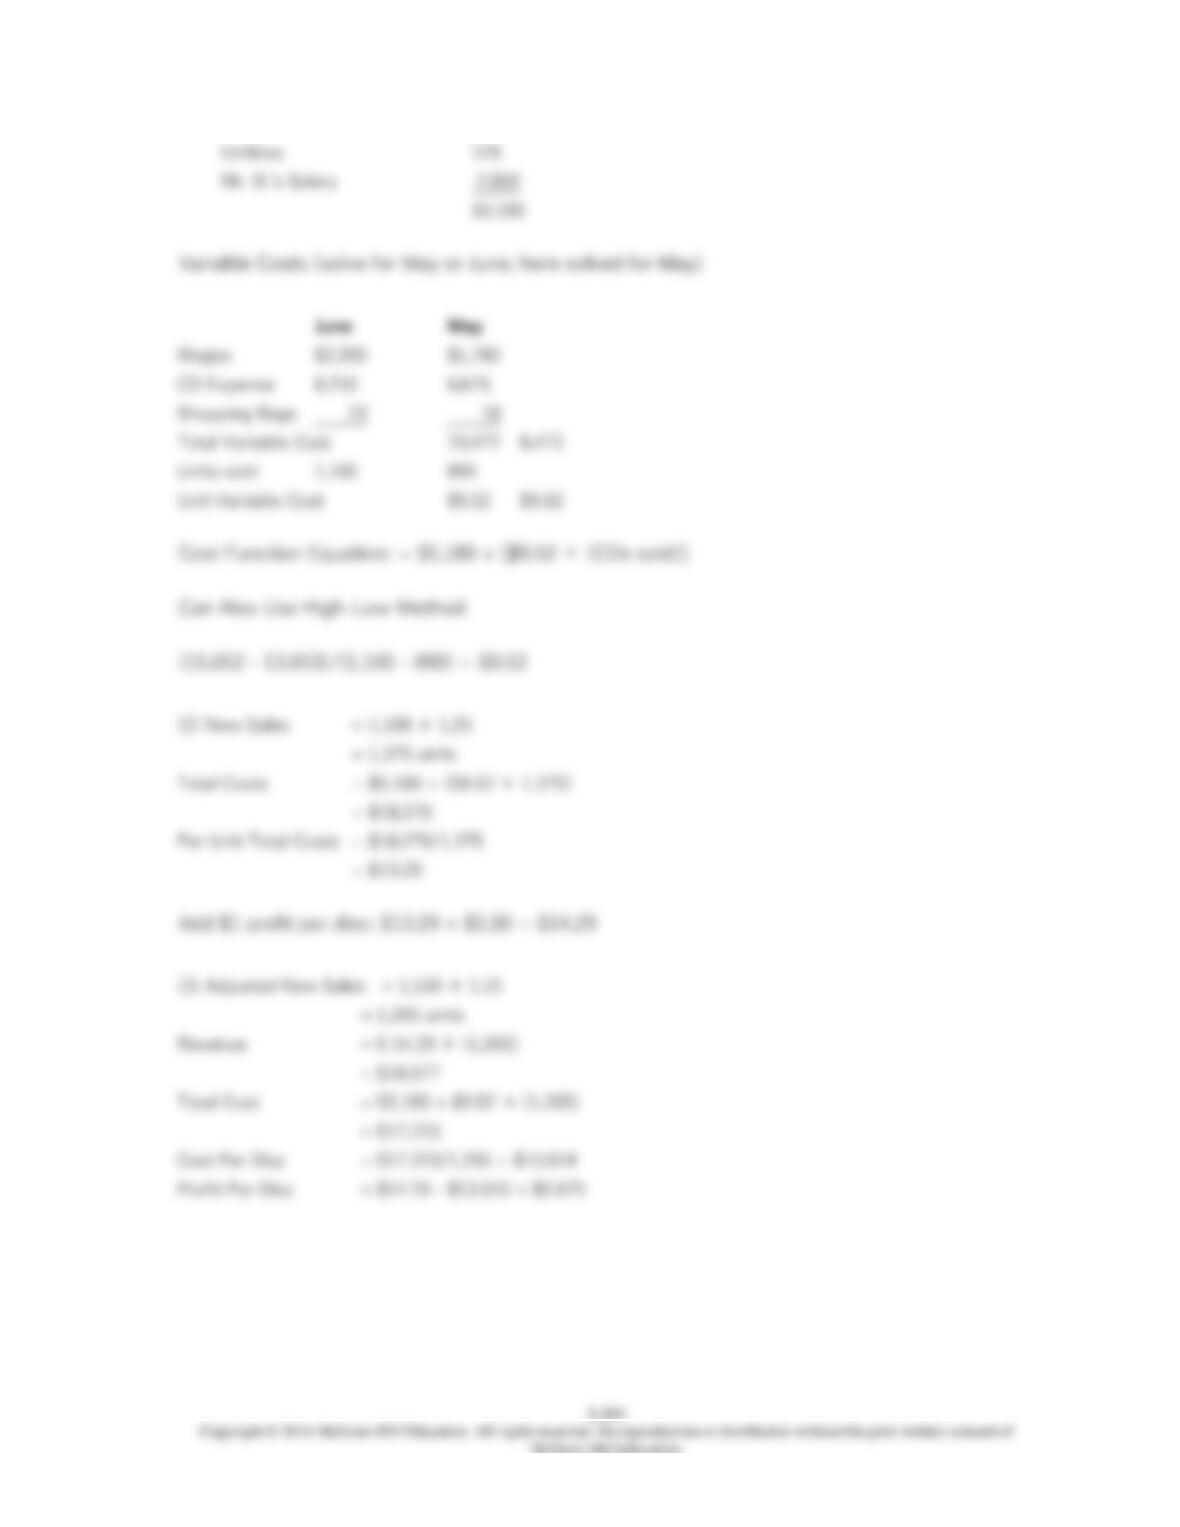
(1) Develop the cost equation for Mr. Brown’s store, using the account classification method,
assuming that the cost object is the individual compact disc.
(2) Mr. Brown plans to increase sales by 25% next month, July, by reducing the price of his
compact discs. Assuming a 25% increase in sales, what is the lowest price Mr. Brown can sell his
discs for if he wants to meet all costs plus make $1 profit per disc?
(3) What would the profit per disc be if sales actually increased by only 15% and the discs were
sold at the price calculated in (2)?
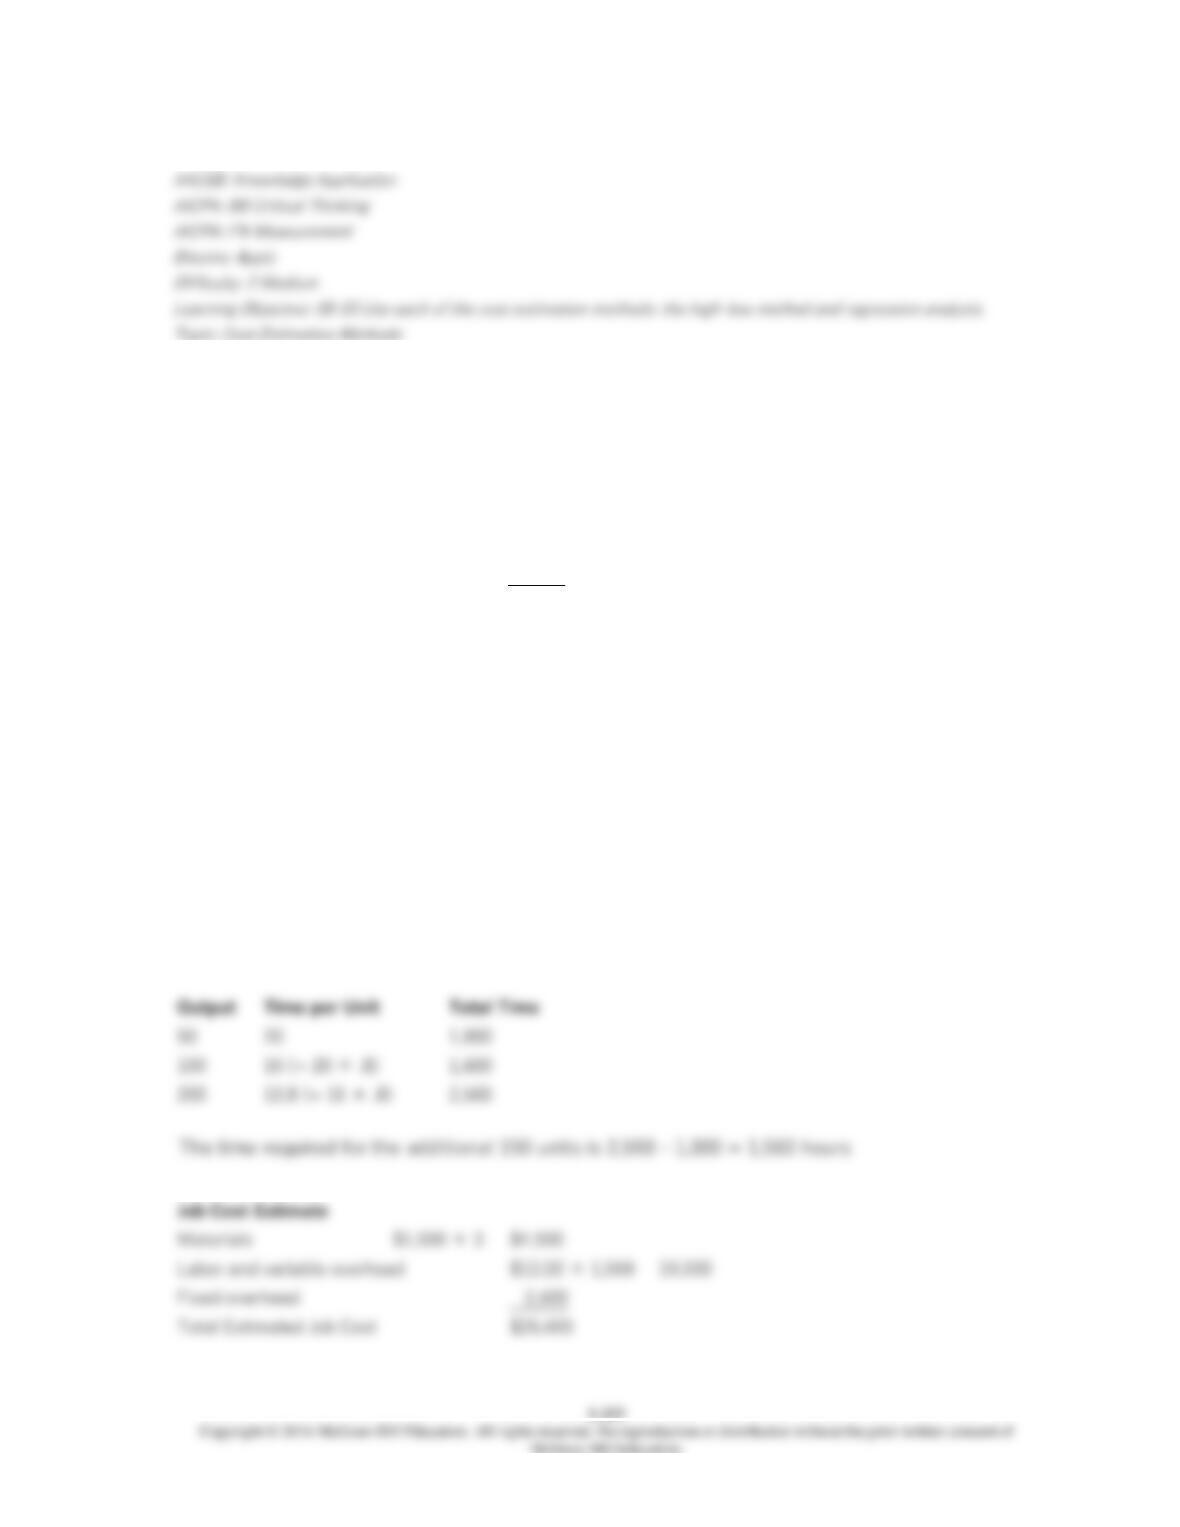
110. Moss Point Manufacturing recently completed and sold an order of 50 units that had the
following costs:
Direct materials 1,500
Direct labor (1,000 hours @ $8.50) 8,500
Variable overhead (1,000 hrs. @ $4.00)* 4,000
Fixed overhead* 2,400
$16,400
* Applied on the basis of direct labor hours
The company has now been requested to prepare a bid for 150 units of the same product.
Required:
If an 80 percent learning curve is applicable, estimate Moss Point’s total cost on this order.

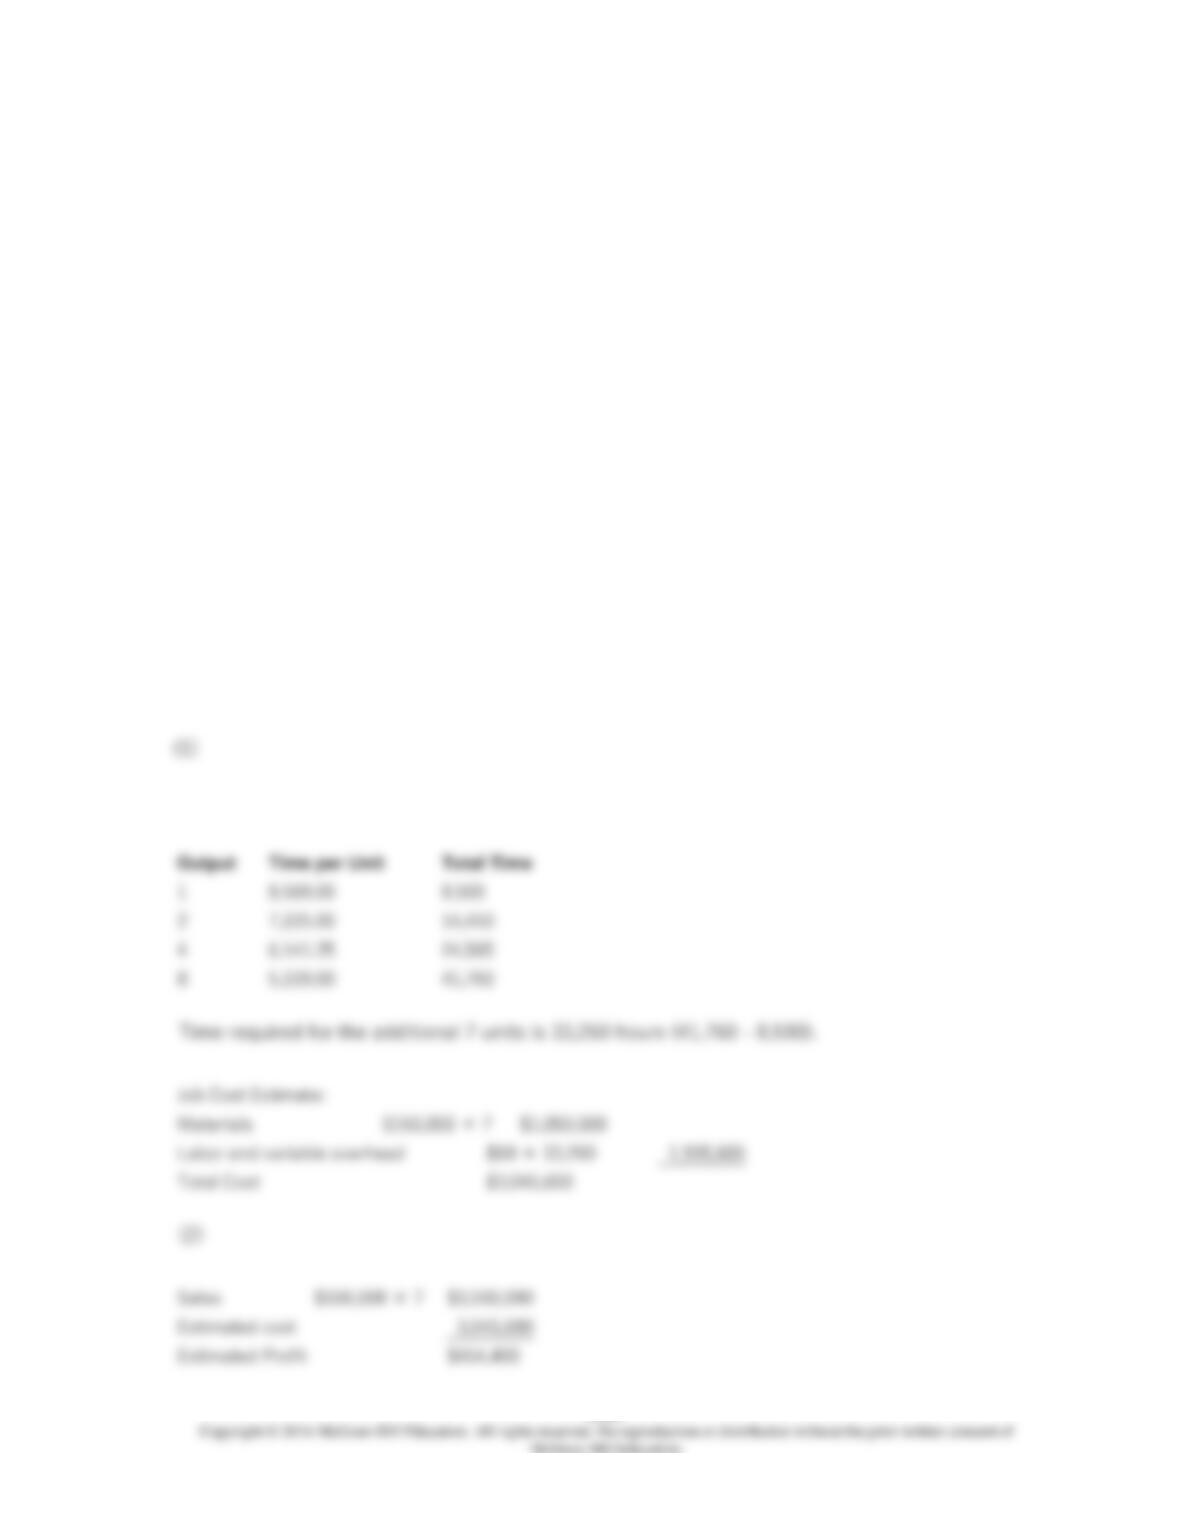
111. Andrews & Henderson Inc. is a manufacturer of mining equipment in Colorado. Eric
Andrews, the founder of the corporation, has just won a new contract from Shakley Inc. to build
seven new tunneling machines for a price of $500,000 each. The machines are to be delivered in
the next seven months. The costs associated with the production of the first machine are listed
below. Eric estimates that an 85% cumulative average learning rate exists for these types of
projects.
Following is the cost information for the first tunneling machine:
Direct Materials: $150,000
Direct Labor (8,500 hours @ $50) $425,000
Variable Overhead (8,500 @ $10) $85,000
Required:
(1) Prepare an estimate of the total hours for producing the second through eighth machines.
(2) Determine the expected profit from this project.


112. Elisko Inc. is a major book distributor. Elisko’s Shipping Department consists of a
manager plus ten other permanent positions- four supervisors and six loaders. The four
supervisors and six loaders provide the minimum staff and frequently must be supplemented by
additional workers, especially during the weeks when the volume of shipments is heavy. Thus,
the number of people shipping the orders frequently averages over 30 per week, i.e., ten
permanent persons plus 20 temporary workers. The temporary workers are hired through a local
agency. Elisko must use temporary workers to maintain a minimum daily shipment rate of 95
percent of orders presented for shipping. The loss of efficiency from using temporary workers is
minimal, and the $10.00 per hour cost of temporary workers is less than the $15.00 per hour for
the loaders and $22.50 per hour for the supervisors on Elisko’s permanent staff. The agency
requires Elisko to utilize each temporary worker for at least four hours each day.
Jim Locter, Shipping Manager, schedules temporary help based on forecasted orders for the
coming week. Supervisors serve as loaders until temporary help is needed. A supervisor stops
loading when the ratio of loaders to supervisors reaches 7:1. Locter knows that he will need
temporary help when the forecasted average daily orders exceed 300. Locter has frequently
requested from two to four extra temporary workers per day to guard against unexpected rush
orders. If there was not enough work, he would dismiss the extra people at noon after four hours
of work.
The agency has not been pleased with Locter’s practice of overhiring and has notified Elisko that
it is changing its policy. From now on, if a person is dismissed before an eight-hour assignment is
completed, Elisko will still be charged for an eight-hour day plus mileage back to the agency for
reassignment. This policy would go into effect the following week.
Paula Brand, General Manager, called Jim Locter to her office when she received the notice from
the agency. She told Locter, “Your staffing has to be better. This penalty could cost us up to $300
– $500 per week in labor cost for which we receive no benefit. Why can’t you schedule better?”
Locter replied, “I agree that the staffing should be better, but I can’t do it accurately when there
are rush orders. By being able to layoff people at noon, I have been able to adjust for the
uncertain order schedule without cost to the company. Of course the agency’s new policy
changes this.”
Locter and Brand contacted Elisko’s Controller, Mitch Berg regarding Locter’s problem on how to
estimate the number of people needed each week. Berg reasoned that Locter needed a quick
solution until he could study the work flow. Berg suggested a regression analysis using the
number of orders shipped as the independent variable and the number of workers (permanent
plus temporary) as the dependent variable. Berg indicated that data for the past year was
available and that the analysis could be done quickly using the accounting department’s

computer system.
Berg completed the two regression analyses that are presented below. The first regression was
based on the data for the entire year. The second regression excluded the weeks when only the
10 permanent staff persons were used; these weeks were unusual and appeared to be out of the
relevant range.
Locter was not familiar with regression analysis and, therefore, was unsure how to implement
this technique. He wondered which regression data he should employ, i.e., which one was better.
When he recognized that the regression was based on actual orders shipped by week, Berg told
him he could use the forecasted shipments for the week to determine the number of workers
needed.
Regression Equation:
W = a + bS
S = orders shipped
Regression 1 Regression 2
(Daily data for 52 weeks) (Daily data for 38 weeks)
a 5.062 .489
b .023 .028
Standard error of the estimate (SE) 2.012 .432
95% confidence for W 3.943 .848
R-Squared .962 .998
t-value of coefficient 32.85 140
Required:
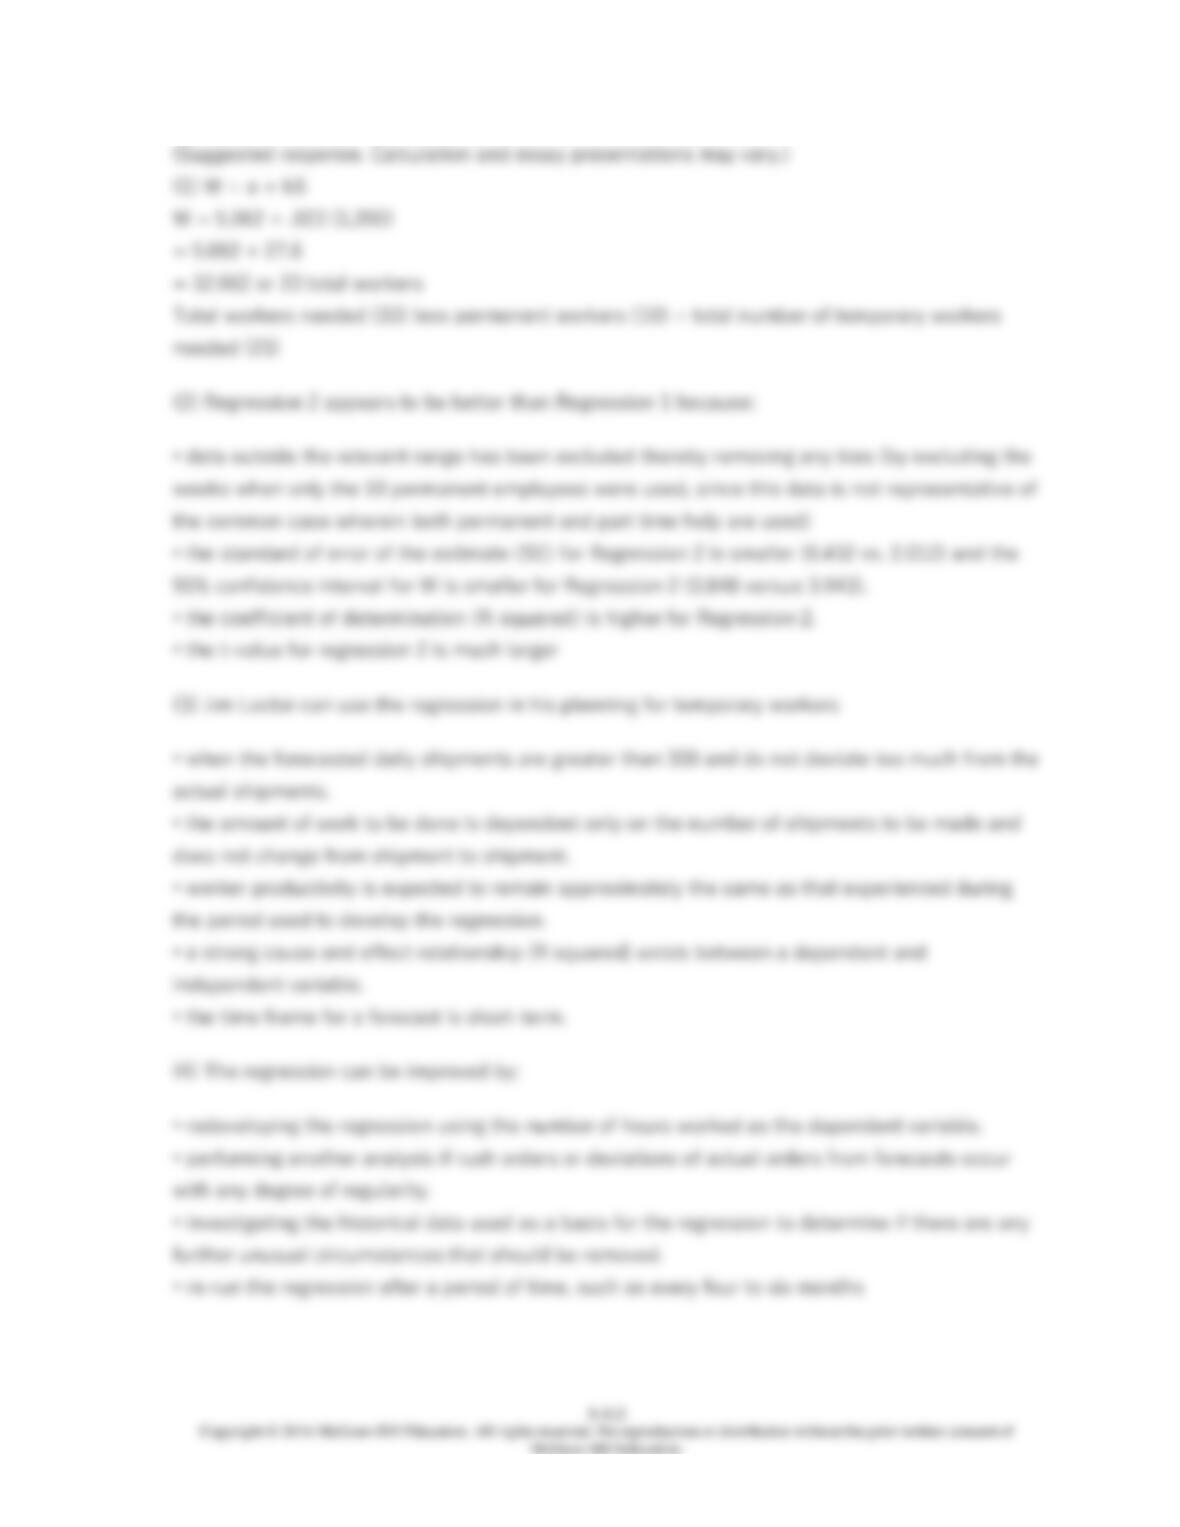
(1) Using Regression 1 based on data from a full year, calculate the number of temporary
workers Jim Locter would plan to hire for a forecast indicating 1,200 shipments per day.
(2) Which one of the two regressions appears to be better? Explain your answer.
(3) Explain the circumstances under which Jim Locter can use the regression in his planning for
temporary workers.
(4) Explain whether the regression analysis that Elisko Inc. employed in this situation could be
improved. If it cannot be improved, explain why.
(5) How can the regression analysis help Elisko be more competitive?


113. Quick Telephone Response (QTR) was started several years ago to provide an outsource
telephone service for the growing number of small, specialty catalog mail-order companies that
commenced operations in recent years. Since most of the calls are received between 10 a.m. and
2 p.m., QTR began offering a telephone answering service to attempt to fill the remainder of the
day for its operators. However, as outsource competition has recently increased, QTR analyzed
its operations and concluded that it should focus on its core business of providing service to its
mail-order clients only. To bring operating costs into line, QTR concluded that it should shed
some of its full-time operators and replace them with part-time operators in order to cover the
peak mid-day calling period.
Weldon Miller, director of the Telephone Response Operations Department, engaged a
consultant to assist in analyzing the situation and determining the number of full-time and part-
time employees that will be required to meet QTR’s variable operating schedule. Based on a
study of one month’s activity they concluded that the number of daily orders received for their
specialty clients averaged 3,450 with the mid-day period averaging 2,250 orders. They calculated
that there would be a need to retain twenty five (25) full-time employees. They further developed
two regression analyses. Regression 1 relates to the average of 3,450 orders per day and
Regression 2 relates to the average of 2,250 peak mid-day orders. The data resulting from these
analyses are presented below.
Regression Equation: where:
E = a + bN
E = Employees
N = Number of orders
Regression 1 Regression 2
a 26.0265 31.6785
b .0051 .0045
Standard error of the coefficient .0005 .0009
Standard error of the estimate 4.623 4.228
R squared .563 .682
95% confidence interval for the estimate of E 8.697 7.552

Required:
(1) Refer to the regression data in the previous column for Quick Telephone Response (QTR).
(a) Calculate the number of part-time employees that will be needed each day using the
regression results relating to the average number of daily orders handled. Round your response
to the nearest whole number.
(b) Apply the regression results that relate to the average number of orders handled during the
mid- day peak period. Calculate the number of part-time employees that will be needed daily.
Round your response to the nearest whole number.
(c) Of the two regression analyses used select the regression analysis which appears to be the
better one and explain the reason for your conclusion.
(2) Describe at least two ways that Weldon Miller could improve the regression predictions.
(CMA adapted)