89. Which of the following means that two or more independent variables are highly
correlated with each other?
90. Which of the following is not used for evaluating a regression analysis?
91. Two aspects to consider when selecting the time period for cost estimation are:
92. Which of the following is the percentage by which average time (or total time) falls from
previous levels as output doubles?
93. Accurate cost estimates are required by strategic management for all except:
94. The following costs were for Bikeway Inc., a bicycle manufacturer that uses the high-low
method:
Output Fixed Costs Variable Costs Total Costs
800 $25,000 $80,000 $105,000
850 $25,000 $85,000 $110,000
900 $25,000 $90,000 $115,000
950 $25,000 $95,000 $120,000
At an output level of 1,000 bicycles, per unit variable cost is calculated to be:
95. The following costs were for Bikeway Inc., a bicycle manufacturer that uses the high-low
method:
Output Fixed Costs Variable Costs Total Costs
800 $25,000 $80,000 $105,000
850 $25,000 $85,000 $110,000
900 $25,000 $90,000 $115,000
950 $25,000 $95,000 $120,000
At an output level of 1,000 bicycles, per unit total cost is calculated to be:
96. __________ is a statistical method for obtaining the unique cost-estimating equation that
best fits a set of data points.
97. The coefficient of determination is a number between:
98. A p-value of less than _______ is typically considered statistically significant.

99. Armer Company is accumulating data to use in preparing its annual profit plan for the
coming year. The cost behavior pattern of the maintenance costs must be determined. The
accounting staff has suggested the use of linear regression to derive an equation for
maintenance hours and costs. Data regarding the maintenance hours and costs for the last year
and the results of the regression analysis follow:
Month Maintenance Cost Machine Hours
Jan. $4,200 480
Feb. 3,000 320
Mar. 3,600 400
Apr. 2,820 300
May 4,350 500
June 2,960 310
July 3,030 320
Aug. 4,470 520
Sept. 4,260 490
Oct. 4,050 470
Nov. 3,300 350
Dec. 3,160 340
Sum $43,200 4,800
Average $3,600 $400
Average cost per hour $9.00
a (intercept) $684.65
b (coefficient) 7.2884
Standard error of the estimate 34.469
R-squared 0.99724
t-value for b 60.105
If Armer Company uses the high-low method of analysis, the equation for the relationship
between hours of activity and maintenance cost follows:

100. Armer Company is accumulating data to use in preparing its annual profit plan for the
coming year. The cost behavior pattern of the maintenance costs must be determined. The
accounting staff has suggested the use of linear regression to derive an equation for
maintenance hours and costs. Data regarding the maintenance hours and costs for the last year
and the results of the regression analysis follow:
Month Maintenance Cost Machine Hours
Jan. $4,200 480
Feb. 3,000 320
Mar. 3,600 400
Apr. 2,820 300
May 4,350 500
June 2,960 310
July 3,030 320
Aug. 4,470 520
Sept. 4,260 490
Oct. 4,050 470
Nov. 3,300 350
Dec. 3,160 340
Sum $43,200 4,800
Average $3,600 $400
Average cost per hour $9.00
a (intercept) $684.65
b (coefficient) 7.2884
Standard error of the estimate 34.469
R-squared 0.99724
t-value for b 60.105
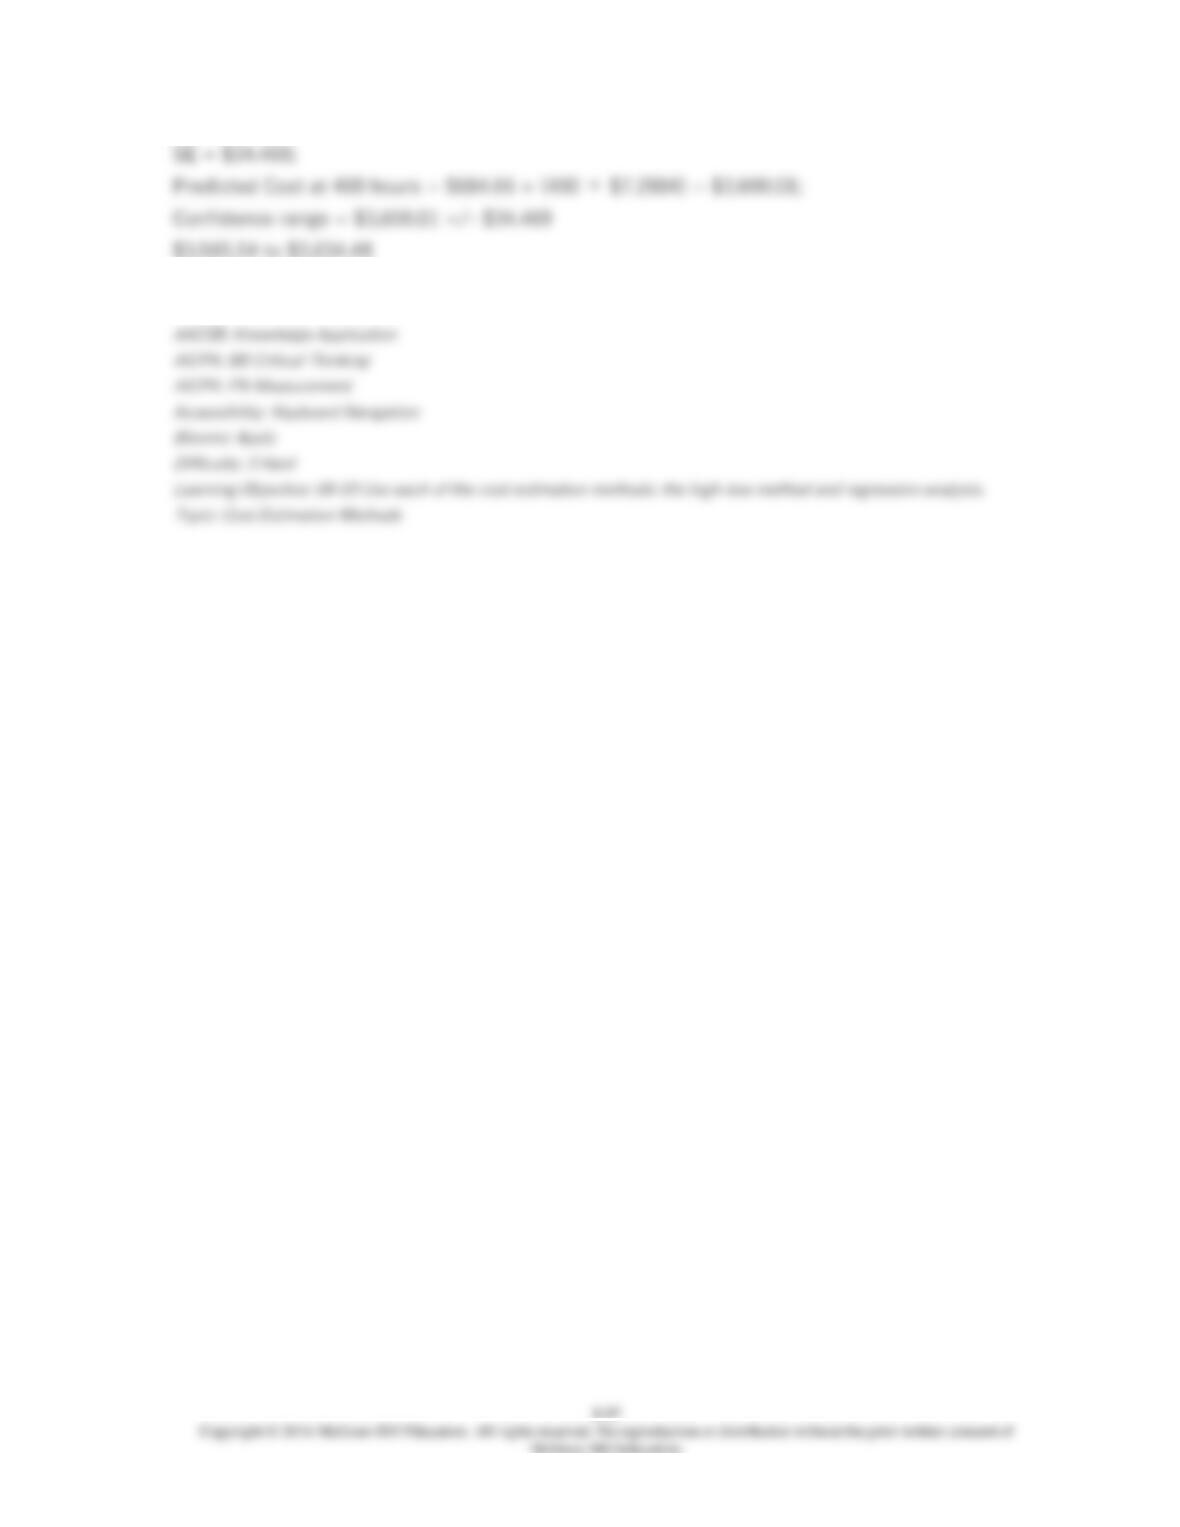
Based on the data derived from the regression analysis, 420 maintenance hours in a month
mean that maintenance costs should be budgeted to the nearest dollar at
101. Armer Company is accumulating data to use in preparing its annual profit plan for the
coming year. The cost behavior pattern of the maintenance costs must be determined. The
accounting staff has suggested the use of linear regression to derive an equation for
maintenance hours and costs. Data regarding the maintenance hours and costs for the last year
and the results of the regression analysis follow:
Month Maintenance Cost Machine Hours
Jan. $4,200 480
Feb. 3,000 320
Mar. 3,600 400
Apr. 2,820 300
May 4,350 500
June 2,960 310
July 3,030 320
Aug. 4,470 520
Sept. 4,260 490
Oct. 4,050 470
Nov. 3,300 350
Dec. 3,160 340
Sum $43,200 4,800
Average $3,600 $400
Average cost per hour $9.00
a (intercept) $684.65
b (coefficient) 7.2884
Standard error of the estimate 34.469
R-squared 0.99724
t-value for b 60.105
The coefficient of determination for Armer’s regression equation for the maintenance activities is
102. Armer Company is accumulating data to use in preparing its annual profit plan for the
coming year. The cost behavior pattern of the maintenance costs must be determined. The
accounting staff has suggested the use of linear regression to derive an equation for
maintenance hours and costs. Data regarding the maintenance hours and costs for the last year
and the results of the regression analysis follow:
Month Maintenance Cost Machine Hours
Jan. $4,200 480
Feb. 3,000 320
Mar. 3,600 400
Apr. 2,820 300
May 4,350 500
June 2,960 310
July 3,030 320
Aug. 4,470 520
Sept. 4,260 490
Oct. 4,050 470
Nov. 3,300 350
Dec. 3,160 340
Sum $43,200 4,800
Average $3,600 $400
Average cost per hour $9.00
a (intercept) $684.65
b (coefficient) 7.2884
Standard error of the estimate 34.469
R-squared 0.99724
t-value for b 60.105
The percent of the total variance that can be explained by the regression equation is

103. Armer Company is accumulating data to use in preparing its annual profit plan for the
coming year. The cost behavior pattern of the maintenance costs must be determined. The
accounting staff has suggested the use of linear regression to derive an equation for
maintenance hours and costs. Data regarding the maintenance hours and costs for the last year
and the results of the regression analysis follow:
Month Maintenance Cost Machine Hours
Jan. $4,200 480
Feb. 3,000 320
Mar. 3,600 400
Apr. 2,820 300
May 4,350 500
June 2,960 310
July 3,030 320
Aug. 4,470 520
Sept. 4,260 490
Oct. 4,050 470
Nov. 3,300 350
Dec. 3,160 340
Sum $43,200 4,800
Average $3,600 $400
Average cost per hour $9.00
a (intercept) $684.65
b (coefficient) 7.2884
Standard error of the estimate 34.469
R-squared 0.99724
t-value for b 60.105
At 400 hours of activity, Armer management can be approximately two-thirds confident that the
maintenance costs will be in the range of
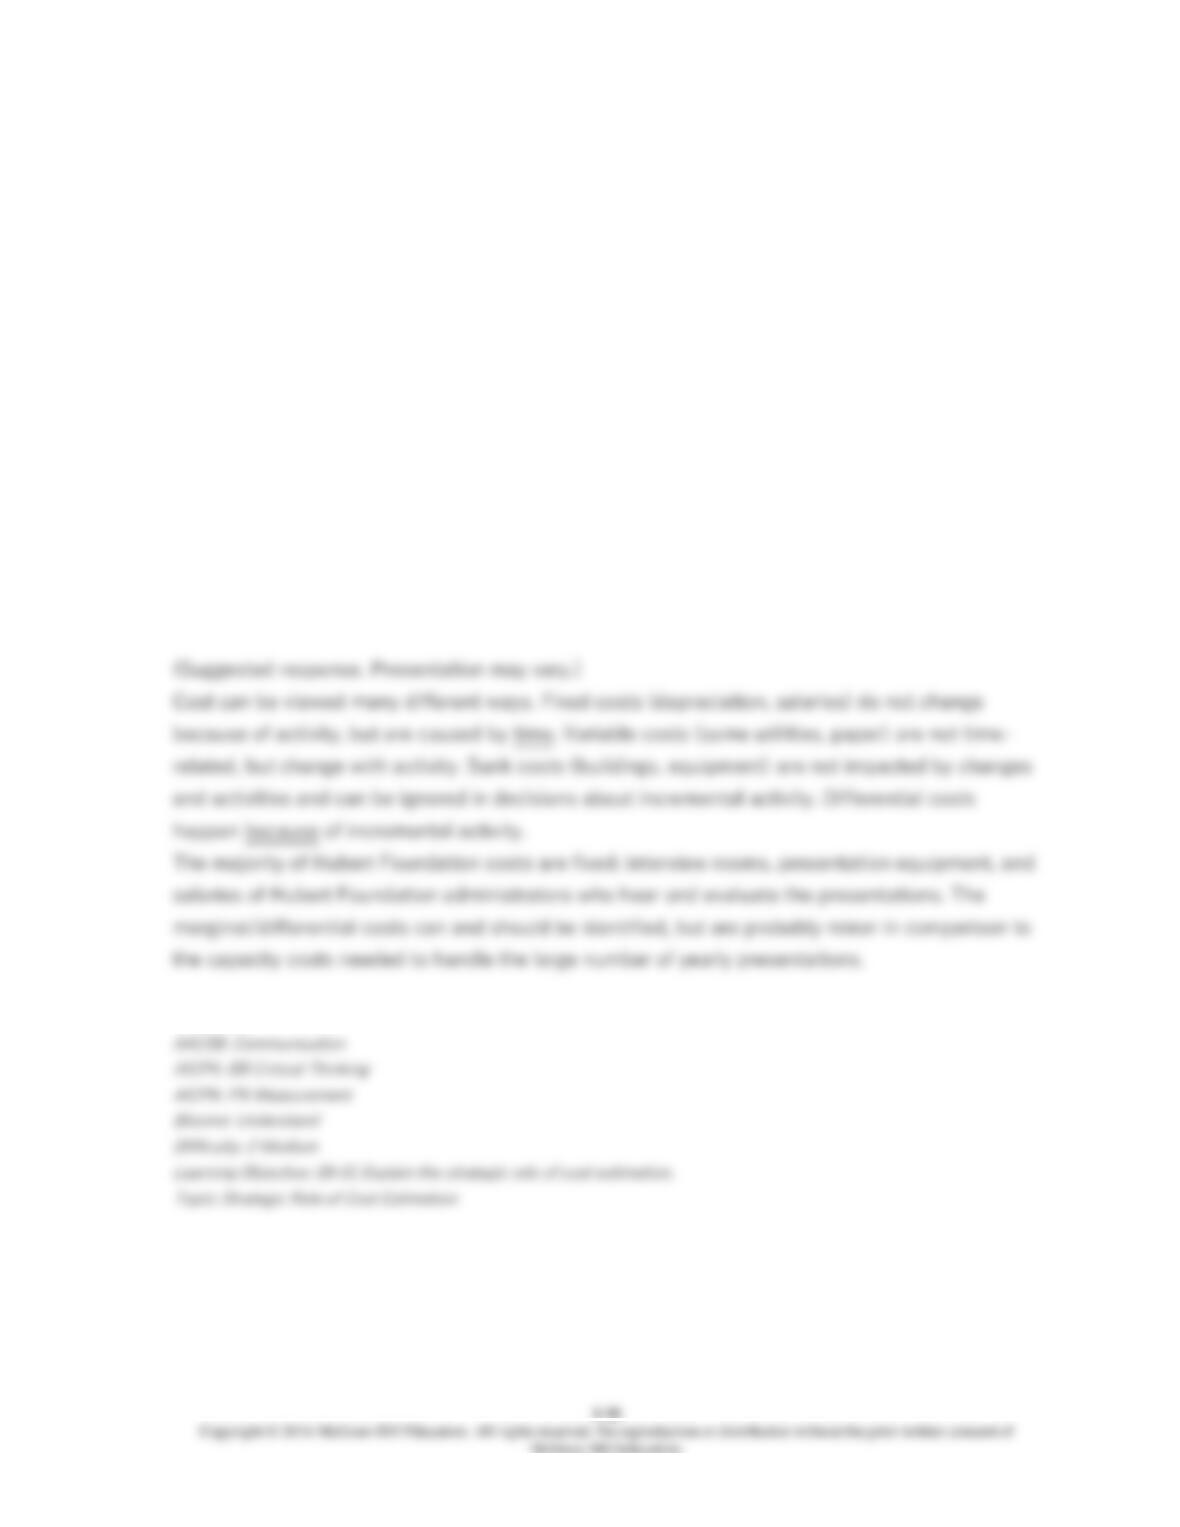
104. Based in Minneapolis, Minnesota, the Hubert Memorial Foundation has $300 million in
investments and contributes approximately 80 percent of the average annual return of $25 million
to worthy causes. Individuals and groups requesting grants of $100,000 or more must make an in–
person presentation of their request. These presentations generally involve three to five
individuals and take an average of two hours each. The Executive Director of the Hubert
Foundation is concerned with the cost of resources used to schedule and accommodate the 500
to 600 group presentations each year. She has asked you for suggestions about what kind of cost
data to gather, and ways to classify the data to help her understand cause/effect relationships
between costs and results.
Required:
Write a brief memo to the Executive Director giving her some basic information on cost
classification and behavior.
105. Green Mountain College is a 5,000 student state-supported, four-year institution located
in the mid-South. Physical facilities can accommodate another 1,000 students, and the college
administration is attempting to estimate the added yearly cost of educating the additional
students. The Business Manager of Green Mountain College has asked you to evaluate two linear
regressions given below, and recommend the better one to her.
Regression 1 Regression 2
SC = 4,303 + 143.50 CH SC = 3,800 + 441.25 IS
Coefficient of determination, 0.594 Coefficient of determination, 0.707
Standard error of the estimate, 117 Standard error of estimate, 133
(average cost is $6,025) (average cost is $6,025)
Where: SC = Student cost
CH = Cost per credit hour
IS = Incremental cost per student
Required:
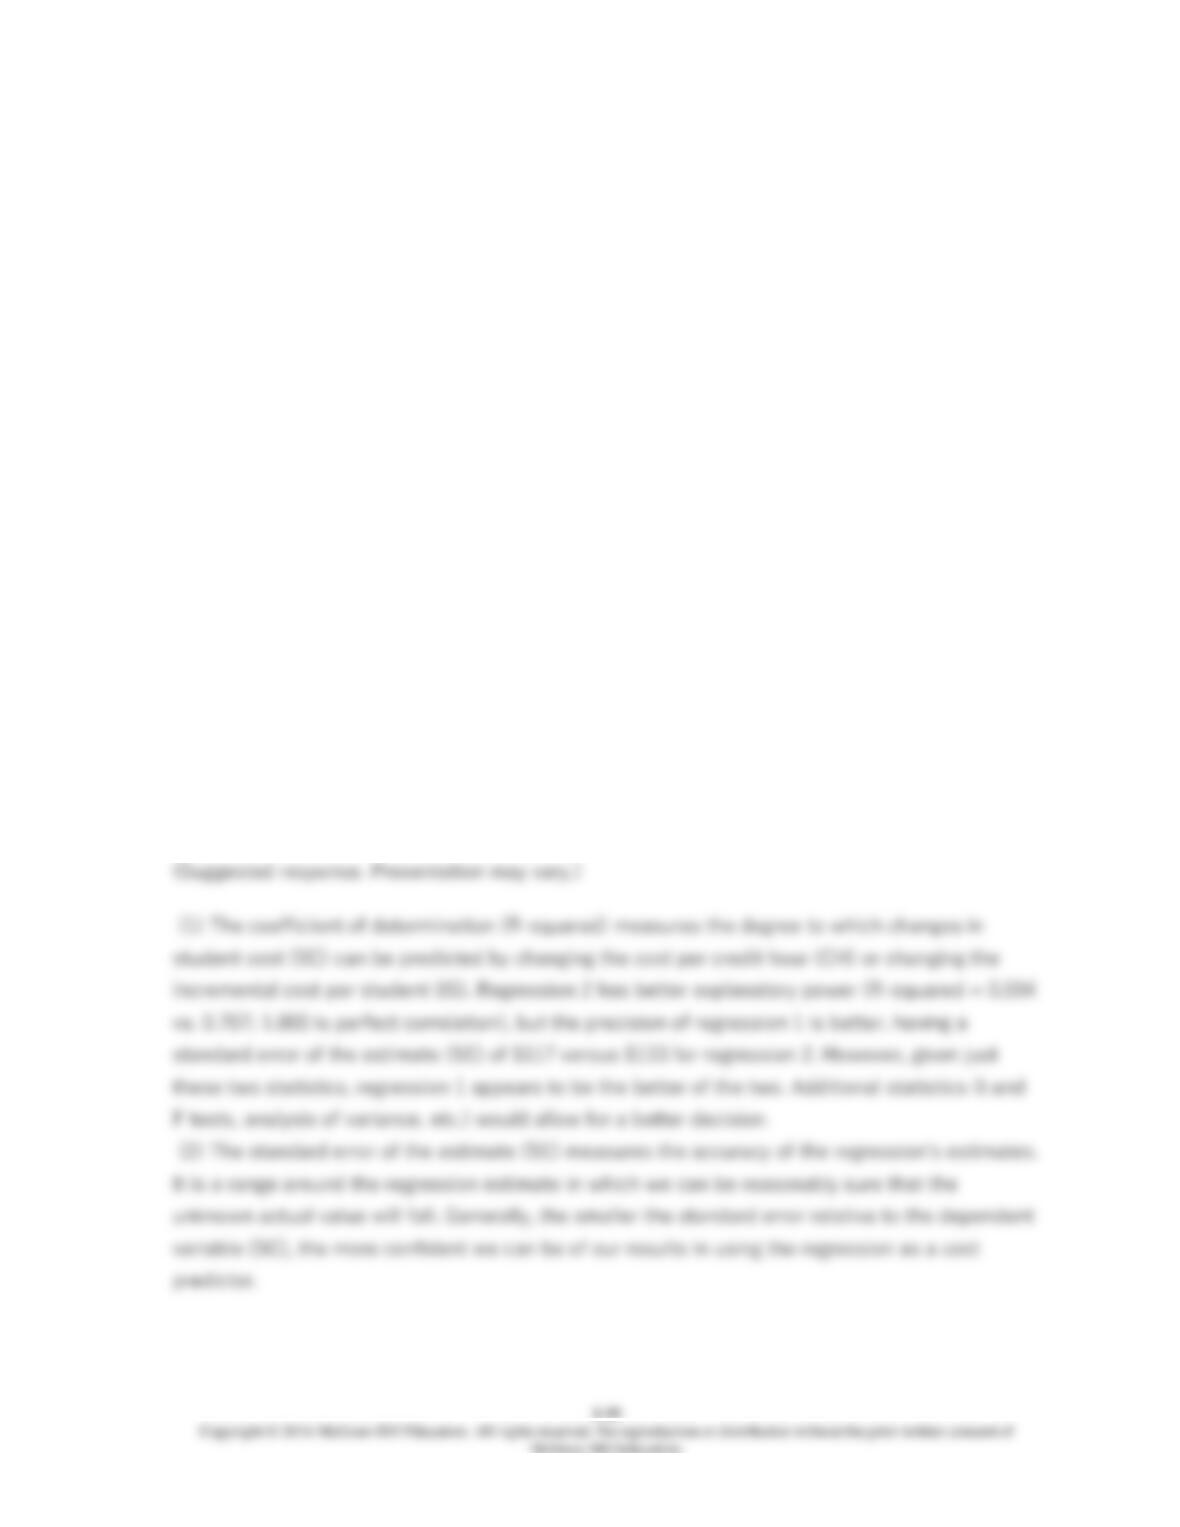
(1) Explain your choice of cost function (regression 1 or regression 2) for predicting added
student educational costs per year.
(2) What information value does the standard error of estimate (SE) have in this situation?
106. US Best Corporation produces and distributes products nationwide, and competes on
cost leadership. In order to maintain its current industry cost and price leadership role, US Best
uses cost-based pricing techniques. One of the factors considered in determining future prices is
the Consumer Price Index (CPI). Considerable discussion over the past few years on the national
level has strongly suggested the monthly CPI inflation adjustment figure is skewed upward by as
much as one percentage point.
Required:
What implication does this purported inflation exaggeration in the Consumer Price Index have on
US Best Corporation’s cost-based pricing changes in the near future?