
60. In a simple least-squares regression where X refers to the number of sales calls made by a sales
department and Y refers to the monthly total cost of the sales department, the value of X in the
regression output would represent:
a.
the estimated monthly total costs of the sales department.
b.
the estimated monthly fixed costs of the sales department.
c.
the estimated monthly variable costs per unit of the sales department.
d.
the percent of variation in Y that is explained by X.
61. In a simple least-squares regression where X refers to the number of sales calls made by a sales
department and Y refers to the monthly total cost of the sales department, the R-squared in the
regression output would represent:
a.
the estimated monthly total costs of the sales department.
b.
the estimated monthly fixed costs of the sales department.
c.
the estimated monthly variable costs per unit of the sales department.
d.
the percent of variation in Y that is explained by X.
SHORT ANSWER
1. Briefly discuss some of the areas of concern that make cost estimation and prediction difficult.
PROBLEM
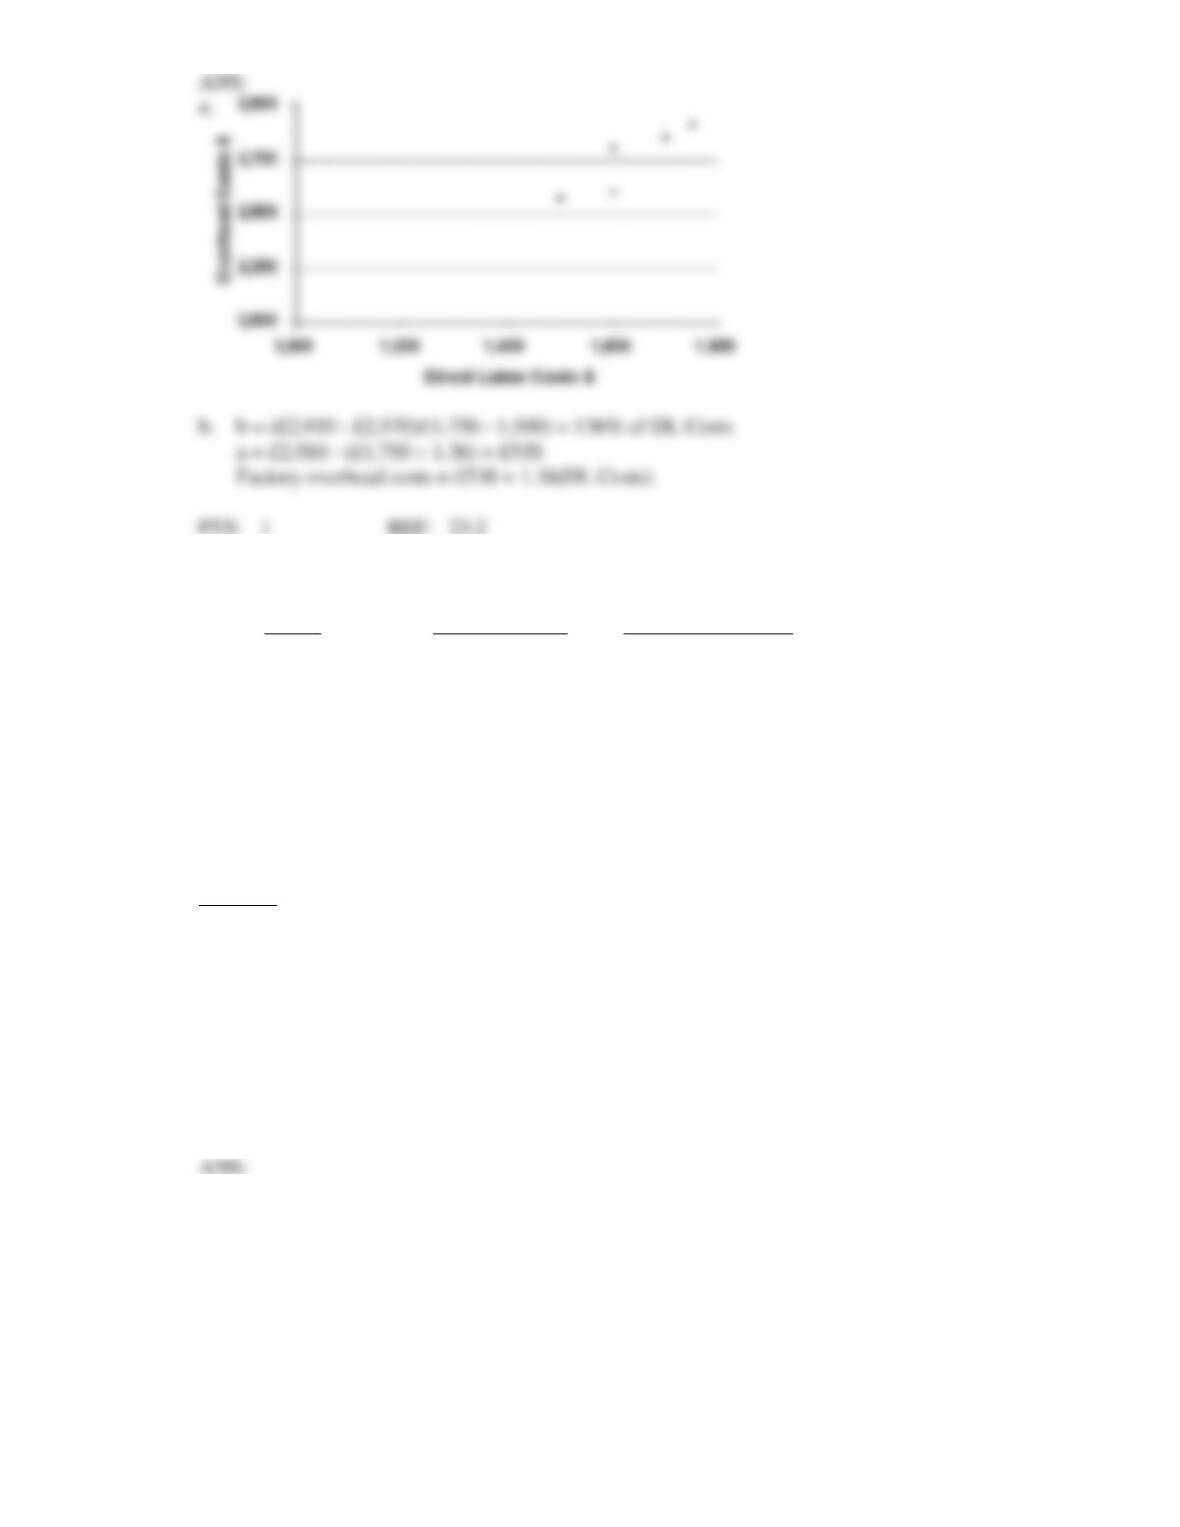
1. The Owen Company has the following cost data pertaining to the production of small desks:
Units Produced
Direct labour Costs
Overhead Costs
150
£1,600
£2,800
120
1,500
2,570
210
1,750
2,910
190
1,700
2,850
140
1,600
2,600
Required:
a.
Plot the preceding direct labour costs and overhead costs using the scatterplot method.
Overhead costs should be on the vertical axis.
b.
Compute the fixed and variable components of the overhead costs using the high-low method.
2. The following data were obtained from the books of Thomas Company:
Month
Overhead Costs
Direct labour Hours
1
£14
3
2
18
5
3
25
7
4
12
4
5
26
8
6
8
2
The normal equations are
XY = aX + bX2
Y = an + bX
Required:
Use a computer or calculator to prepare the following:
a.
Plot the data for overhead cost as a function of direct labour hours using the scatterplot
method.
b.
Compute the fixed and variable components of the overhead costs using the high-low method.
c.
Compute the fixed and variable components of the overhead costs using the least-squares
method.
d.
Discuss the strengths and weaknesses of the three different cost estimation techniques used in
parts a, b, and c.
b.
b = (£2,910 – £2,570)/(1,750 – 1,500) = 136% of DL Costs
a = £2,910 – (£1,750 1.36) = £530
3. Machine hours and electricity costs for Wells Industries for 2007 were as follows:
Month
Machine Hours
Electricity Costs
January
2,000
£ 9,200
February
2,320
10,500
March
1,520
6,750
April
2,480
11,500
May
3,040
14,125
June
2,640
11,000
July
3,280
12,375
August
2,800
11,375
September
1,600
7,750
October
2,960
13,000
November
3,760
15,500
December
3,360
13,875
Required:
a.
Using the high-low method, develop an estimate of variable electricity costs per machine hour.
b.
Using the high-low method, develop an estimate of fixed electricity costs per month.
c.
Using the high-low method, develop a cost function for monthly electricity costs.
d.
Estimate electricity costs for a month in which 3,000 machine hours are worked.
£3.91 [(£15,500 – £6,750)/(3,760 – 1,520)]
£798.40 [£15,500 – (£3.91 3,760)]
c.
Y = £798.40 + £3.91X, or
Electricity costs = £798.40 + (£3.91 Machine hours)
£12,528.40 [£798.40 + (£3.91 3,000)]
4. The plant manager requested information to assist in estimating maintenance costs. The following
computer printout was generated using the least-squares method:
Intercept
2550
Slope
1.85
Correlation coefficient
0.84
Activity variable
Units of production volume
Required:
a.
Using the information from the computer printout, develop a cost function that can be used to
estimate maintenance costs at different volume levels.
b.
Estimate maintenance costs if expected production for next month is 10,000 units.
5. Rush Company is trying to find an appropriate allocation base for factory overhead. Presented are five
months of data:
Month
Direct labour Hours
Machine Hours
Factory Overhead
January
10
3
£ 45
February
20
5
75
March
15
4
70
April
30
5
130
May
25
3
80
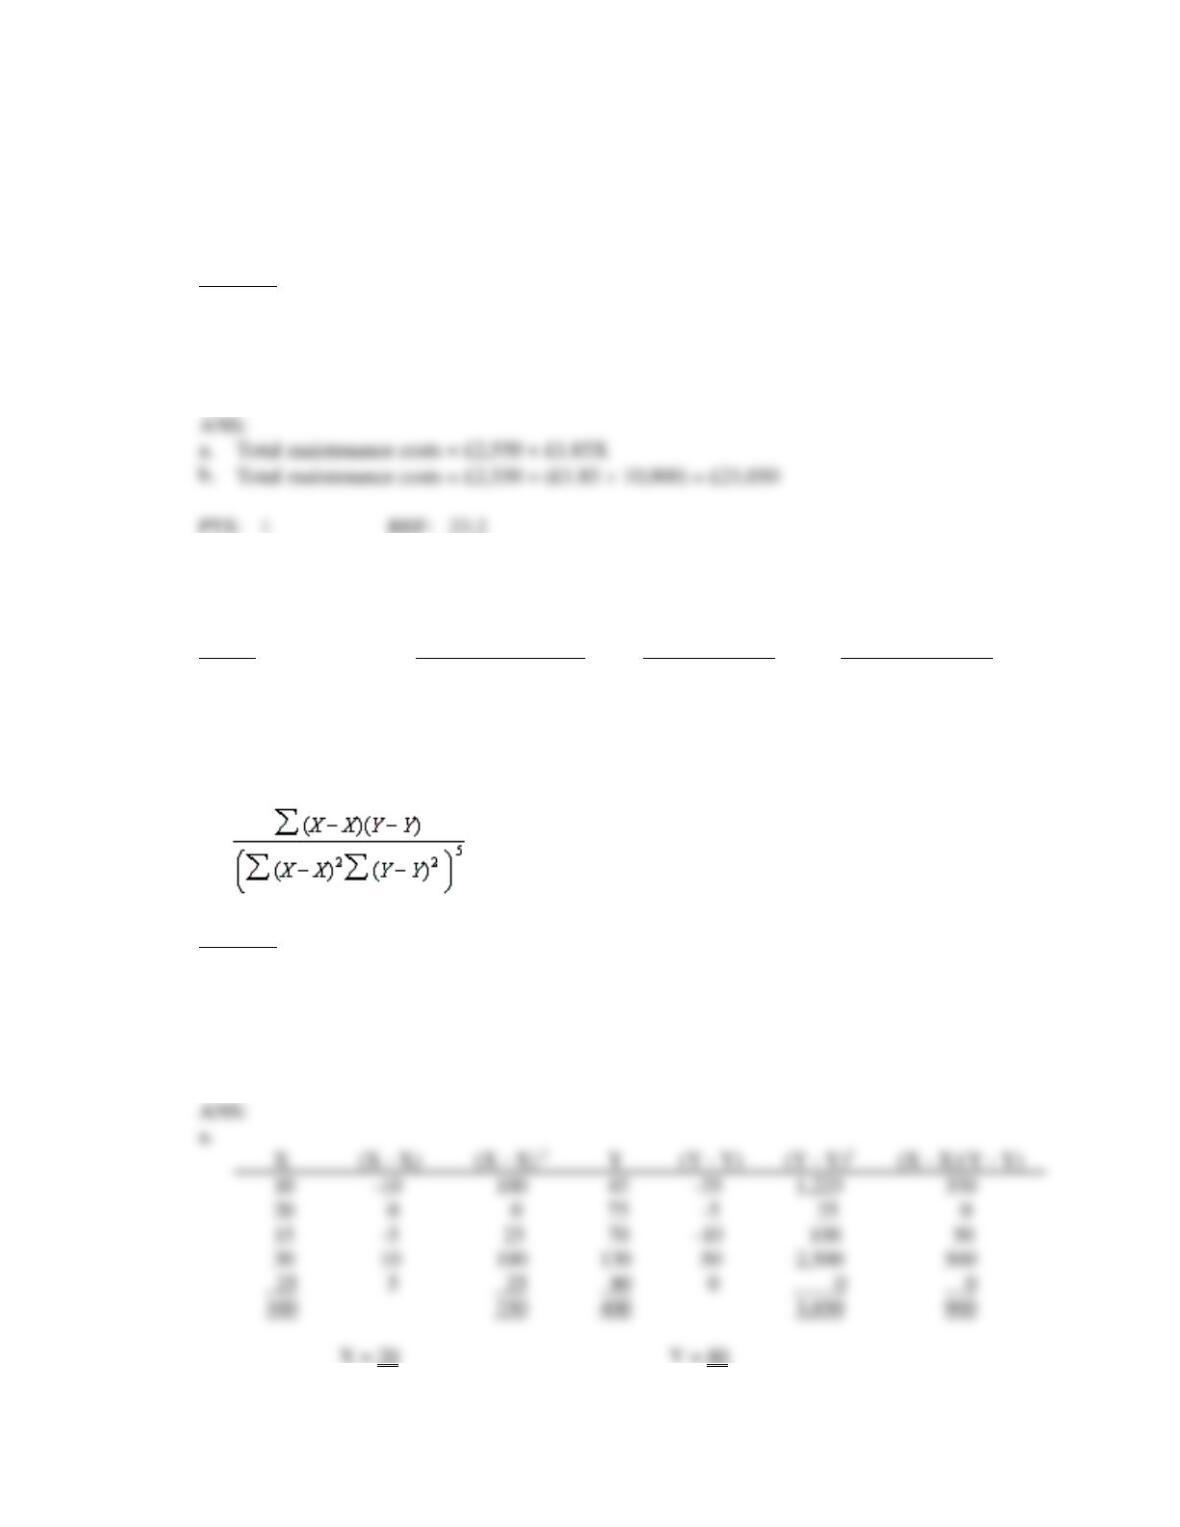
r =
Required:
a.
Calculate the correlation coefficient between factory overhead and direct labour hours.
b.
Calculate the correlation coefficient between factory overhead and machine hours.
c.
Should Rush Company use direct labour hours or machine hours for their allocation base for
factory overhead? Why?
130
400
X = 20
Y = 80
Total maintenance costs = £2,550 + £1.85X
6. The following computer printout estimated overhead costs using linear regression:
t for H(0)
Std. error
Parameter
Estimate
Parameter = 0
Pr > t
of parameter
Intercept
75
2.25
0.0250
33.33
Setup hours
13
5.10
0.0001
2.45
# of parts
50
1.65
0.0500
30.30
R Square (R2)
0.83
Standard Error (Se)
50.00
Observations
70
Required:
a.
Write the multiple regression model.
b.
What does R Square mean?
c.
Provide a 95 percent confidence interval around the number of parts parameter.
a.
Overhead costs = £75 + £13(setup hours) + £50(# of parts)
of parts.
c.
df = 70 – 3 = 67
t is about 2.00
£50 2(30.30) = [£(10.60), £110,60]
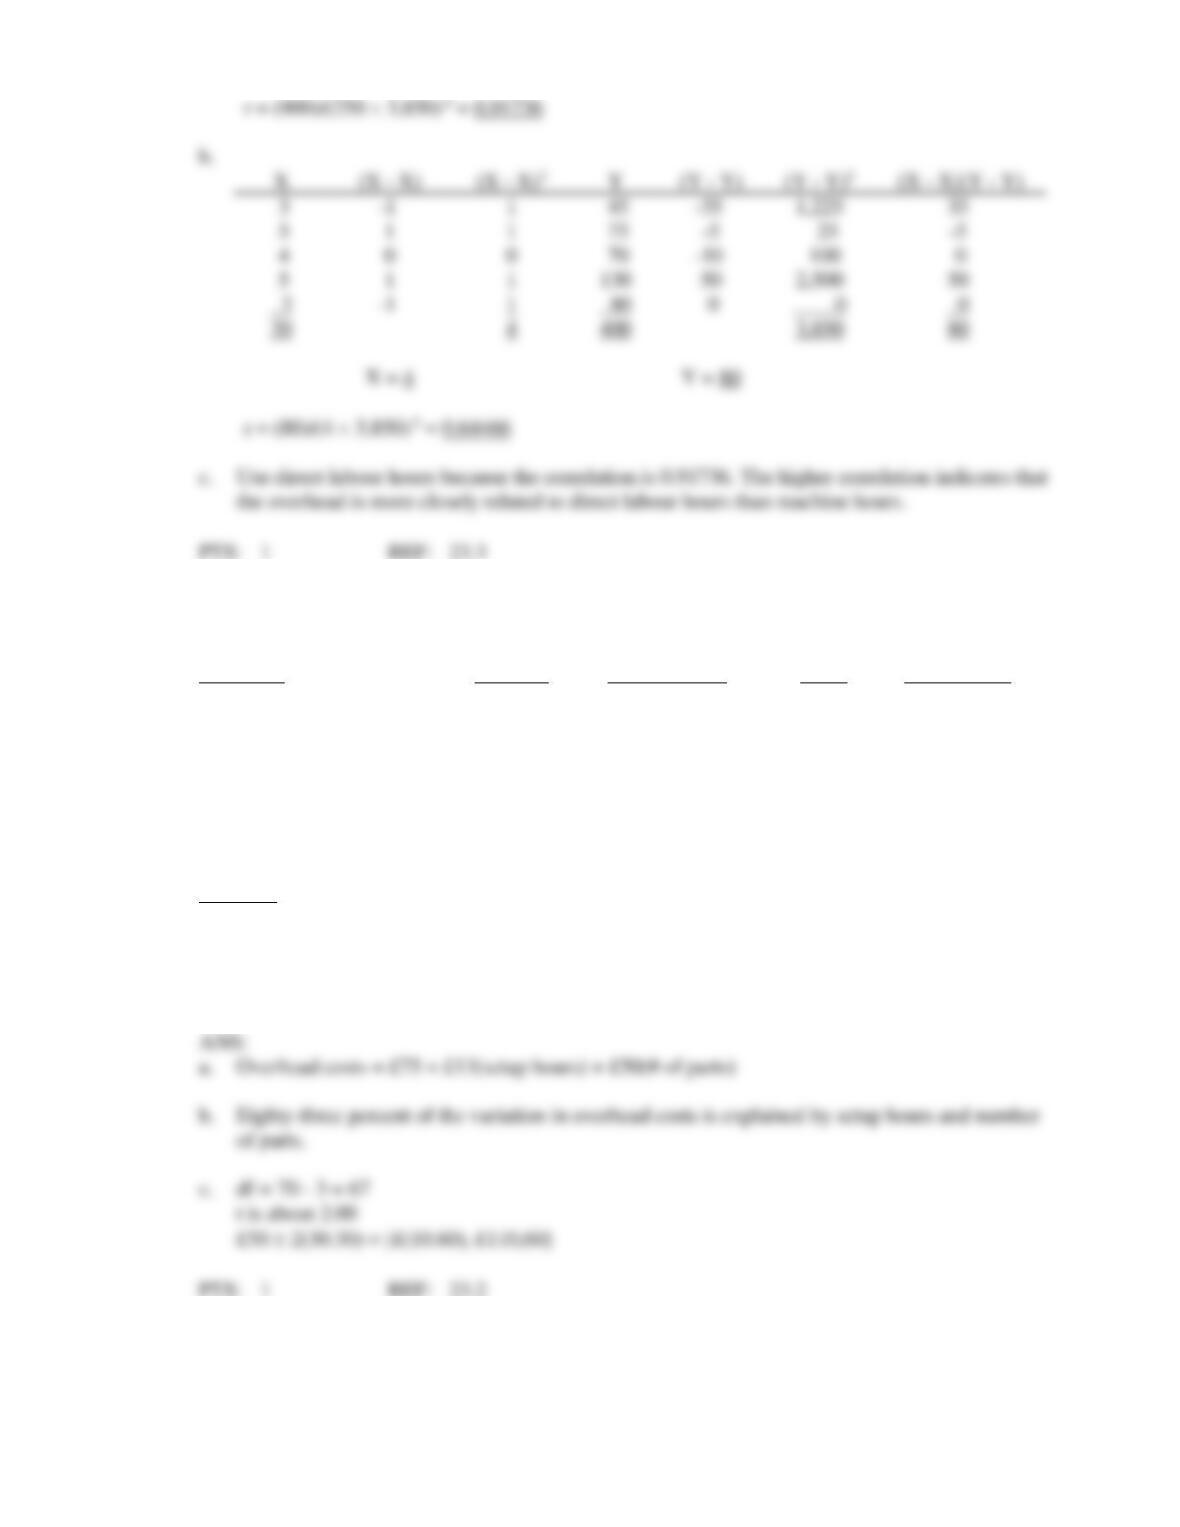
7. The Knapp Company needs to predict the labour cost in producing small carrot patch dolls. The
following production information is available:
b.
Y
-1
1
1,225
-5
-10
100
0
1
1
2,500
_3
-1
4
3,850
X = 4
Year
Dolls Produced
labour Hours
labour (£)
2002
1,150
850
£17,000
2003
1,600
975
23,400
2004
1,100
800
25,600
2005
2,100
1,150
36,800
2006
1,500
950
34,200
2007
1,300
875
35,000
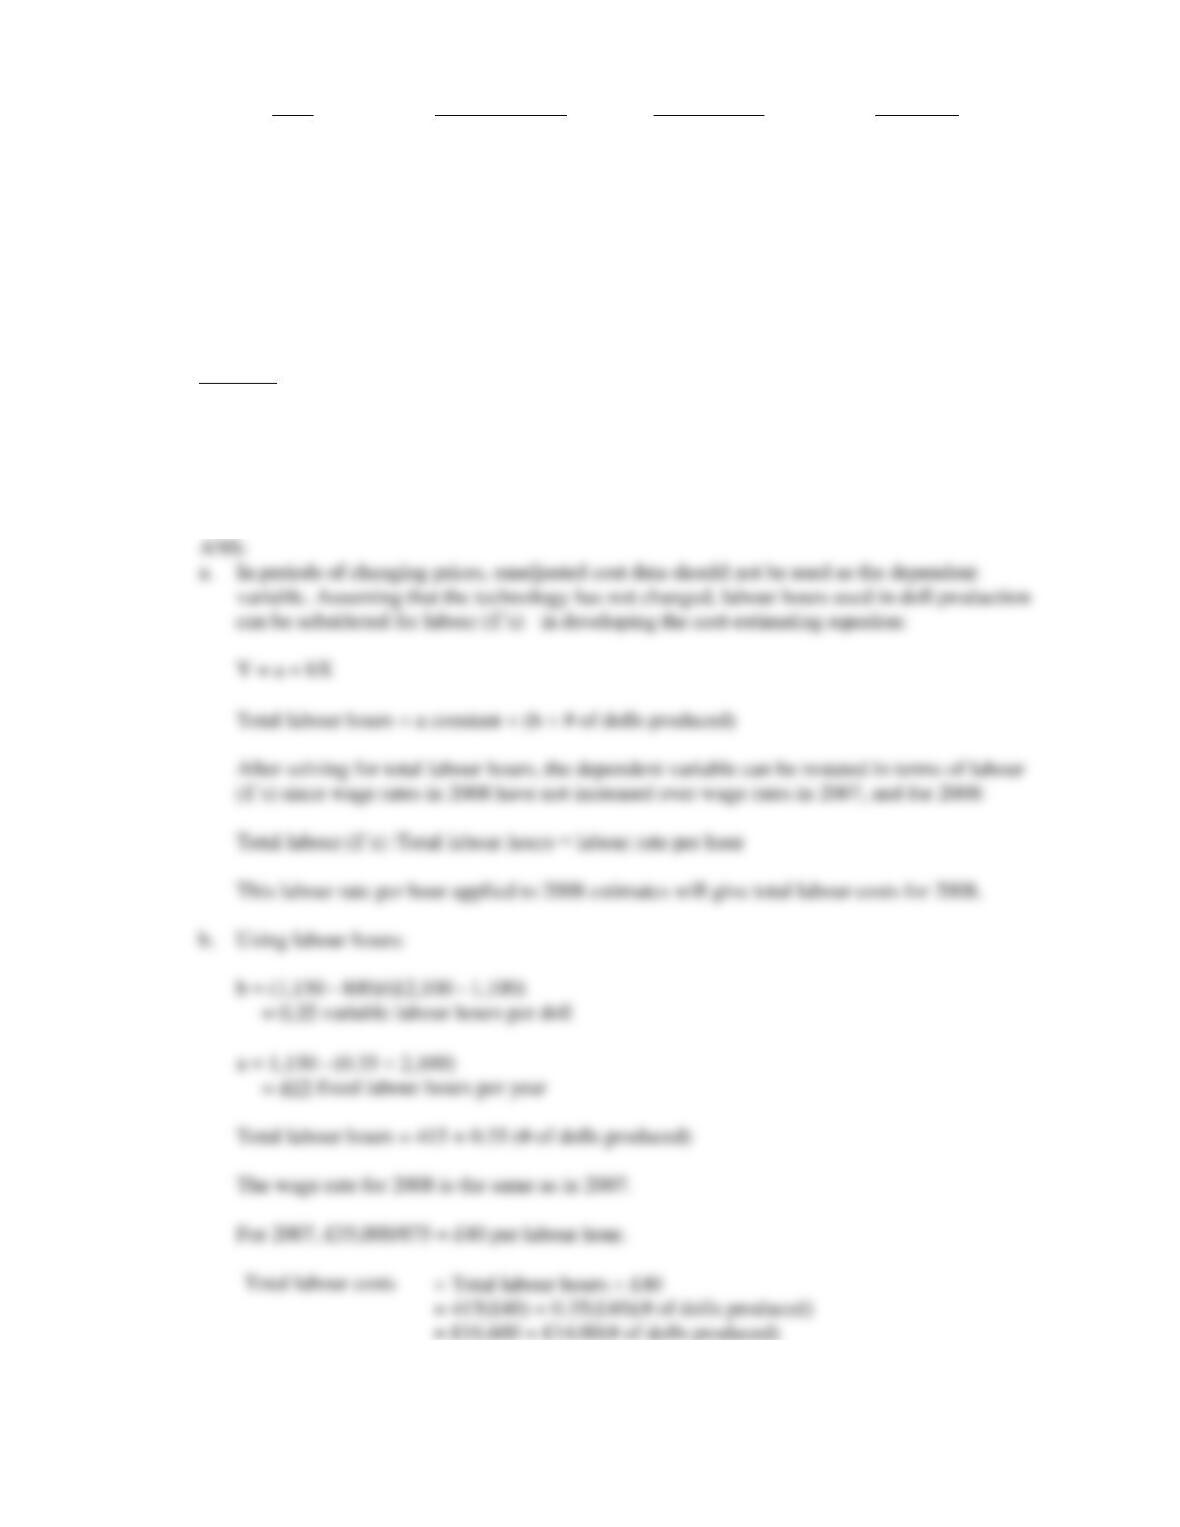
Wage rates have steadily increased since 2002; however, management expects no further increases in
2008.
Required:
a.
Select the appropriate independent variable for predicting labour cost. Explain the reason for
your selection.
b.
Develop an equation to predict for 2008 the labour cost of producing carrot patch dolls. Use
the high-low method.
After solving for total labour hours, the dependent variable can be restated in terms of labour
This labour rate per hour applied to 2008 estimates will give total labour costs for 2008.
b.
Using labour hours:
a = 1,150 – (0.35 2,100)
Total labour hours = 415 + 0.35 (# of dolls produced)
The wage rate for 2008 is the same as in 2007.
8. Innova, SA., is beginning the production of a new product. Management believes that 500 labour hours
will be required to complete the new unit. A 90 percent cumulative average-time learning curve model
for direct labour hours is assumed to be valid. Data on costs are as follows:
Direct materials
£50,000 per unit
Direct labour
£20 per direct labour hour
Variable manufacturing overhead
£30 per direct labour hour
Required:
a.
Set up a table with columns for cumulative number of units, cumulative average time per unit
in hours, and cumulative total time in hours using the cumulative average-time learning curve.
Complete the table for 1, 2, 4, and 8 units.
b.
Set up a similar table assuming an 80 percent with the cumulative average-time learning
curve.
c.
What is the difference in variable cost of producing four units?
b.
c.
0.90 model = £200,000 + 50(1620) = £281,000 /4 = £70,250
The difference is £4,250.
9. Innova, SA., is beginning the production of a new product. Management believes that 500 labour hours
will be required to complete the new unit. An 80 percent incremental unit-time learning curve model
for direct labour hours is assumed to be valid. Assume that the exponent b = -0.3219. Data on costs are
as follows:
Direct materials
£50,000 per unit
Direct labour
£20 per direct labour hour
Variable manufacturing overhead
£30 per direct labour hour
Required:
a.
Set up a table with columns for cumulative number of units showing the cumulative total time
in hours using the incremental unit-time learning curve. Complete the table for 1, 2, 3, and 4
units given the individual unit time for the nth unit as 500, 400, 351, and 320 for 1 to 4 units
respectively.
b.
Set up a similar table assuming a 90 percent with the incremental unit-time learning curve
with the individual unit time for the nth unit as 500, 450, 430, 405 for 1 to 4 units respectively.
c.
What is the difference in variable cost of producing four units?
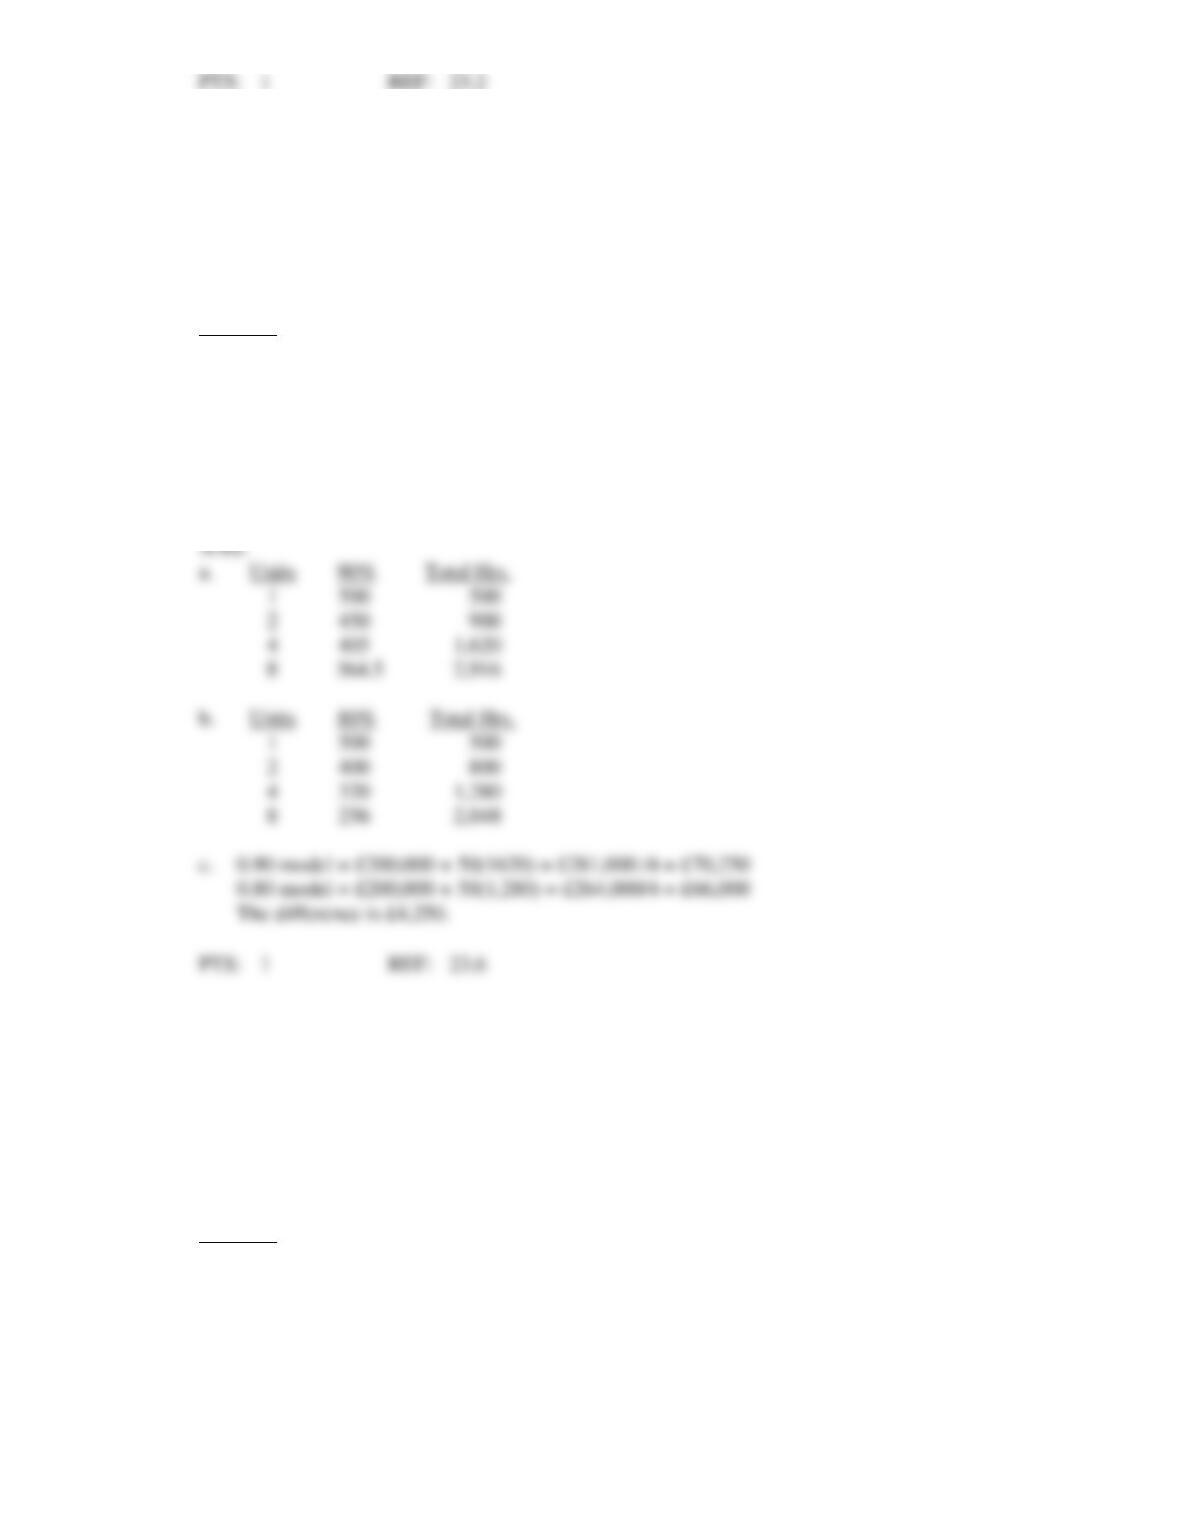
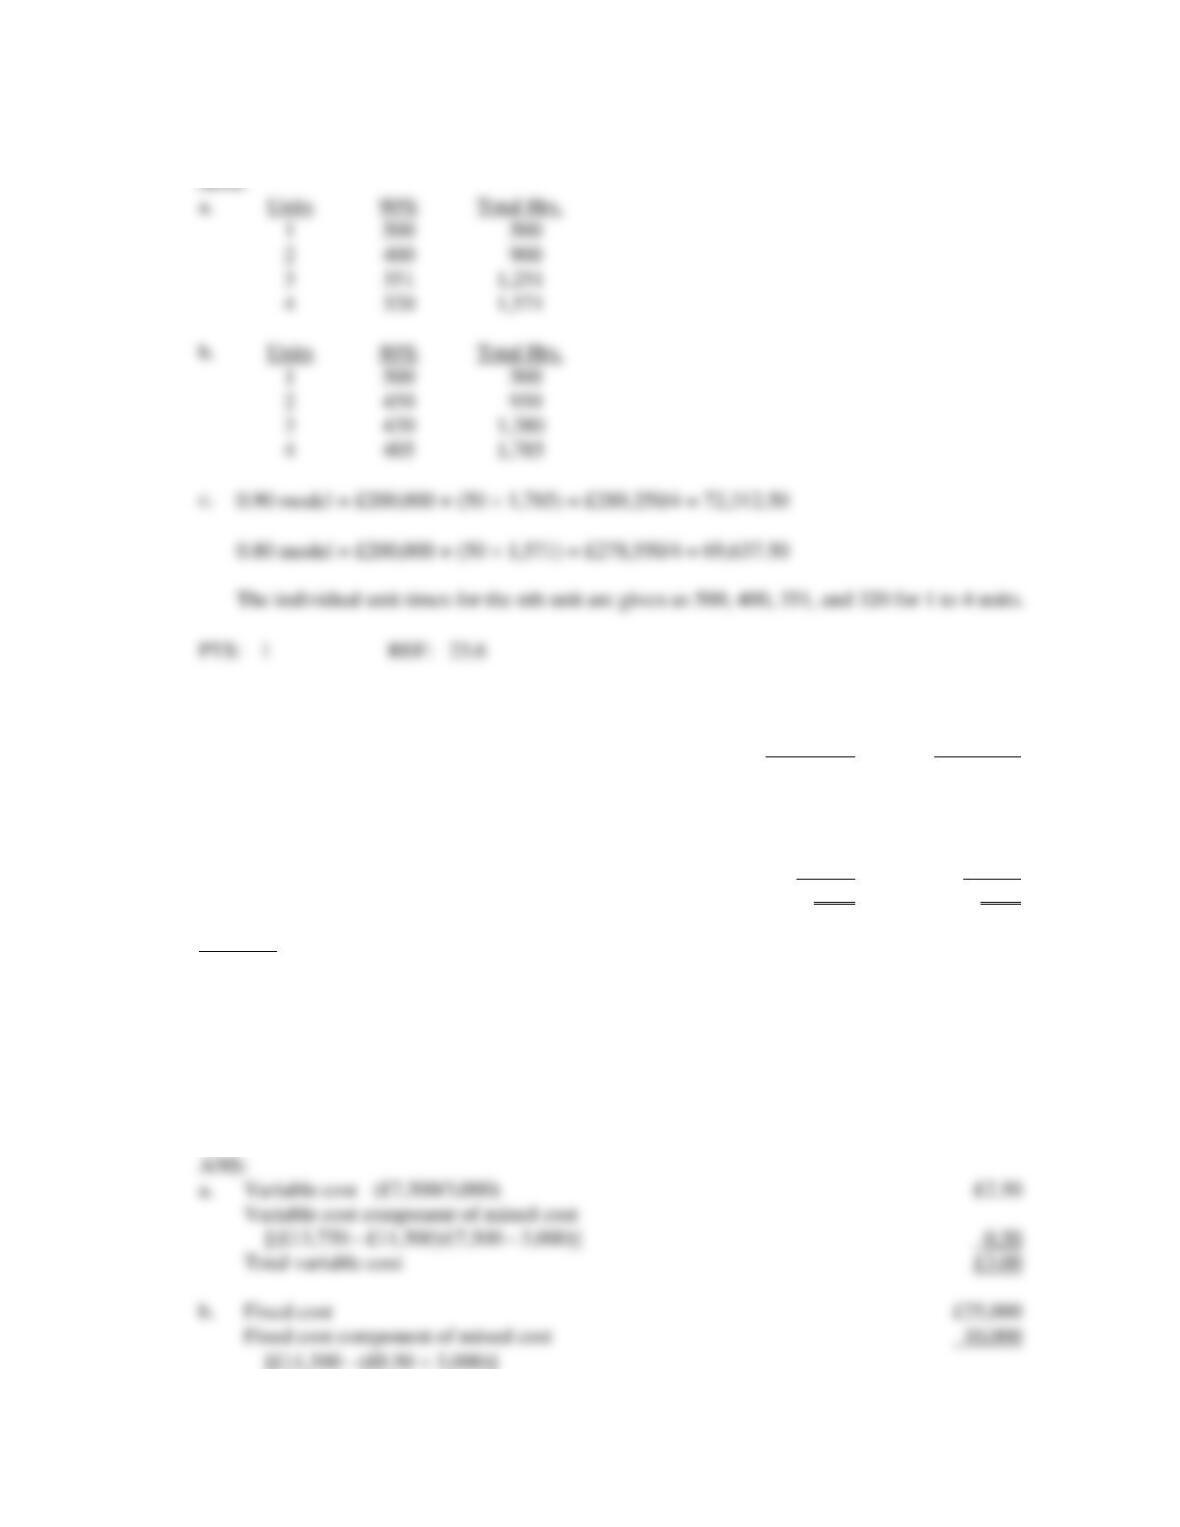
10. SeyChy collected the following data on manufacturing costs and activity cost drivers for two months:
November
December
Activity level in units
3,000
7,500
Variable costs
£ 7,500
£ ?
Fixed costs
25,000
?
Mixed costs
_11,500
_13,750
Total manufacturing costs
?
?
Required:
a.
What is total variable cost per unit?
b.
What is the total fixed cost?
c.
What is the estimated total manufacturing cost for January if the budgeted activity in January
is 6,000 units?
Variable cost (£7,500/3,000)
Variable cost component of mixed cost
[(£13,750 – £11,500)/(7,500 – 3,000)]
Total variable cost
b.
Fixed cost
[£11,500 – (£0.50 3,000)]
1,571
b.
1,380
0.90 model = £200,000 + (50 1,785) = £289,250/4 = 72,312.50
0.80 model = £200,000 + (50 1,571) = £278,550/4 = 69,637.50
The individual unit times for the nth unit are given as 500, 400, 351, and 320 for 1 to 4 units.
11. The operations manager of Elron Manufacturing requested information to assist in estimating
maintenance costs. The following computer printout was generated using the least squares method:
Intercept
7300
Slope
4.2
Correlation coefficient
90
Activity variable
Units of production volume
Required:
a.
Using the information from the computer printout, develop a cost function that can be used to
estimate maintenance costs at different volume levels.
b.
Estimate maintenance costs if expected production for next month is 20,000 units.
c.
What percentage change in maintenance costs can be explained by changes in production
volume?
Total maintenance costs = £7,300 + £4.20X
Total maintenance costs = £7,300 + (£4.20 20,000) = £91,300
c.
12. Machine hours and electricity costs for AMK Industries for the past year were as follows:
Month
Machine Hours
Electricity Costs
January
2,000
£18,900
February
2,400
21,500
March
1,400
14,000
April
2,600
23,500
May
3,300
28,750
June
3,300
22,700
July
3,600
25,250
August
3,000
23,250
September
1,500
16,000
October
3,300
26,500
November
4,200
31,500
December
4,200
22,250
Required:
a.
Using the high-low method, develop an estimate of variable electricity costs per machine hour.
b.
Using the high-low method, develop an estimate of fixed electricity costs per month.
c.
Using the high-low method, develop a cost function for monthly electricity costs.
d.
Estimate electricity costs for a month in which 1,300 machine hours are worked.
Total fixed cost
£35,000 + (6,000 £3) = £53,000
13. Samwise, SA., and Gandolph, SA., are two companies in the same industry. Both companies estimate
total fixed and variable overhead costs based on direct labour hours.
Required:
a.
Assume that Samwise, SA., estimated its total overhead at £400,000, the variable
overhead per direct labour hour at £8, and the activity level at 30,000 direct labour hours.
Determine fixed overhead.
b.
Assume that Gandolph, SA., uses a predetermined overhead rate of £15, based on 40,000
direct labour hours. The predetermined variable overhead rate is £12 per direct labour
hour. Determine the budgeted variable overhead and the budgeted fixed overhead.
Total cost = Fixed cost + (Variable rate Output)
Fixed cost = £160,000
Budgeted variable overhead = (£12 40,000) = £480,000
Budgeted fixed overhead = (£15 40,000) – £480,000 = £120,000
14. The plant manager requested information to assist in estimating maintenance costs. The following
computer printout was generated using the least squares method:
Intercept
10980
Slope
.95
Correlation coefficient
.89
Activity variable
Units of production
Required:
a.
Using the information from the computer printout, develop a cost function that can be used
to estimate maintenance costs at different volume levels.
b.
Estimate maintenance costs if expected production for next month is 40,000 units.
c.
What percentage change in maintenance costs can be explained by changes in production
volume?
Total maintenance costs =
£10,980 + £0.95X
£10,980 + (£0.95 40,000) =
£6.25 (£31,500 – £14,000)/(4,200 – 1,400)
£5,250 £31,500 – (£6.25 4,200)
Electricity costs = £5,250 + (£6.25 Machine hours)
£13,375 £5,250 + (£6.25 1,300)
£13,375 is the best estimate, but 1,300 is out of the relevant range.

15. Koch, SA., believes their electricity costs are affected by the number of machine hours worked.
Machine hours and electricity costs for the past year were as follows:
Month
Machine Hours
Electricity Costs
January
300
£ 6,000
February
240
4,250
March
580
7,750
April
860
9,750
May
1,040
11,250
June
940
11,000
July
1,140
14,000
August
900
12,250
September
1,240
14,250
October
740
7,750
November
480
7,000
December
380
6,500
Required:
1.
Using the high-low method,
a.
Develop an estimate of variable electricity costs per machine hour.
b.
Develop an estimate of fixed electricity costs per month.
c.
Develop a cost function for monthly electricity costs.
d.
Estimate electricity costs for a month in which 500 machine hours are worked using
the cost function in requirement c above.
2.
A regression analysis was performed to estimate the cost function and the following printout
was generated:
SUMMARY OUTPUT
Regression Statistics
Multiple R
0.965744
R Square
0.932662
Adjusted R Square
0.925928
Standard Error
885.7731
Observations
12
ANOVA
Df
SS
MS
F
Significance F
Regression
1
1.09E+08
1.09E+08
138.5044
3.51E–07
Residual
10
7845940
784594
Total
11
1.17E+08
Coefficients
Std Error
t Stat
P-value
Lower 95%
Upper 95%
Intercept
2433.588
637.9879
3.814474
0.003404
1012.062
3855.114
Machine Hours
9.337889
0.793445
11.76879
3.51E–07
7.569983
11.1058
Using the results of the method of least squares,
a.
Develop an estimate of variable electricity costs per machine hour.
b.
Develop an estimate of fixed electricity costs per month.
c.
Develop a cost function for monthly electricity costs.
d.
Estimate electricity costs for a month in which 500 machine hours are worked using the cost
function in requirement c above.
e.
Comment on the goodness of fit of the above cost function.
3.
Comment on and compare your estimates for electricity costs with 500 machine hours using
the high-low method and the method of least squares. Which one is better?
ANS:
16. On April 30, 2007, you were hired as a management accountant for Foxworth Manufacturing. Kim
Foxworth, the plant manager, has expressed frustration at the company’s inability to accurately forecast
total factory overhead using the following formula:
Total Factory Overhead
= £20,000 + £9X
R2
= .3
where X
= Direct labour hours
The following printout was generated by the data processing department using observations gathered
during the past 12 months:
Intercept
48,000
Regression coefficients:
Units
34
Setups
12
Engineering hours
5
R2
.96
Budgeted activity levels for April:
Units
10,000
Setups
200
Engineering hours
50
Direct labour hours
20,000
Required:
Prepare a memorandum to Kim Foxworth that includes the following:
a.
A new cost formula for estimating factory overhead costs
b.
An example of how the formula can be used to estimate costs for the month of April
1.
a. £10
(£14,250 – £4,250)/(1,240 – 240)
£14,250 – (£10 1,240)
c. Electricity costs = £1,850 + (£10 Machine hours)
£1,850 + (£10 500)
2.
a. £9.34
b. £2,433.59
c. Electricity costs = £2,433.59 + (£9.34 Machine hours)
d. £7,103.59 £2,433.59 + (£9.34 500)
c.
An explanation as to why the previous formula failed to accurately predict factory overhead
costs
ESSAY
1. Your company has just performed a least squares regression analysis of the monthly costs of
manufacturing a new product. What are some considerations that should be made before making a
decision based on the results of this analysis?
2. Identify the three different cost estimation techniques and provide a description of the strengths and
weaknesses of each.