2. What is kaizen costing? How does activity analysis help reduce costs?
3. For each following activity, determine the amount of value-added and nonvalue-added costs.
a.
The company keeps 7 days of materials inventory on hand to avoid shutdowns due to
materials shortages. Carrying costs are £50,000 per day.
b.
A time-and-motion study revealed that it should take 10 minutes to produce a product that
now takes 50 minutes to produce. labour is £18 per hour.
c.
Warranty work costs the firm £500,000 per year. Warranty costs for the industry average
£100,000 per year.
Value-added costs = £0
Nonvalue-added costs = (£50,000 7) = £350,000
Value-added costs = (£18 10/50) = £3.60
Value-added costs = £0
Nonvalue-added costs = £500,000
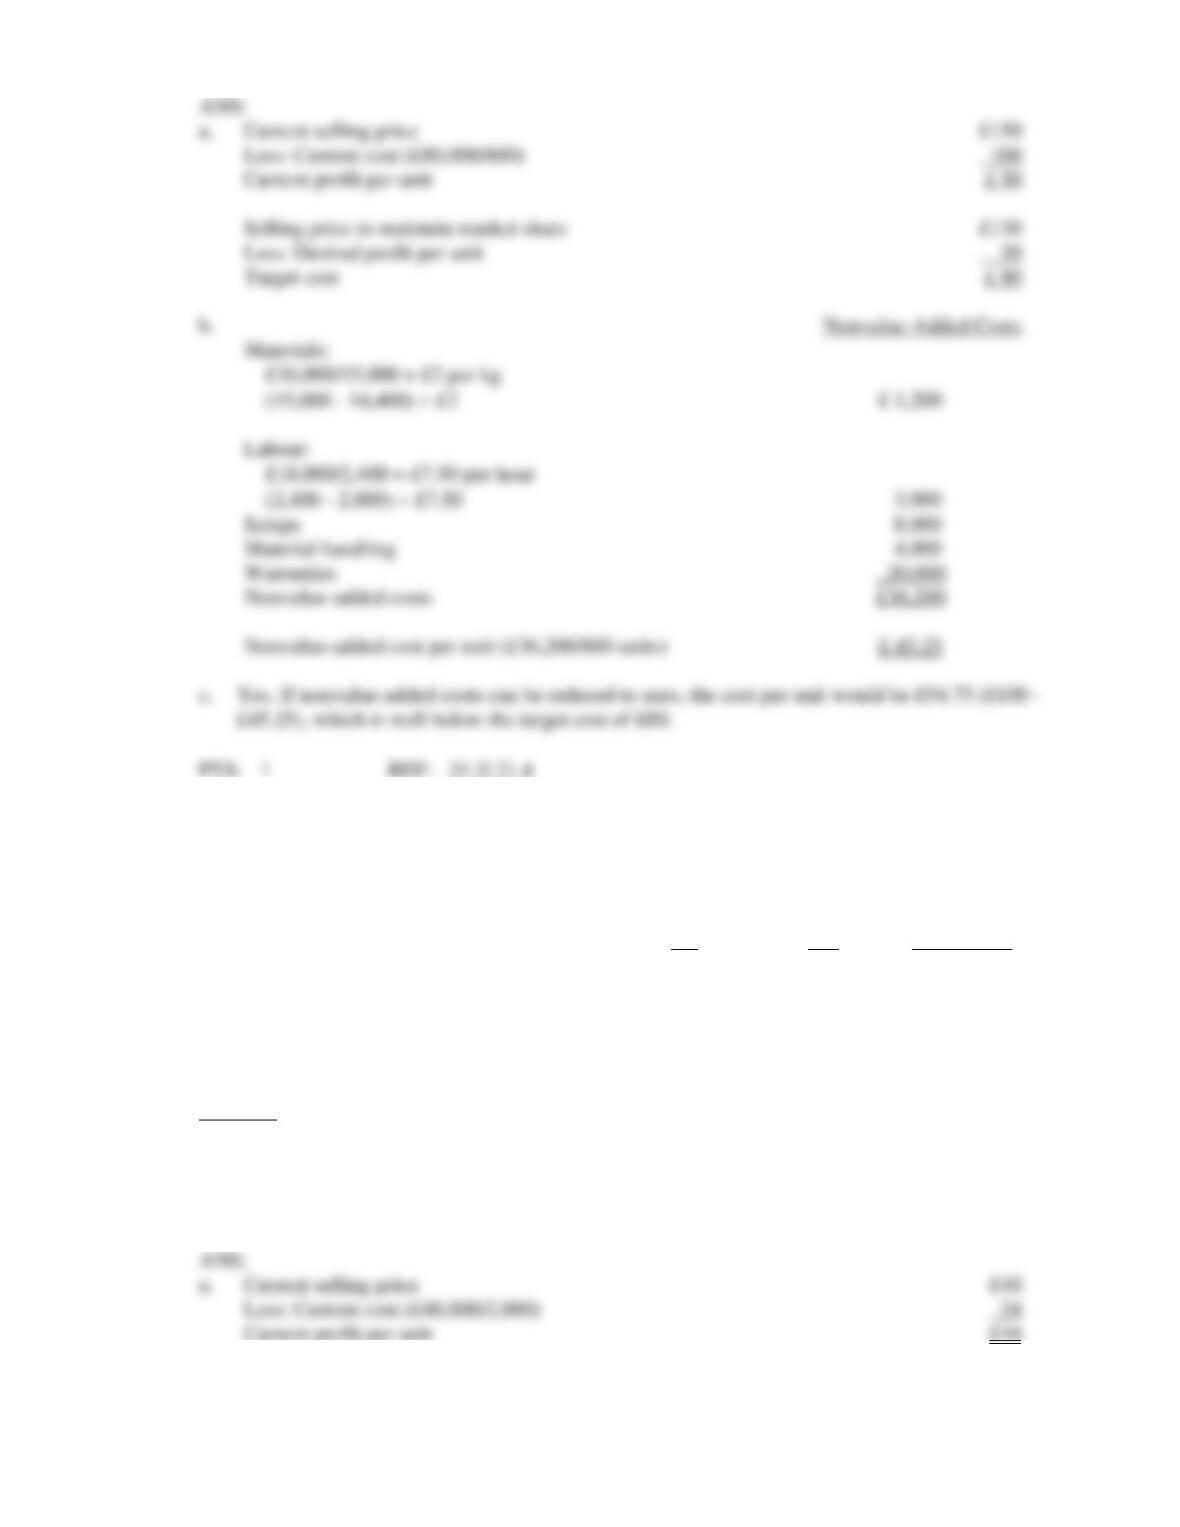
4. Clark, SA., sells one of its products for £150 each. Sales volume averages 800 units per year. Recently,
its main competitor reduced the price of its product to £130. Clark expects sales to drop dramatically
unless it matches the competitor’s price. In addition, the current profit per unit must be maintained.
Information about the product (for production of 800) is as follows:
SQ
AQ
Actual Cost
Materials (kgs)
14,400
15,000
£30,000
Labour (hours)
2,000
2,400
18,000
Setups (hours)
0
1,400
8,000
Material handling (moves)
0
600
4,000
Warranties (number repaired)
0
400
20,000
Required:
a.
Calculate the target cost for maintaining current market share and profitability.
b.
Calculate the nonvalue-added cost per unit.
c.
If nonvalue-added costs can be reduced to zero, can the target cost be achieved?
1.
2.
Activity selection
3.
Activity reduction
4.
Activity sharing
5. Park, SA., sells one of its products for £40 each. Sales volume averages 2,000 units per year. Recently,
its main competitor reduced the price of its product to £28. Park expects sales to drop dramatically
unless it matches the competitor’s price. In addition, the current profit per unit must be maintained.
Information about the product (for production of 2,000) is as follows:
SQ
AQ
Actual Cost
Materials (kgs)
4,900
5,000
£20,000
Labour (hours)
1,200
1,250
10,000
Setups (hours)
0
200
6,000
Material handling (moves)
0
350
2,000
Warranties (number repaired)
0
250
10,000
Required:
a.
Calculate the target cost for maintaining current market share and profitability.
b.
Calculate the nonvalue-added cost per unit.
c.
If nonvalue-added costs can be reduced to zero, can the target cost be achieved?
Current selling price
Less: Current cost (£48,000/2,000)
Current profit per unit
Current selling price
Less: Current cost (£80,000/800)
Current profit per unit
Selling price to maintain market share
Less: Desired profit per unit
Target cost
b.
Materials:
£30,000/15,000 = £2 per kg
(15,000 – 14,400) £2
Labour:
(2,400 – 2,000) £7.50
Setups
Material handling
Warranties
Nonvalue-added costs
Nonvalue-added cost per unit (£36,200/800 units)
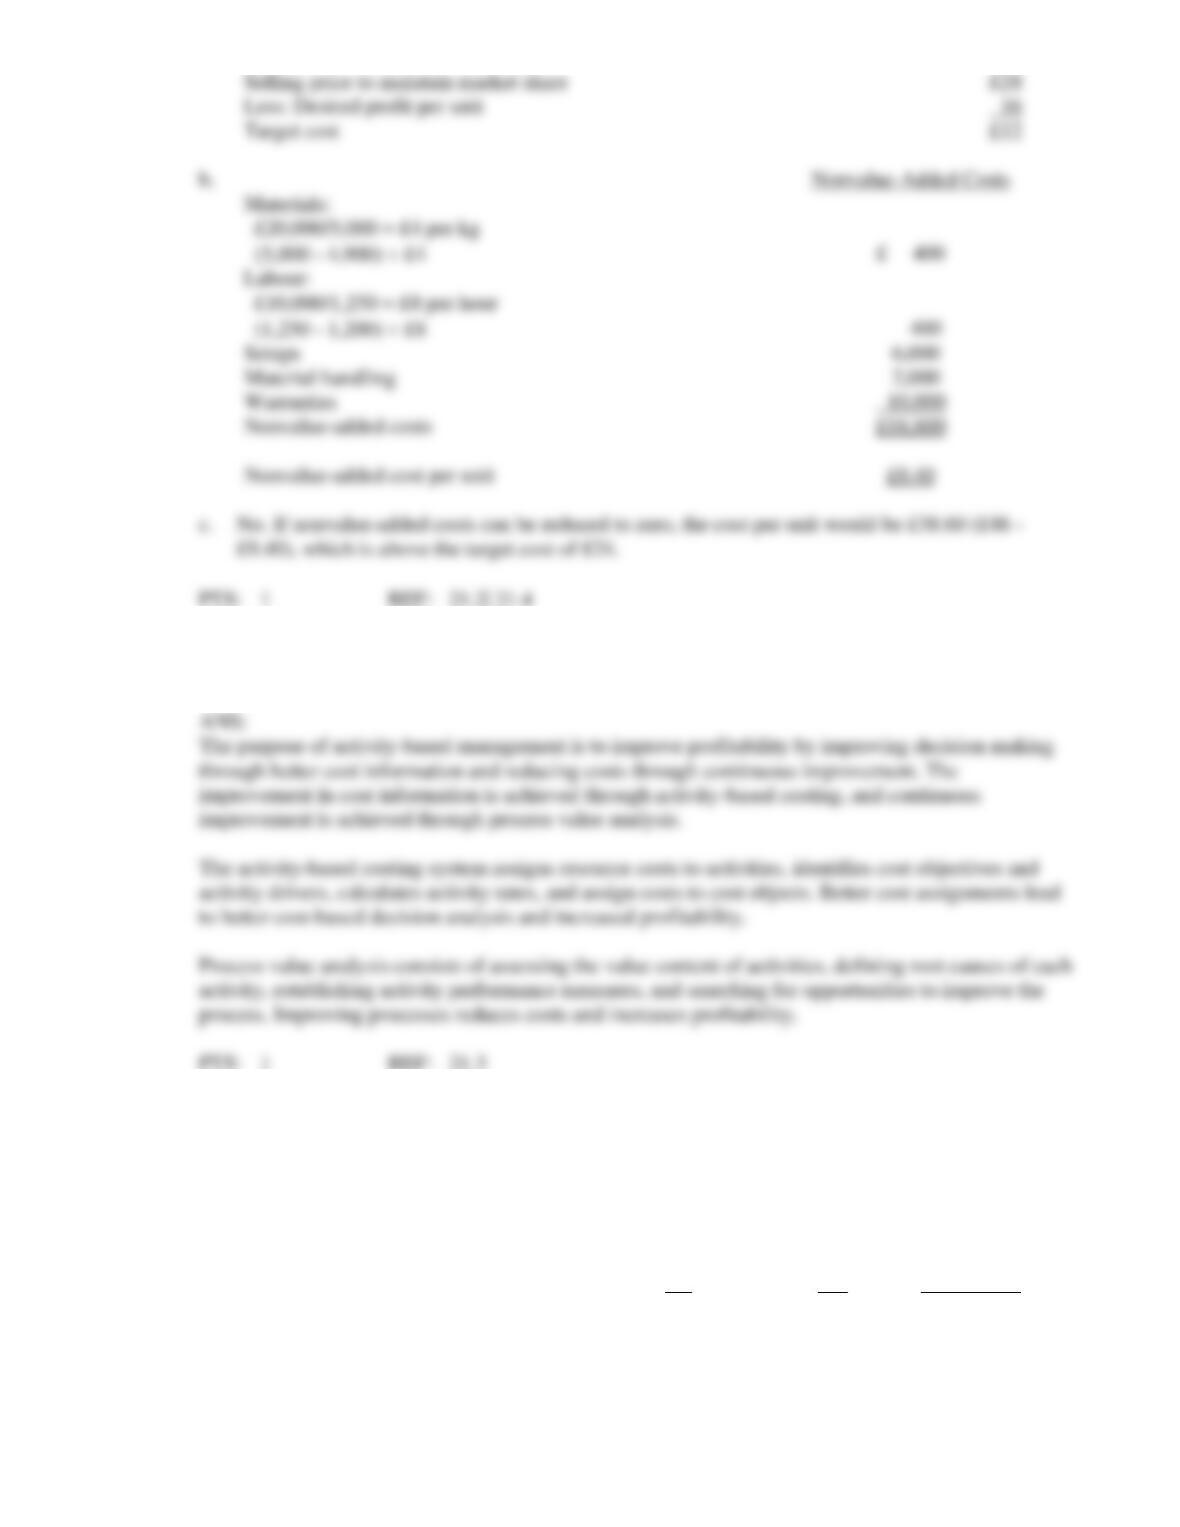
6. Describe how the activity-based management model combines the process and costing views. What
are the steps involved in each? What are the objectives of the activity-based management system?
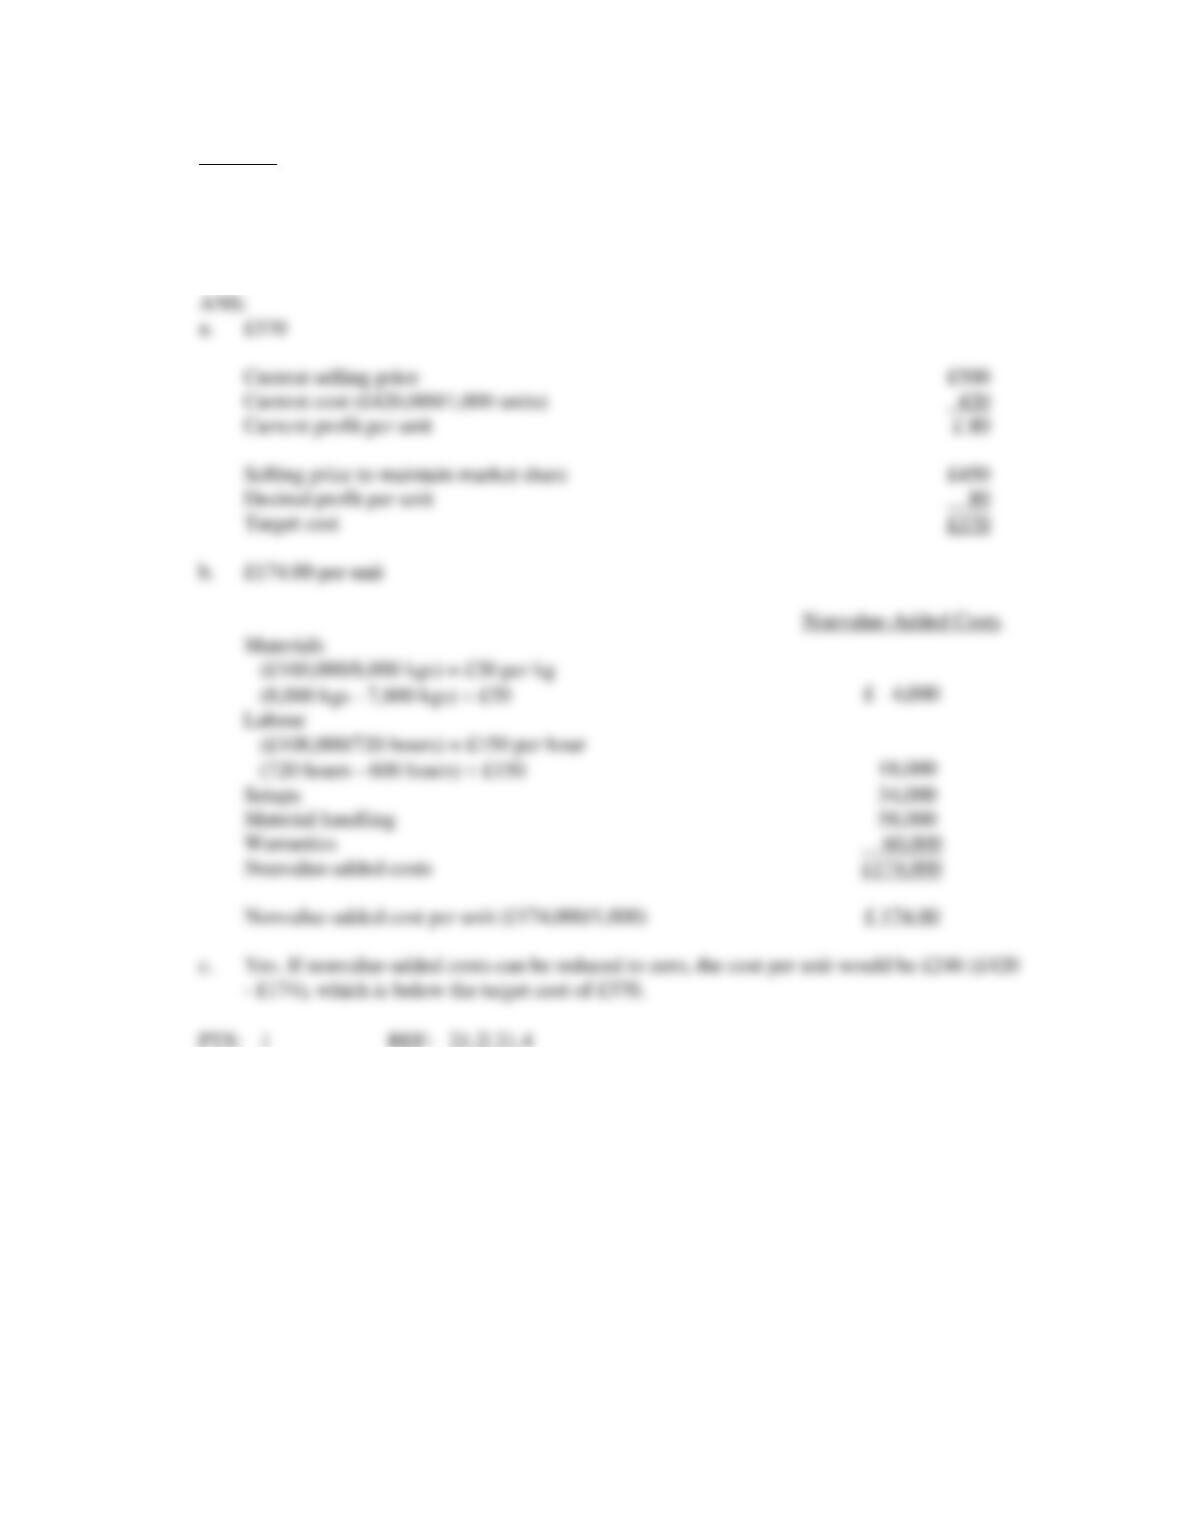
7. Craig, SA., sells one of its products for £500 each. Sales volume averages 1,000 units per year.
Recently, its main competitor priced their competing product at 10 per cent below Craig’s price. Craig
expects its sales to drop dramatically unless it matches the competitor’s price. Despite the anticipated
price reduction, Craig would like to maintain its current profit per unit.
Information regarding the inputs required to produce 1,000 units of product is as follows:
SQ
AQ
Actual Cost
Materials (kgs)
7,800
8,000
£160,000
Labour (hours)
600
720
108,000
Setups (hours)
-0-
600
34,000
Selling price to maintain market share
Target cost
b.
Materials:
(5,000 – 4,900) £4
£10,000/1,250 = £8 per hour
(1,250 – 1,200) £8
Material handling
Warranties
Material handling (moves)
-0-
300
58,000
Warranties (number repaired)
-0-
200
60,000
Required:
a.
Calculate the target cost for maintaining current market share and profitability.
b.
Calculate the nonvalue-added cost per unit.
c.
If nonvalue-added costs can be reduced to zero, can the target cost be achieved?
8. For each activity listed below, determine the amount of value-added and nonvalue-added costs.
a.
The company keeps seven days of raw materials inventory on hand to avoid shutdowns due
to raw materials shortages. Carrying costs are £25,000 per day.
Value-added costs:
Nonvalue-added costs:
b.
A time and motion study revealed that it should take 5 minutes to produce a product that
now takes 50 minutes to produce. Labour is £24 per hour.
Value-added costs:
Nonvalue-added costs:
c.
Warranty work costs the firm £250,000 per year. Warranty costs for the industry average
£50,000 per year.
£370
Current selling price
Current cost (£420,000/1,000 units)
Current profit per unit
Desired profit per unit
Target cost
b.
£174.00 per unit
Materials
(£160,000/8,000 kgs) = £20 per kg
(8,000 kgs – 7,800 kgs) £20
Labour
(£108,000/720 hours) = £150 per hour
(720 hours – 600 hours) £150
Setups
Material handling
Warranties
Nonvalue-added costs
Nonvalue-added cost per unit (£174,000/1,000)
c.
Yes. If nonvalue-added costs can be reduced to zero, the cost per unit would be £246 (£420
– £174), which is below the target cost of £370.
Value-added costs:
Nonvalue-added costs:
9. Grayson, SA., has developed ideal standards for four activities: labour, materials, inspection, and
receiving.
Information is as follows:
Activity
Activity Driver
SQ
AQ
SP
Labour
Hours
1,000
1,100
£ 16
Materials
kgs
4,000
5,000
£ 24
Inspection
Inspection hours
-0-
750
£ 11
Receiving
Orders
60
75
£400
The actual prices paid per unit of each activity driver were equal to the standard prices.
Required:
Complete the following cost report:
Activity
Value-Added
Nonvalue-Added
Actual
Labour
£ ?
£ ?
£ ?
Materials
?
?
?
Inspection
?
?
?
Receiving
_____?
_____?
_____?
Totals
£ ?
£ ?
£ ?
Activity
Value-Added
Materials
24,000
Inspection
8,250
Receiving
Totals
Value-added costs = £-0-
Nonvalue-added costs = £25,000 7 = £175,000
Value-added costs = £24 5/60 = £2
Nonvalue-added costs = [(50 – 5)/60] £24 = £18
Value-added costs = £-0-
Nonvalue-added costs = £250,000
10. Palms, SA., sells one of its products for £80 each. Sales volume averages 2,000 units per year.
Recently, its main competitor reduced the price of its product to £56. Palms expects its sales to drop
dramatically unless it matches the competitor’s price. In addition, the current profit per unit must be
maintained.
Information about the product (for production of 2,000) is as follows:
SQ
AQ
Actual Cost
Materials (kgs)
9,800
10,000
£40,000
Labour (hours)
2,400
2,500
20,000
Setups (hours)
-0-
400
12,000
Material handling (moves)
-0-
700
4,000
Warranties (number repaired)
-0-
500
20,000
Required:
a.
Calculate the target cost for maintaining current market share and profitability.
b.
Calculate the nonvalue-added cost per unit.
c.
If nonvalue-added costs can be reduced to zero, can the target cost be achieved?
11. Answer the following questions pertaining to just-in–time inventory management:
£24
Current selling price
Current cost (£96,000/2,000 units)
Current profit per unit
Selling price to maintain market share
Desired profit per unit
Target cost
b.
£18.80 per unit
Nonvalue-Added Costs
Materials
(£40,000/10,000 kgs) = £4 per kg
(10,000 kgs – 9,800 kgs) £4
Labour
(£20,000/2,500 hours) = £8 per hour
(2,500 hours – 2,400 hours) £8
Setups
Material handling
Warranties
Nonvalue-added costs
Nonvalue-added cost per unit (£37,600/2,000)
– £18.80), which is above the target cost of £24.
a.
Identify key elements of the JIT philosophy.
b.
What elements of the JIT approach contribute to reducing materials inventory?
c.
Why do proponents of JIT believe inventory is an enemy?
12. The following reasons have been offered for holding inventories:
1.
To balance ordering or setup costs and carrying costs
2.
To satisfy customer demand (e.g., meet delivery dates)
3.
To avoid shutting down manufacturing facilities because of
(a) machine failure
(b) defective parts
(c) unavailable parts
4.
Unreliable production processes
5.
To take advantage of discounts
6.
To hedge against future price increases
Required:
a.
Explain how the JIT approach responds to each of these reasons and, consequently, argues for
insignificant levels of inventories.
b.
The theory of constraints (TOC) criticizes the JIT approach to inventory management, arguing
that it fails to protect throughput. Explain what this means and describe how TOC addresses
this issue.
a.
Key elements of the JIT philosophy include inventory reduction, reduced production times,
13. Using the abbreviations listed below, indicate for each of the costs whether the cost should be
classified as:
P
=
Prevention
D
=
Detection
I
=
Internal Failure
E
=
External Failure
N
=
None of the above
1.
Cleaning up contaminated soil
2.
Designing processes
3.
Recycling scrap
4.
Auditing environmental activities
5.
Testing for contamination
6.
Losing a lake for recreational use
7.
Measuring contamination levels
8.
Recycling products
9.
Maintaining pollution equipment
10.
Evaluating and selecting suppliers
1.
Cleaning up contaminated soil
P
2.
Designing processes
I
3.
Recycling scrap
D
4.
Auditing environmental activities
D
5.
Testing for contamination
6.
Losing a lake for recreational use
D
7.
Measuring contamination levels
defects), and building the right kind of relationship with suppliers.
6.
JIT emphasizes long-term contracts that stipulate prices and acceptable quality levels.
14. Using the abbreviations listed below, indicate for each of the costs whether the cost should be
classified as:
P
=
Prevention
D
=
Detection
I
=
Internal Failure
E
=
External Failure
N
=
None of the above
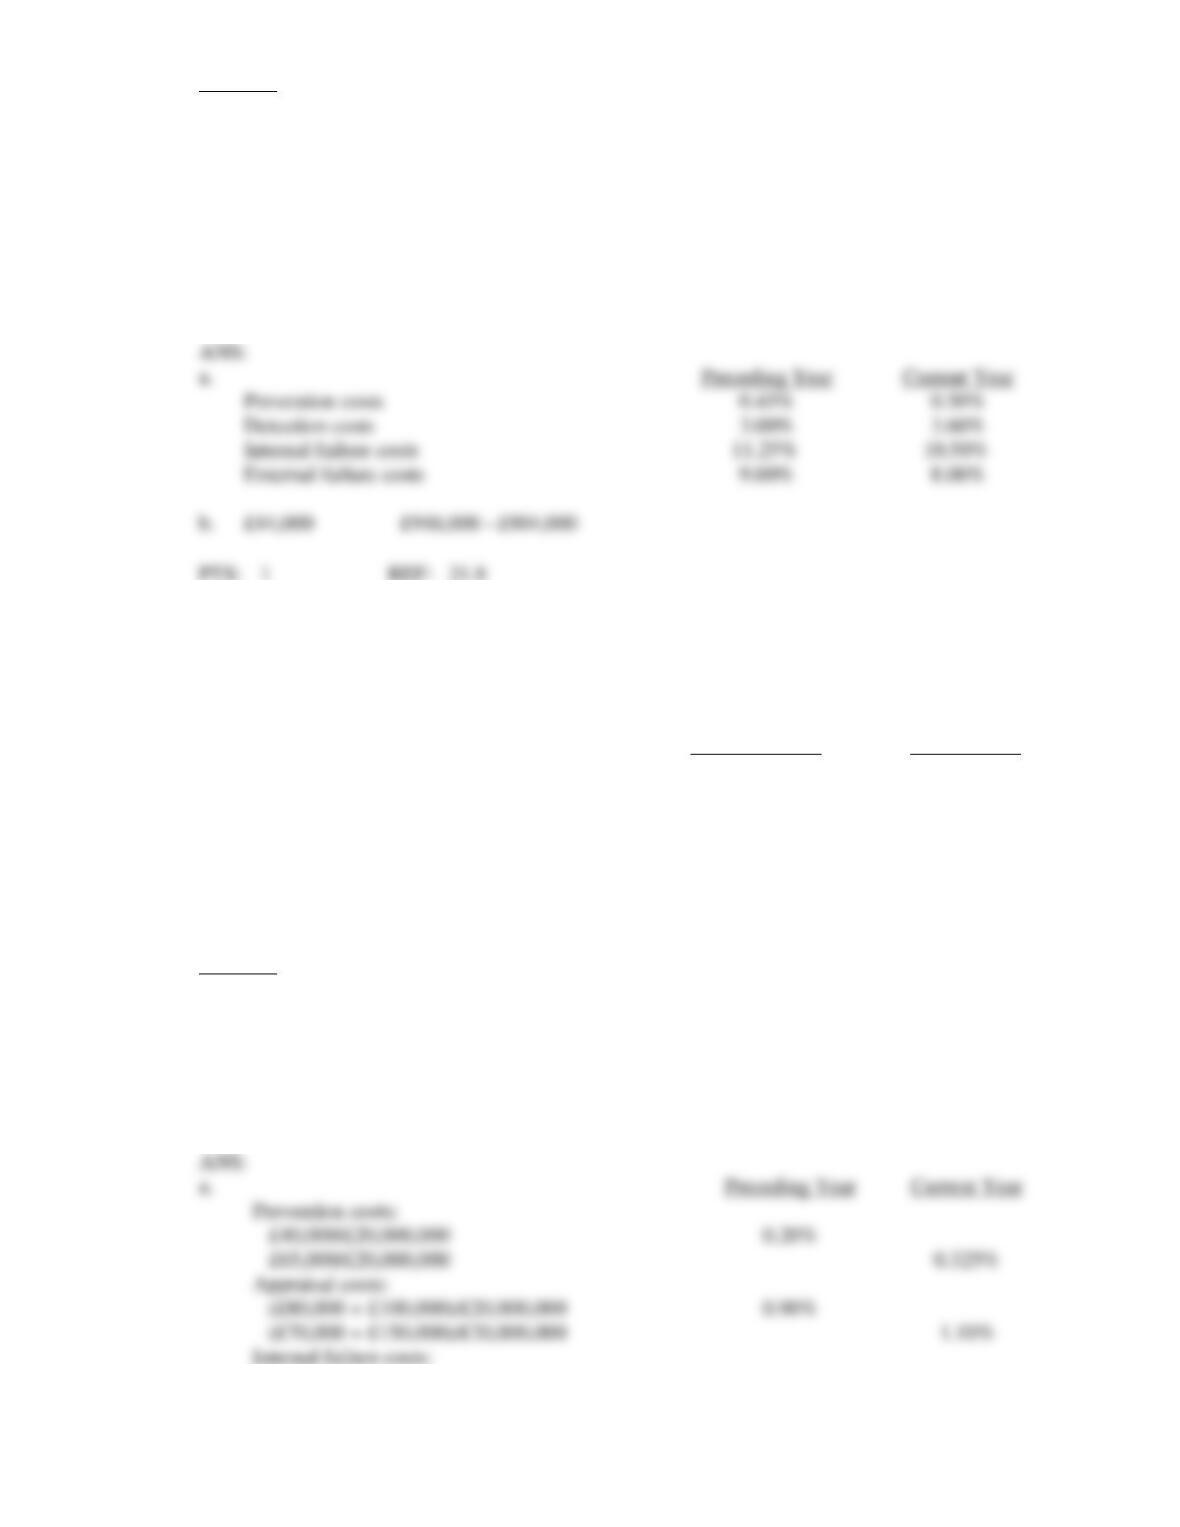
1.
Inspecting products and processes
2.
Verifying supplier environmental performance
3.
Testing for contamination
4.
Obtaining ISO 14001 certification
5.
Carrying out environmental studies
6.
Operating pollution control equipment
7.
Cleaning up a polluted lake
8.
Recycling scrap
9.
Recycling products
10.
Cleaning up oil spills
ANS:
D
1.
Inspecting products and processes
2.
Verifying supplier environmental performance
D
3.
Testing for contamination
P
4.
Obtaining ISO 14001 certification
5.
Carrying out environmental studies
I
6.
Operating pollution control equipment
E
7.
Cleaning up a polluted lake
I
8.
Recycling scrap
P
9.
Recycling products
Cleaning up oil spills
15. At the beginning of the year, Paris, SA., initiated an environmental cost reduction program. To help
assess the impact of the environmental cost reduction improvement program, the following data was
collected for the current and preceding year:
Preceding Year
Current Year
Operating costs
£4,000,000
£4,000,000
Designing products
18,000
20,000
Auditing environmental activities
40,000
64,000
Recycling scrap
200,000
180,000
Restoring land to natural state
360,000
320,000
Operating pollution control equipment
250,000
240,000
Testing for contamination
80,000
80,000
I
9.
Maintaining pollution equipment
P
10.
Evaluating and selecting suppliers
Required:
a.
Compute each category of environmental quality costs as a percentage of operating costs for
each year.
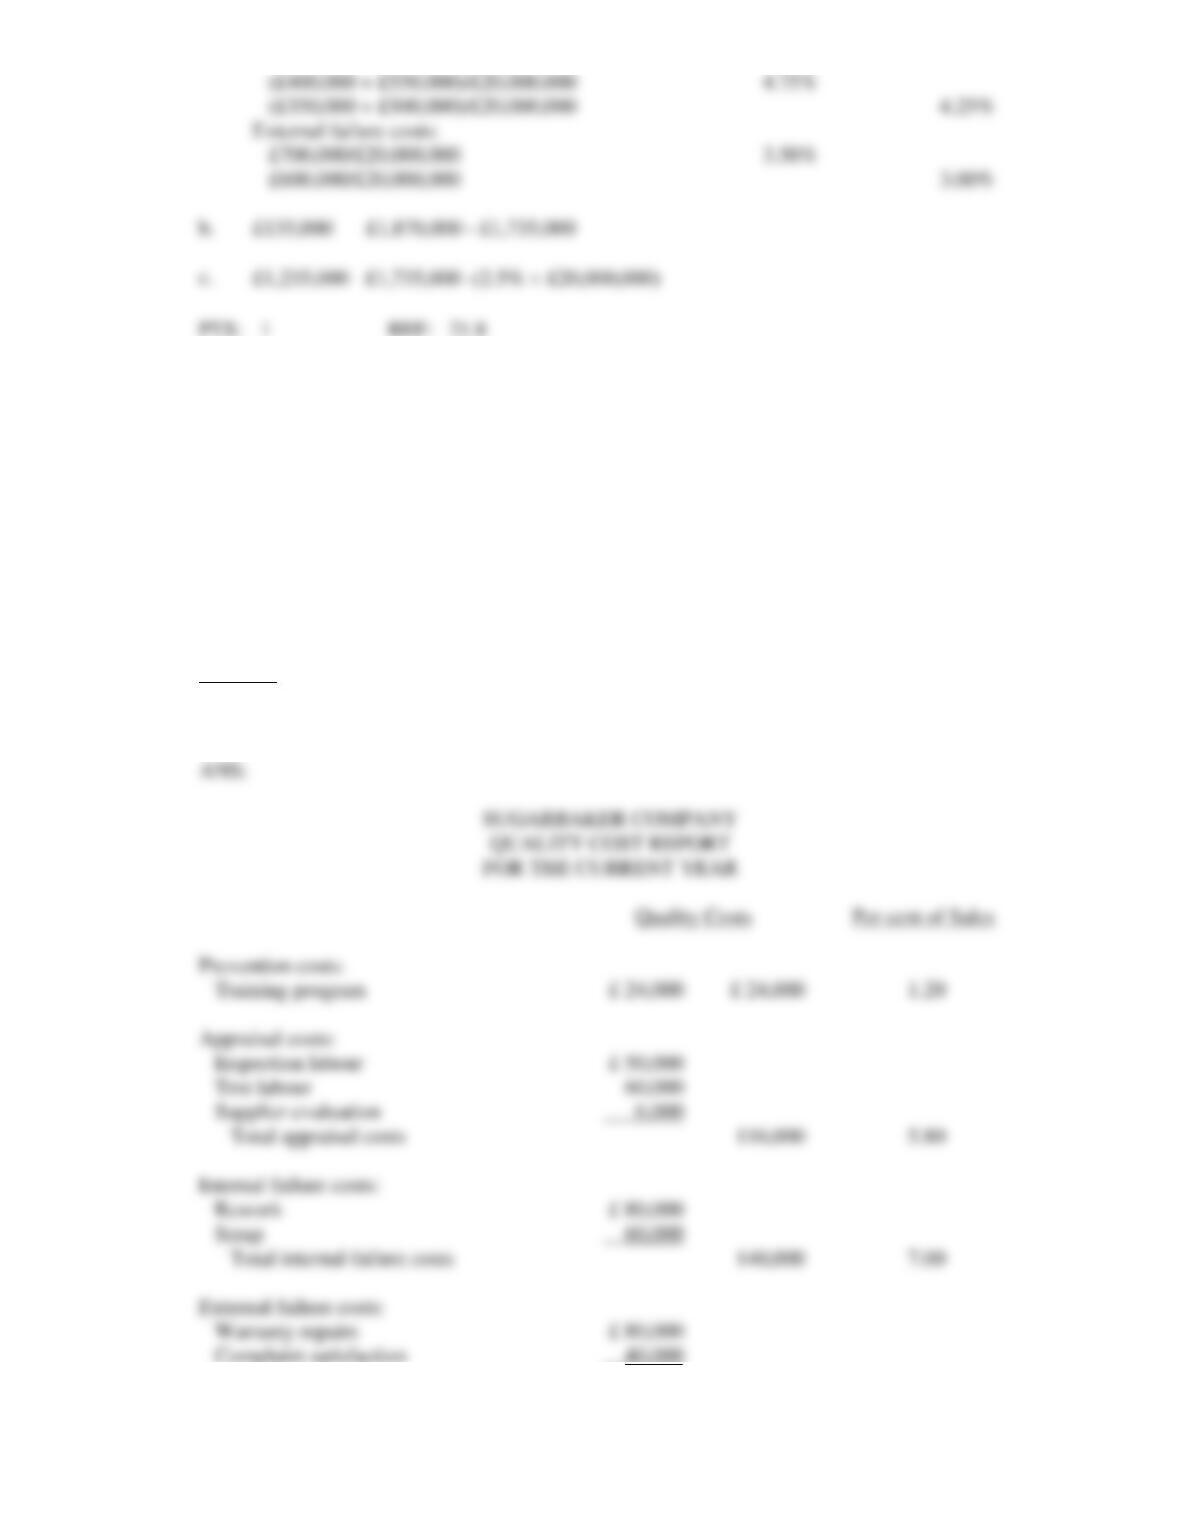
Prevention costs
Detection costs
Internal failure costs
External failure costs
b.
How much has profit increased as a result of the environmental cost reduction improvements?
16. At the beginning of the year, Sherwood Company initiated a quality improvement program. The
program was successful in reducing scrap and rework costs. To help assess the impact of the quality
improvement program, Sherwood’s managers collected the following data for the current and
preceding year:
Preceding Year
Current Year
Sales
£20,000,000
£20,000,000
Quality training
40,000
65,000
Scrap
400,000
350,000
Materials inspection
80,000
70,000
Rework
550,000
500,000
Product inspection
100,000
150,000
Product warranty
700,000
600,000
Required:
a.
Compute prevention costs, appraisal costs, internal failure costs, and external failure costs as a
percentage of sales for the preceding year and the current year.
b.
How much has profit increased as a result of quality improvements?
c.
If quality costs can be reduced even further to 2.5 per cent of sales, how much additional profit
would result?
Prevention costs:
£40,000/£20,000,000
£65,000/£20,000,000
Appraisal costs:
(£80,000 + £100,000)/£20,000,000
(£70,000 + £150,000)/£20,000,000
Prevention costs
Detection costs
Internal failure costs
b.
£44,000
£948,000 – £904,000
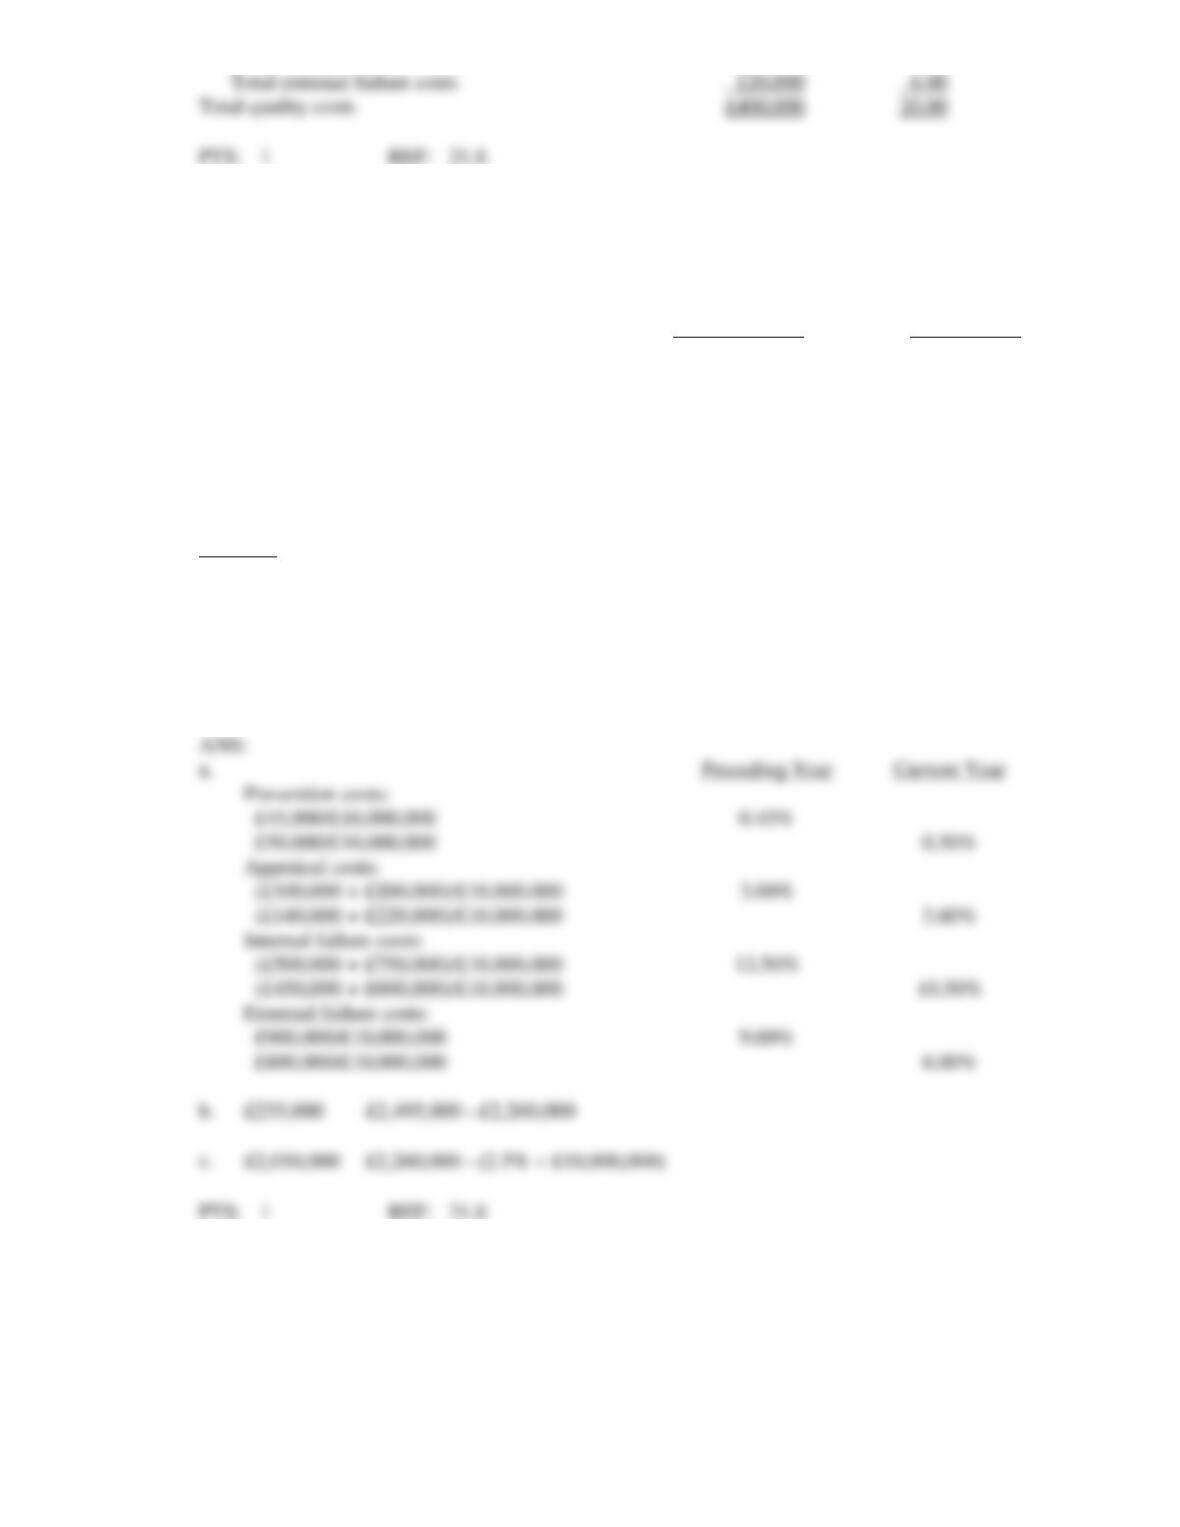
17. At the end of the current year, Sugarbaker Ltd.collected the following data about its quality program:
Sales (50,000 £40)
£2,000,000
Training program
24,000
Rework
80,000
Scrap
60,000
Warranty repairs
80,000
Complaints
40,000
Inspection labour
50,000
Test labour
60,000
Supplier evaluation
6,000
Required:
Prepare a quality cost report by quality cost category.
Prevention costs:
Training program
Appraisal costs:
Inspection labour
Test labour
Supplier evaluation
Total appraisal costs
Internal failure costs:
Rework
Scrap
Total internal failure costs
External failure costs:
Warranty repairs
(£400,000 + £550,000)/£20,000,000
(£350,000 + £500,000)/£20,000,000
External failure costs:
£700,000/£20,000,000
£600,000/£20,000,000
b.
£135,000 £1,870,000 – £1,735,000
£1,235,000 £1,735,000 -(2.5% £20,000,000)
18. At the beginning of the year, Bing Company initiated a quality improvement program. The program
was successful in reducing scrap and rework costs. To help assess the impact of the quality
improvement program, Bing’s managers collected the following data for the current and preceding
year:
Preceding Year
Current Year
Sales
£10,000,000
£10,000,000
Quality training
45,000
50,000
Materials inspection
100,000
140,000
Scrap
500,000
450,000
Product warranty
900,000
800,000
Rework
750,000
600,000
Product inspection
200,000
220,000
Required:
a.
Compute prevention costs, appraisal costs, internal failure costs, and external failure costs as a
percentage of sales for the preceding year and the current year.
b.
How much has profit increased as a result of quality improvements?
c.
If quality costs can be reduced even further to 2.5 per cent of sales, how much additional profit
would result?
Prevention costs:
£45,000/£10,000,000
£50,000/£10,000,000
Appraisal costs:
(£100,000 + £200,000)/£10,000,000
(£140,000 + £220,000)/£10,000,000
Internal failure costs:
(£500,000 + £750,000)/£10,000,000
(£450,000 + £600,000)/£10,000,000
External failure costs:
£900,000/£10,000,000
£800,000/£10,000,000
b.
£235,000 £2,495,000 – £2,260,000
£2,010,000 £2,260,000 – (2.5% £10,000,000)
19. Using the abbreviations listed below, indicate for each of the costs whether the cost should be
classified as:
P
=
Prevention
A
=
Appraisal
Total external failure costs
Total quality costs
I
=
Internal Failure
E
=
External Failure
N
=
None of the above
1.
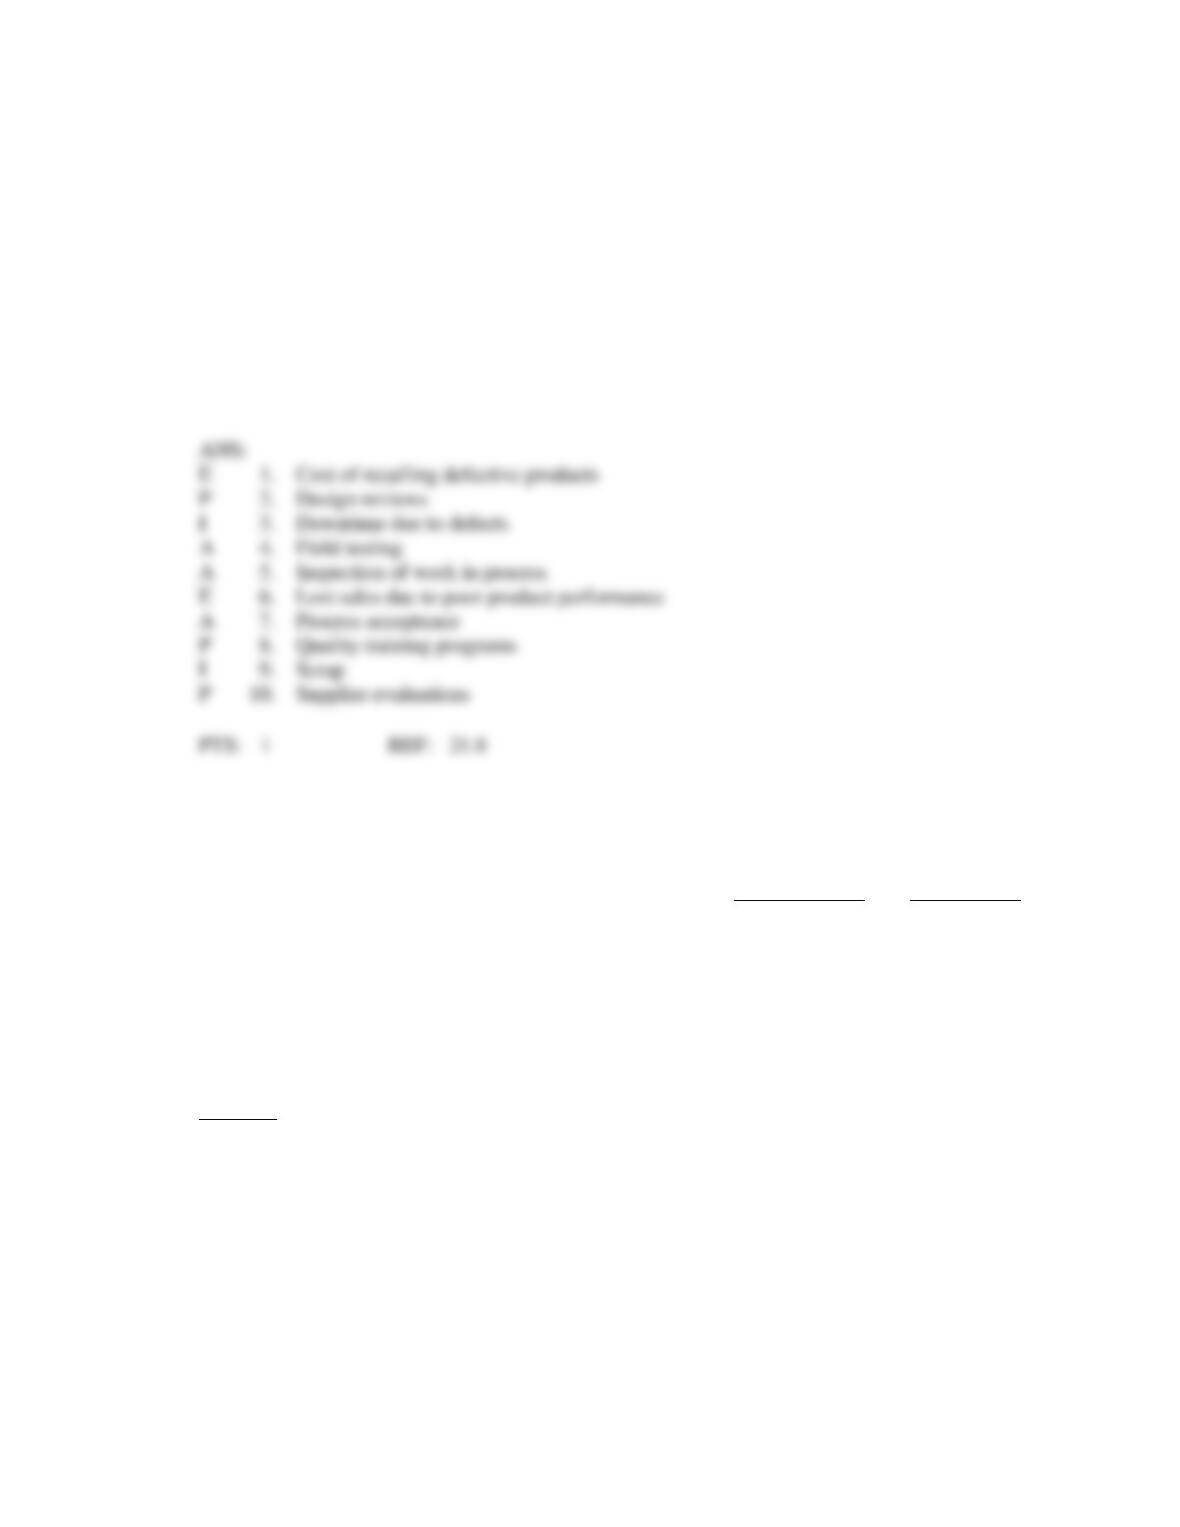
Cost of recalling defective products
2.
Design reviews
3.
Downtime due to defects
4.
Field testing
5.
Inspection of work in process
6.
Lost sales due to poor product performance
7.
Process acceptance
8.
Quality training programs
9.
Scrap
10.
Supplier evaluations
20. At the beginning of the year, Randy Company initiated a quality improvement program. The program
was successful in reducing scrap and rework costs. To help assess the impact of the quality
improvement program, the following data were collected for the current and preceding years:
Preceding Year
Current Year
Sales
£5,000,000
£5,000,000
Quality training
6,000
9,000
Material inspections
15,000
12,000
Scrap
80,000
60,000
Rework
15,000
12,000
Product inspection
25,000
30,000
Product warranty
150,000
120,000
Required:
a.
Compute each category of quality costs as a percentage of sales for each year.
Prevention costs
Appraisal costs
Internal failure costs
External failure costs
b.
How much has profit increased as a result of quality improvements?
c.
If quality costs can be reduced to 2.5 per cent of sales, how much additional profit would
result?
P
2.
Design reviews
I
3.
Downtime due to defects
A
4.
Field testing
A
5.
Inspection of work in process
E
6.
Lost sales due to poor product performance
A
7.
Process acceptance
P
8.
Quality training programs
I
9.
Scrap
P
10.
Supplier evaluations
21. At the beginning of the year, Ball Company initiated a quality improvement program. The program
was successful in reducing scrap and rework costs. To help assess the impact of the quality
improvement program, the following data were collected for the current and preceding years:
Preceding Year
Current Year
Sales
£5,000,000
£5,000,000
Quality training
22,500
25,000
Material inspections
50,000
80,000
Scrap
250,000
225,000
Product warranty
450,000
400,000
Rework
375,000
300,000
Product inspection
100,000
100,000
Required:
a.
Compute each category of quality costs as a percentage of sales for each year.
Prevention costs
Appraisal costs
Internal failure costs
External failure costs
b.
How much has profit increased as a result of quality improvements?
c.
If quality costs can be reduced to 2.5 per cent of sales, how much additional profit would
result?
Prevention costs
Appraisal costs
Internal failure costs
External failure costs
b.
£117,500 £1,247,500 – £1,130,000
£1,005,000 £1,130,000 – (2.5% £5,000,000)
a.
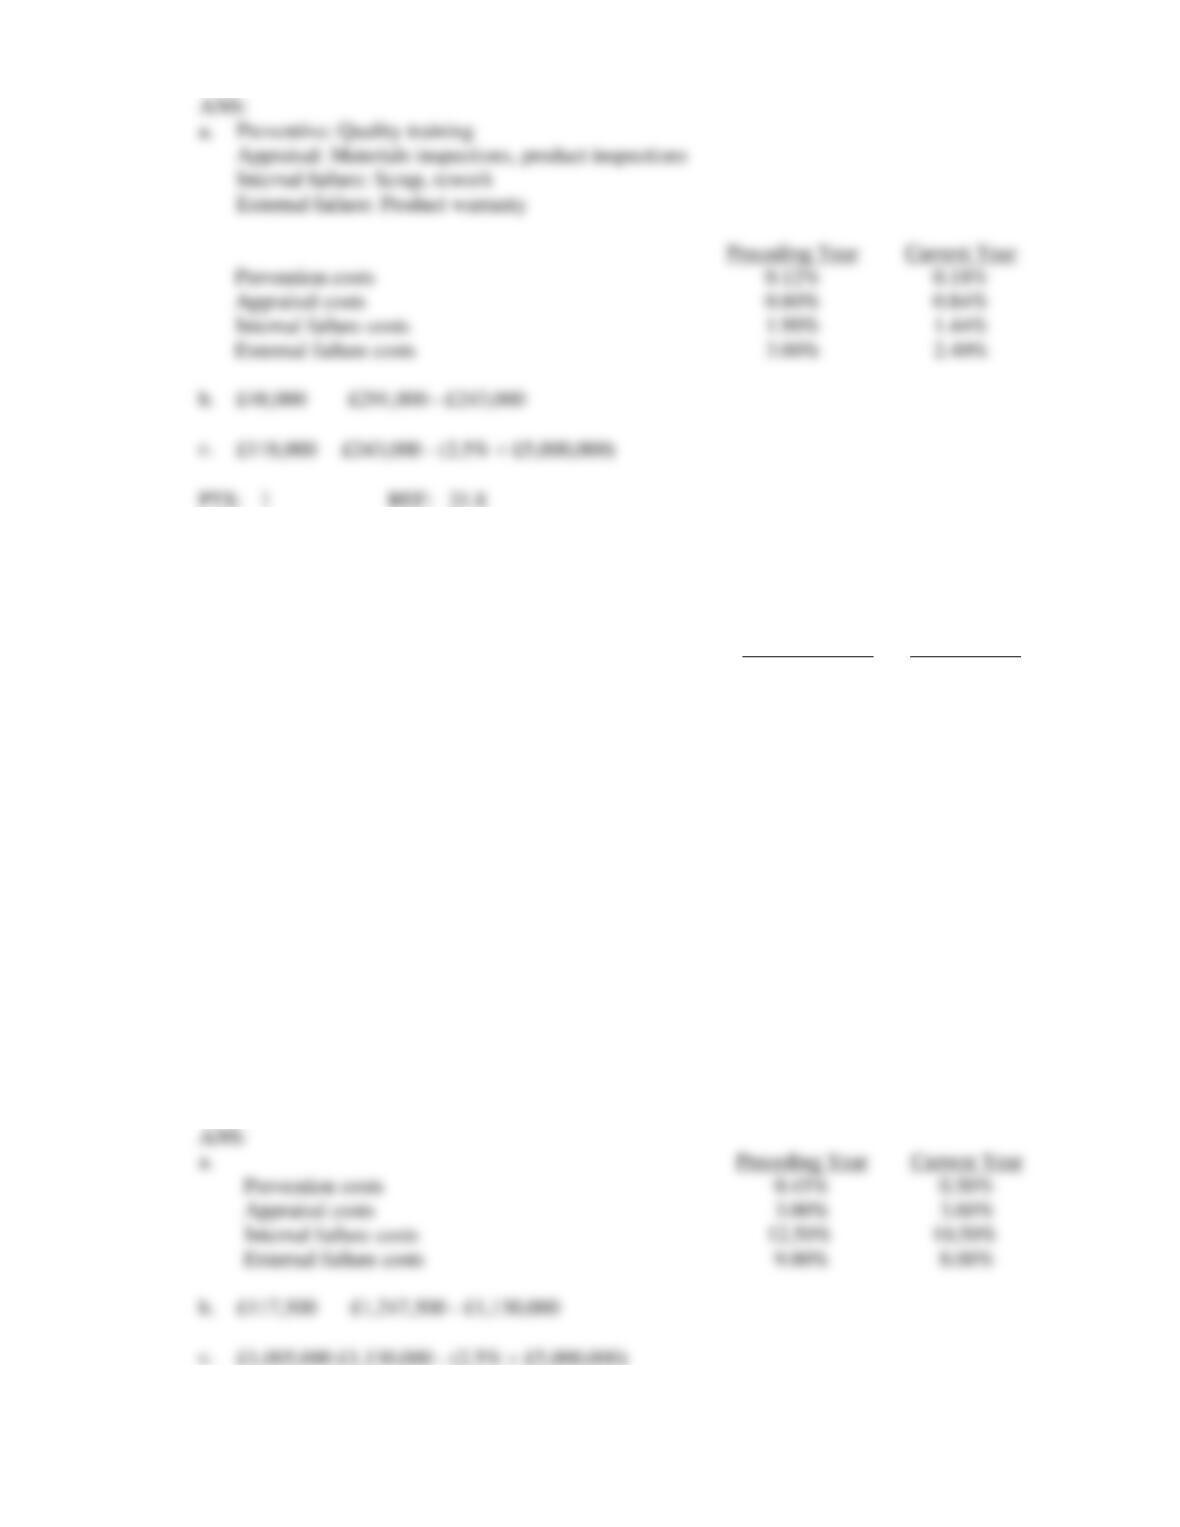
Preventive: Quality training
Appraisal: Materials inspections, product inspections
Internal failure: Scrap, rework
External failure: Product warranty
Prevention costs
Appraisal costs
Internal failure costs
External failure costs
b.
£48,000 £291,000 – £243,000
£118,000 £243,000 – (2.5% £5,000,000)
22. In 2006, Style, SA., instituted a quality improvement program. At the end of 2007, the management of
the company requested a report to show the amount saved by the measures taken during the year. The
actual sales and actual quality costs for 2006 and 2007 are as follows:
2006
2007
Sales
£125,000
£150,000
Scrap
3,750
3,750
Rework
5,000
2,500
Training program
1,250
1,500
Consumer complaints
2,500
1,250
Lost sales, incorrect labeling
2,000
—
Test labour
3,000
2,000
Inspection labour
6,250
6,000
Supplier evaluation
3,750
3,250
Required:
a.
Classify each cost as variable or fixed with respect to sales and compute the variable cost
ratio. Be careful-costs may change because of quality improvement, not cost behaviour.
b.
How much did profits increase because of quality improvements made in 2007, assuming all
reductions in quality costs are attributable to quality improvements?
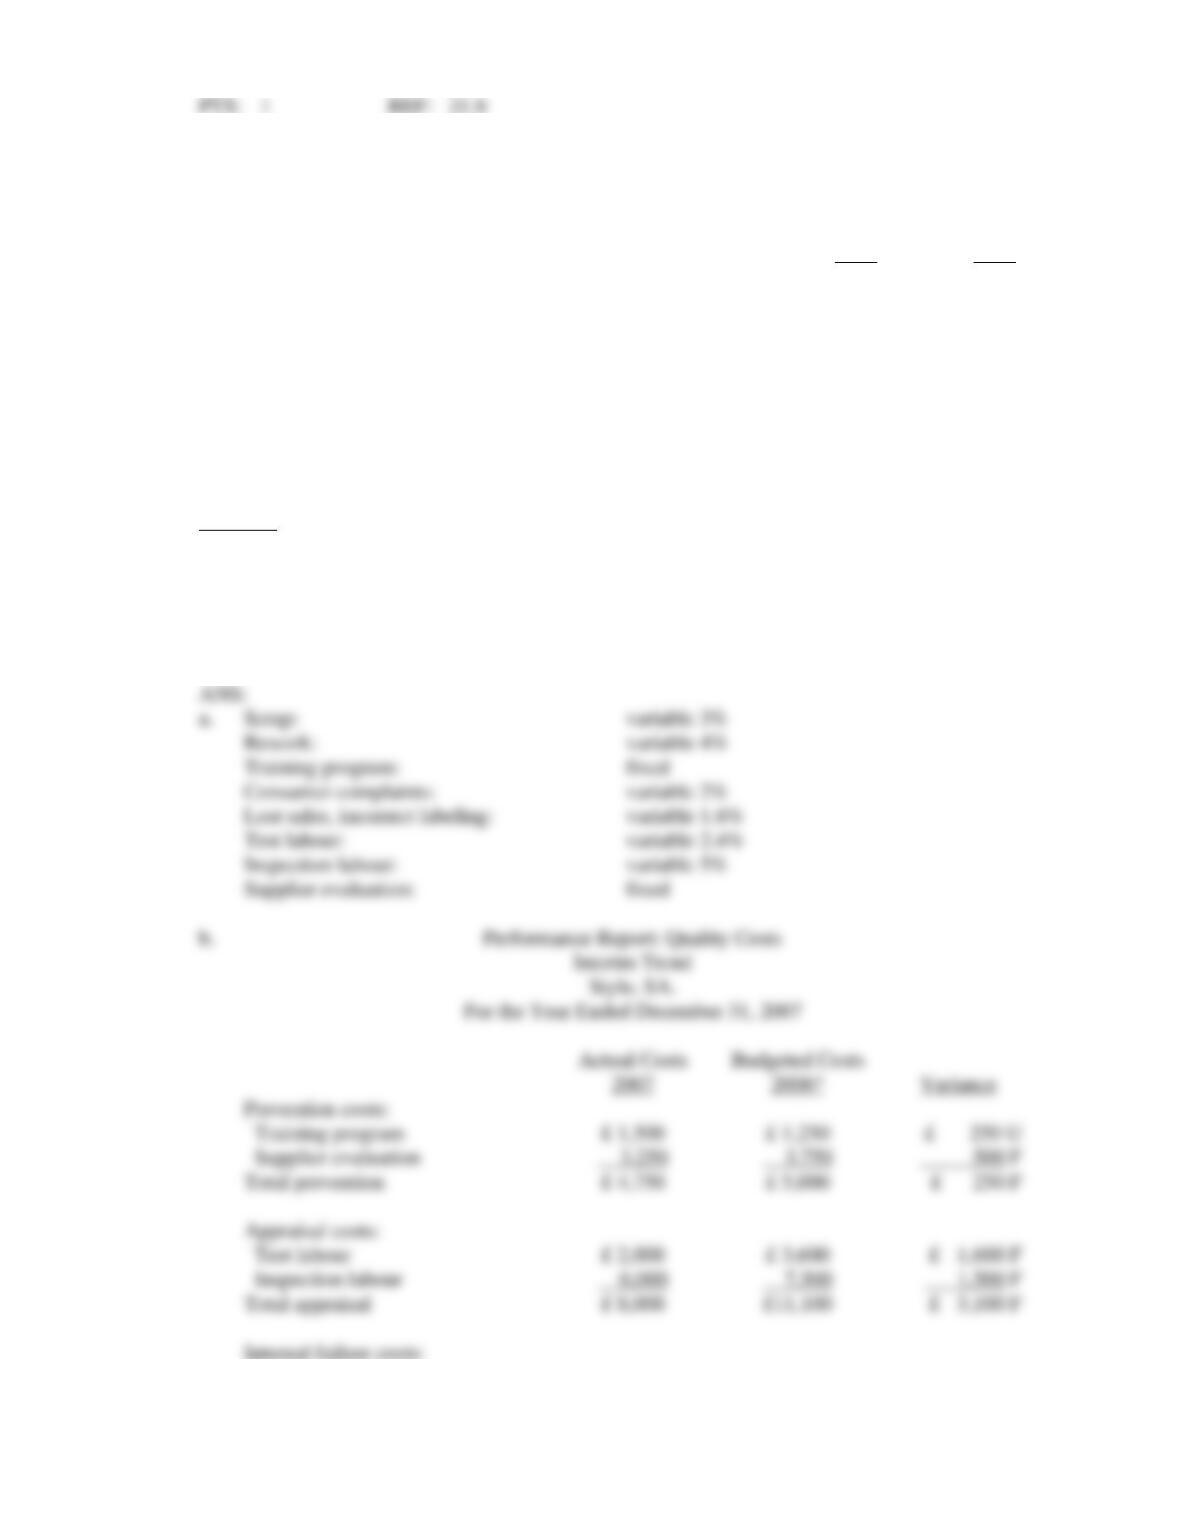
Scrap:
variable 3%
Rework:
variable 4%
Training program:
fixed
Consumer complaints:
variable 2%
Lost sales, incorrect labeling:
variable 1.6%
Test labour:
variable 2.4%
Inspection labour:
variable 5%
Supplier evaluation:
fixed
Prevention costs:
Training program
Supplier evaluation
Total prevention
Appraisal costs:
Test labour
Inspection labour
Total appraisal
Internal failure costs:
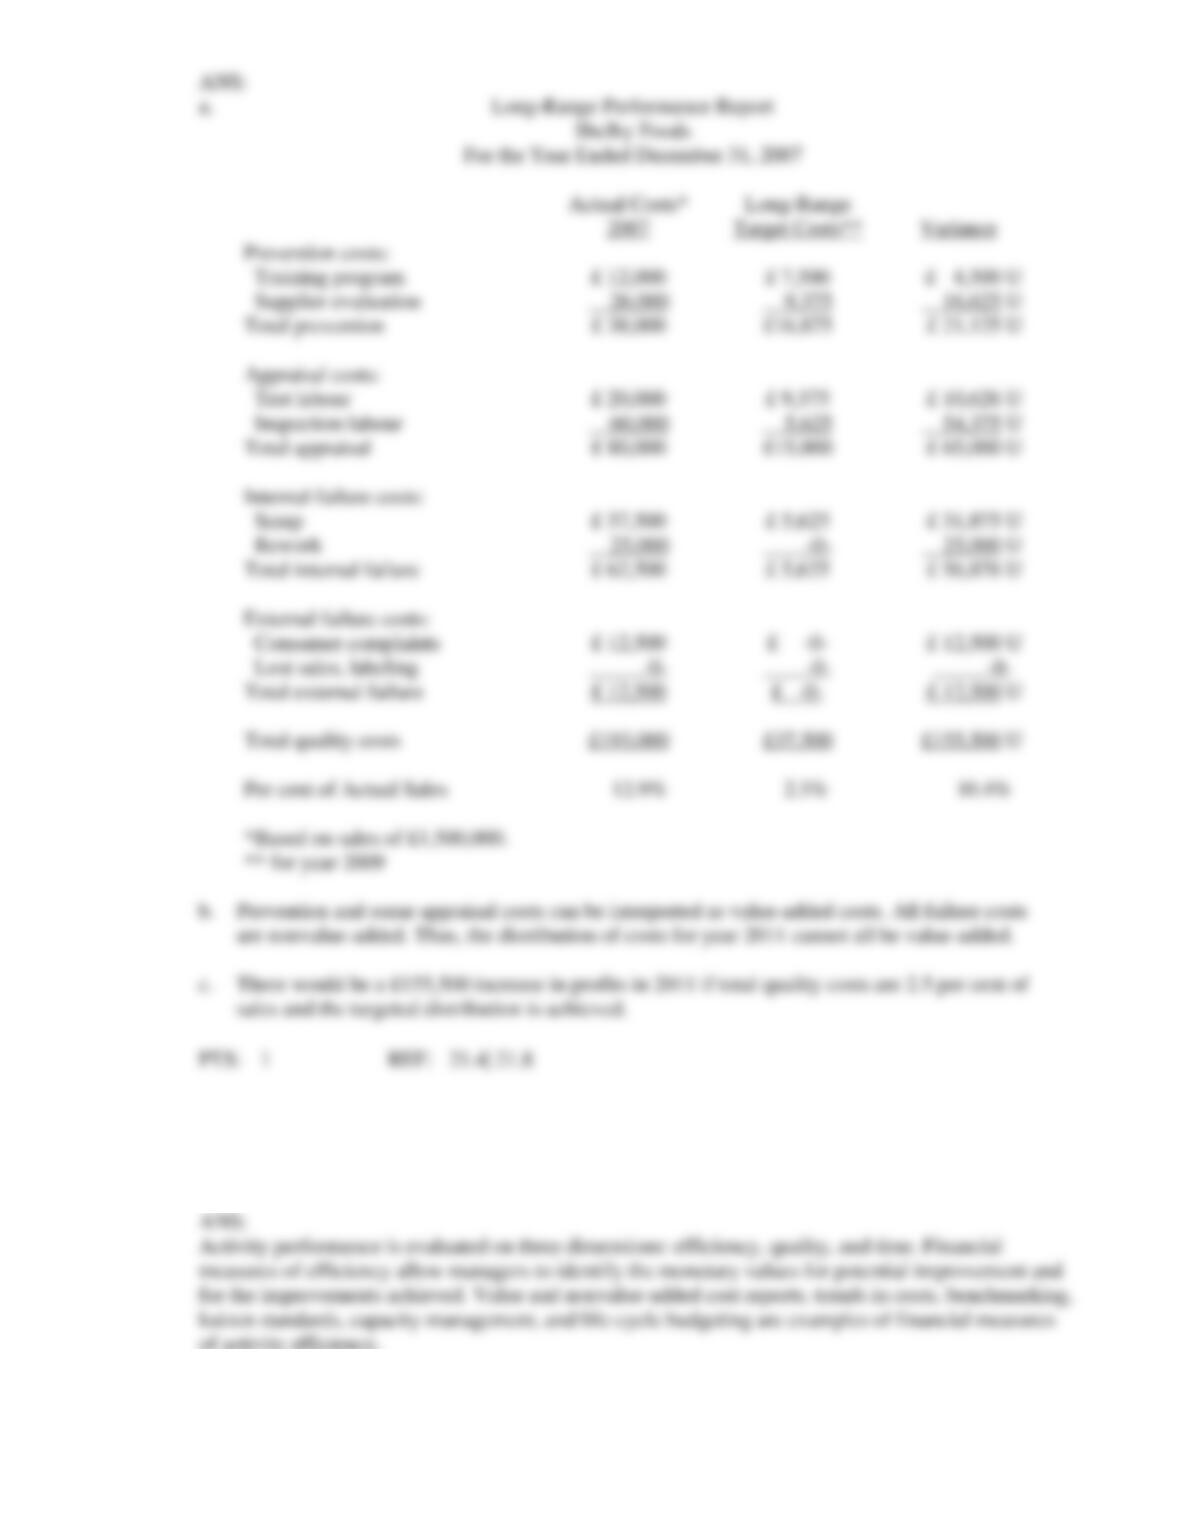
23. In 2006, Shelby Foods instituted a quality improvement program. At the end of 2007, the management
of the company requested a report to show the amount saved by the measures taken during the year.
The actual sales and actual quality costs for 2006 and 2007 are as follows:
2006
2007
Sales
£1,000,000
£1,200,000
Scrap
30,000
30,000
Rework
40,000
20,000
Training program
10,000
12,000
Consumer complaints
20,000
10,000
Lost sales, incorrect labeling
16,000
—
Test labour
24,000
16,000
Inspection labour
50,000
48,000
Supplier evaluation
30,000
26,000
Shelby’s management believes that quality costs can be reduced to 2.5 per cent of sales within the next
five years. At the end of Year 2011, Shelby’s sales are projected to have grown to £1,500,000. The
relative distribution of quality costs at the end of Year 2011 is as follows:
Scrap
15%
Training
20%
Supplier evaluation
25%
Test labour
25%
Inspection
_15%
Total quality costs
100%
Required:
a.
Prepare a long-range performance report that compares the quality costs incurred at the end of
2006 with the quality-cost structure expected at the end of 2011.
b.
Are the targeted costs in Year 2011 all value-added costs?
c.
What would be the increase in profits in 2011 if the 2.5 per cent performance standard is met
in that year?
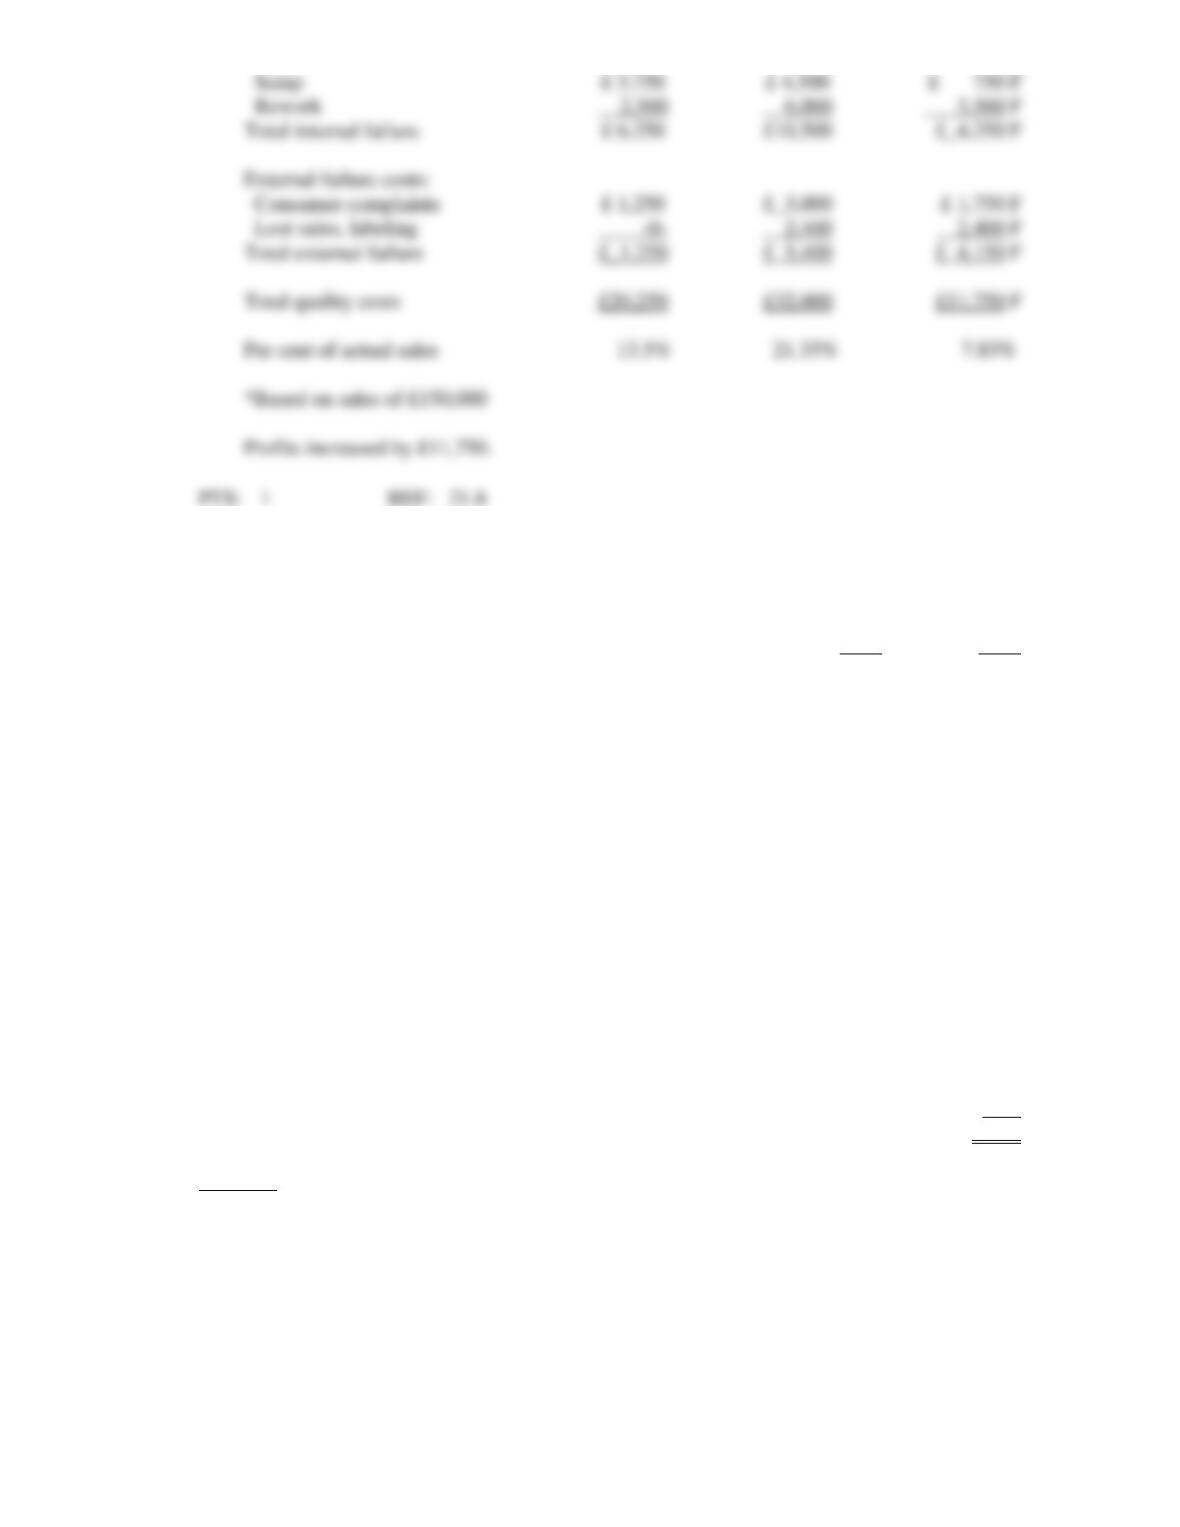
Scrap
Rework
Total internal failure
External failure costs:
Consumer complaints
Lost sales, labeling
Total external failure
Total quality costs
Per cent of actual sales
*Based on sales of £150,000
Profits increased by £11,750.
ESSAY
1. Describe activity-based performance measurement.