Unlock document.
This document is partially blurred.
Unlock all pages and 1 million more documents.
Get Access
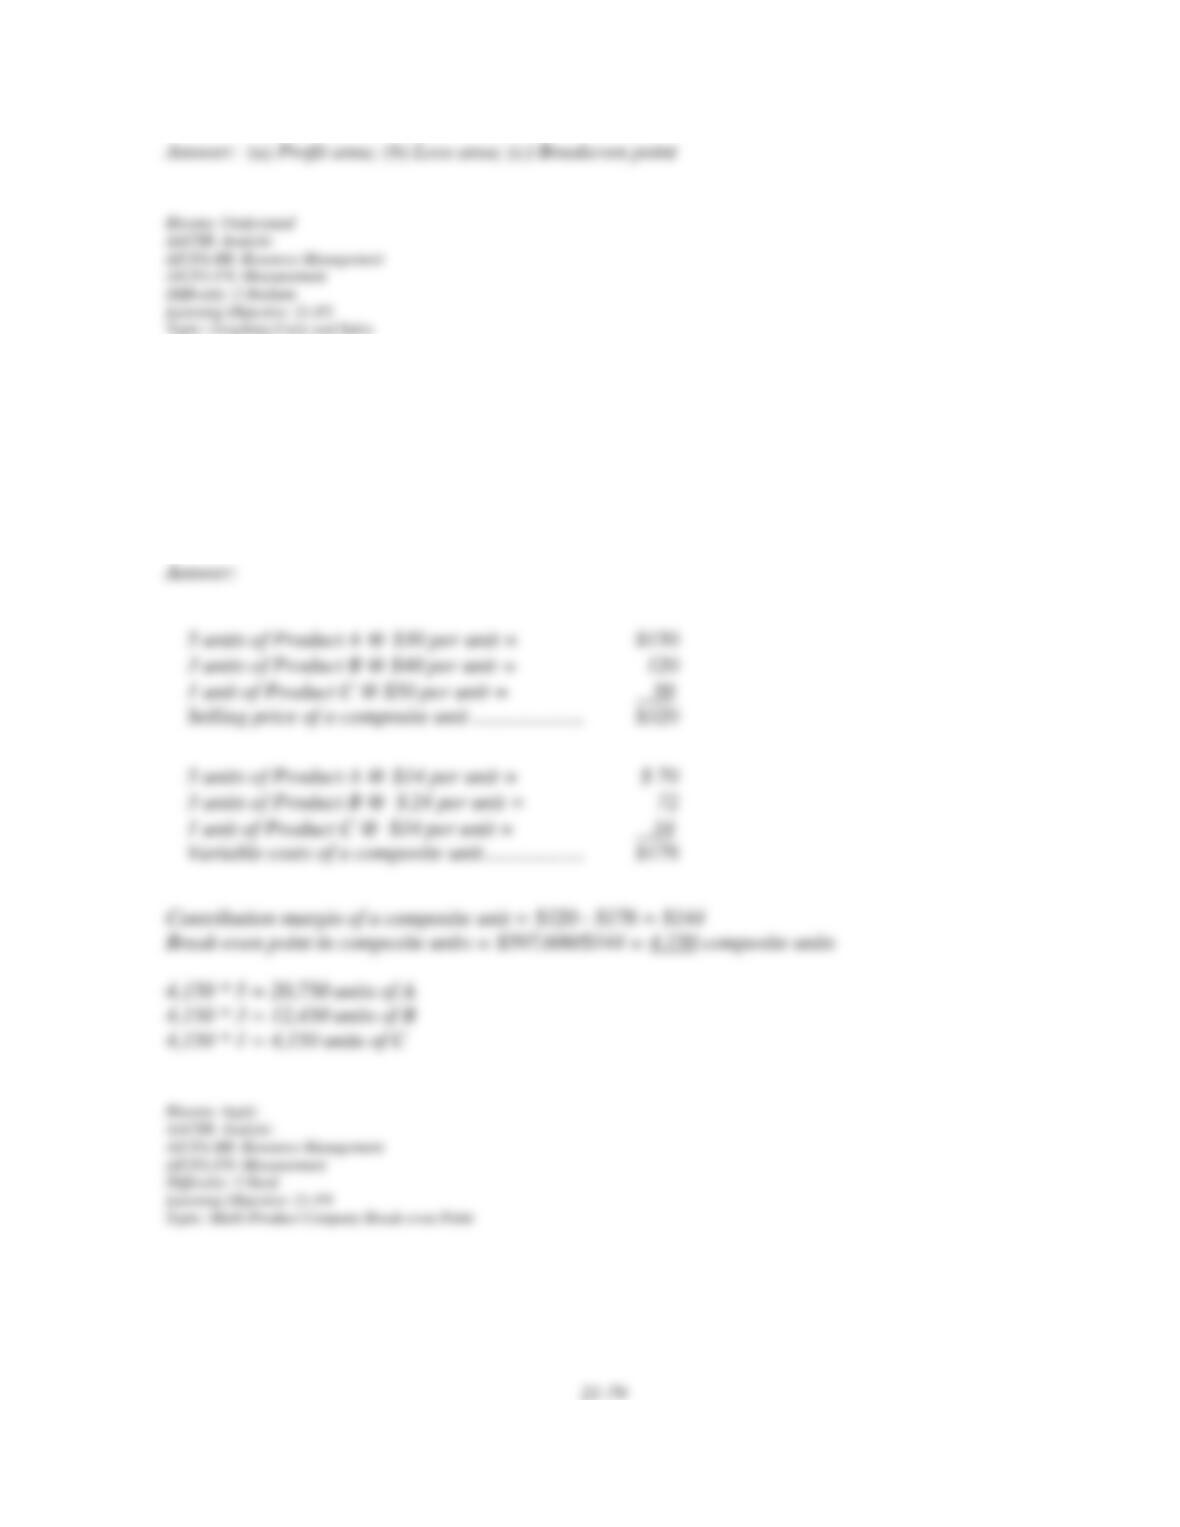
168. The sales mix of Palm Company is 5 units of A, 3 units of B, and 1 unit of C. Per unit
sales prices for each product are $30, $40, and $50, respectively. Variable costs per unit are
$14, $24, and $34, respectively. Fixed costs are $597,600. What is the break-even point in
composite units and in units of A, B, and C?
21-80
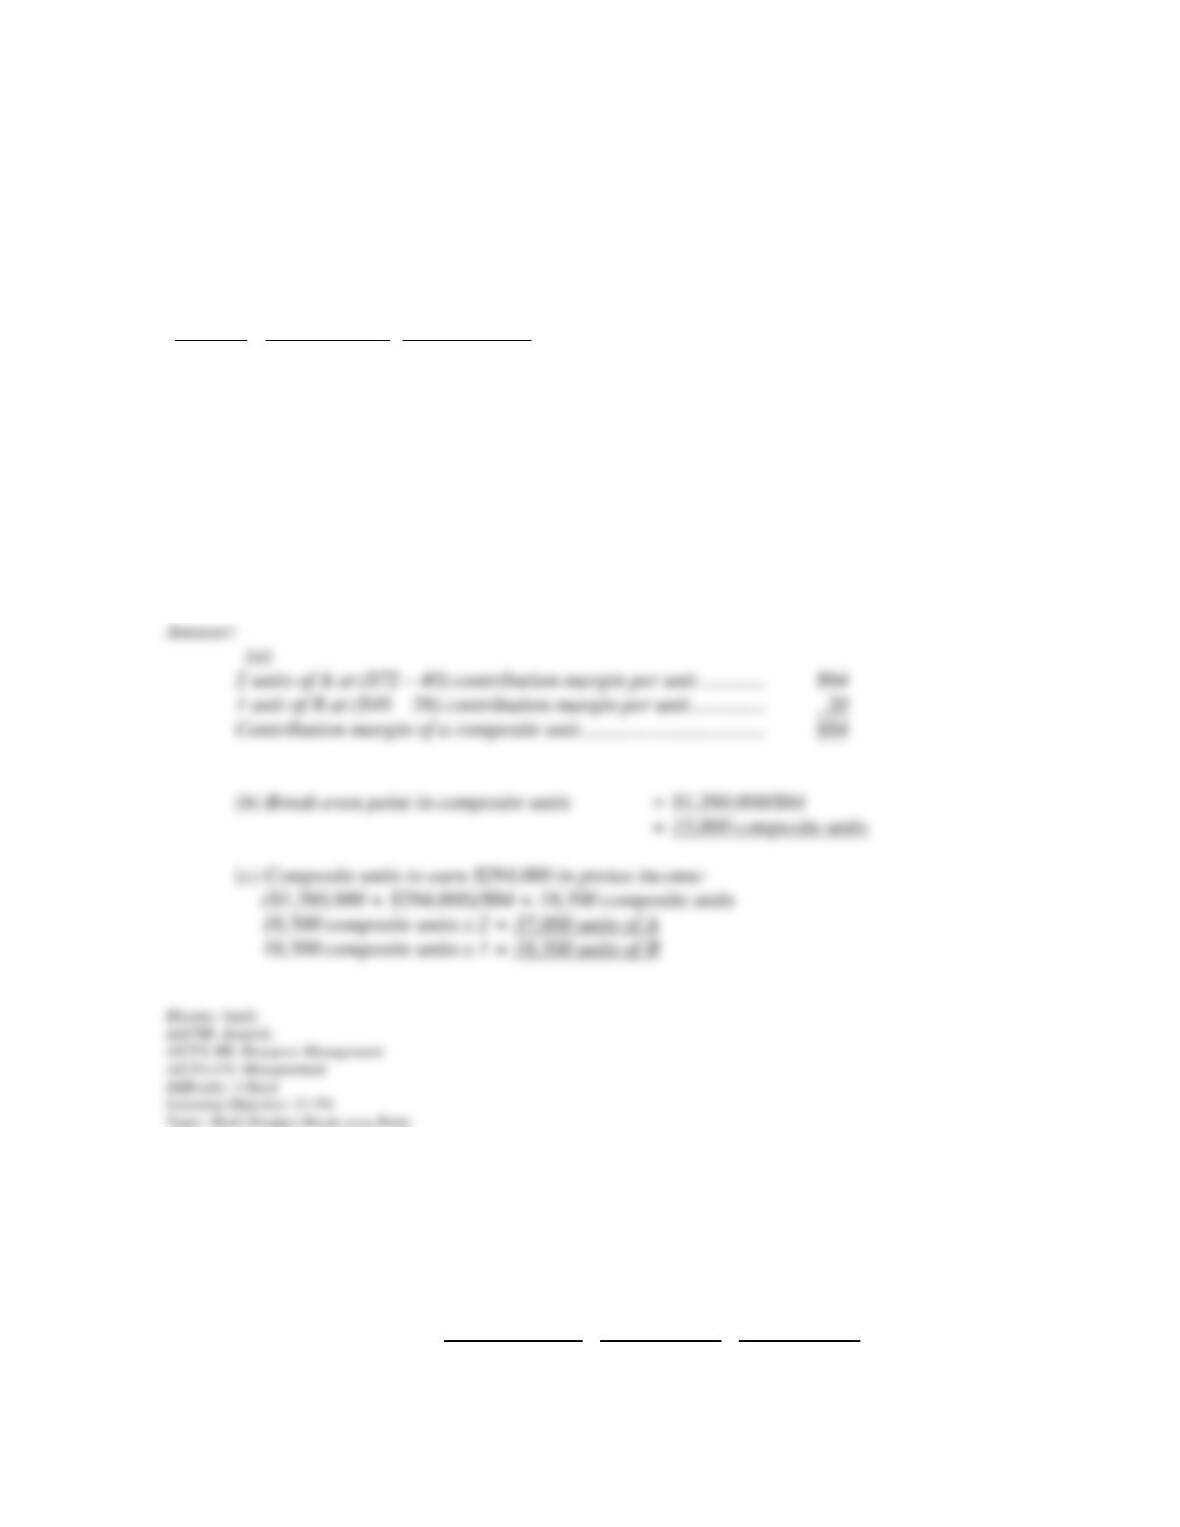
169. A firm sells two different products, A and B. For each unit of B, the firm sells two units
of A. Total fixed costs for this firm are $1,260,000. Additional selling prices and cost
information for both products follow:
Product
Selling
Price per unit
Variable
Costs per unit
A…….
$72
$40
B…….
48
28
Required:
(a) Calculate the contribution margin per composite unit.
(b) Calculate the break-even point in units of each individual product.
(c) If pretax income before taxes of $294,000 is desired, how many units of A and B must be
sold?
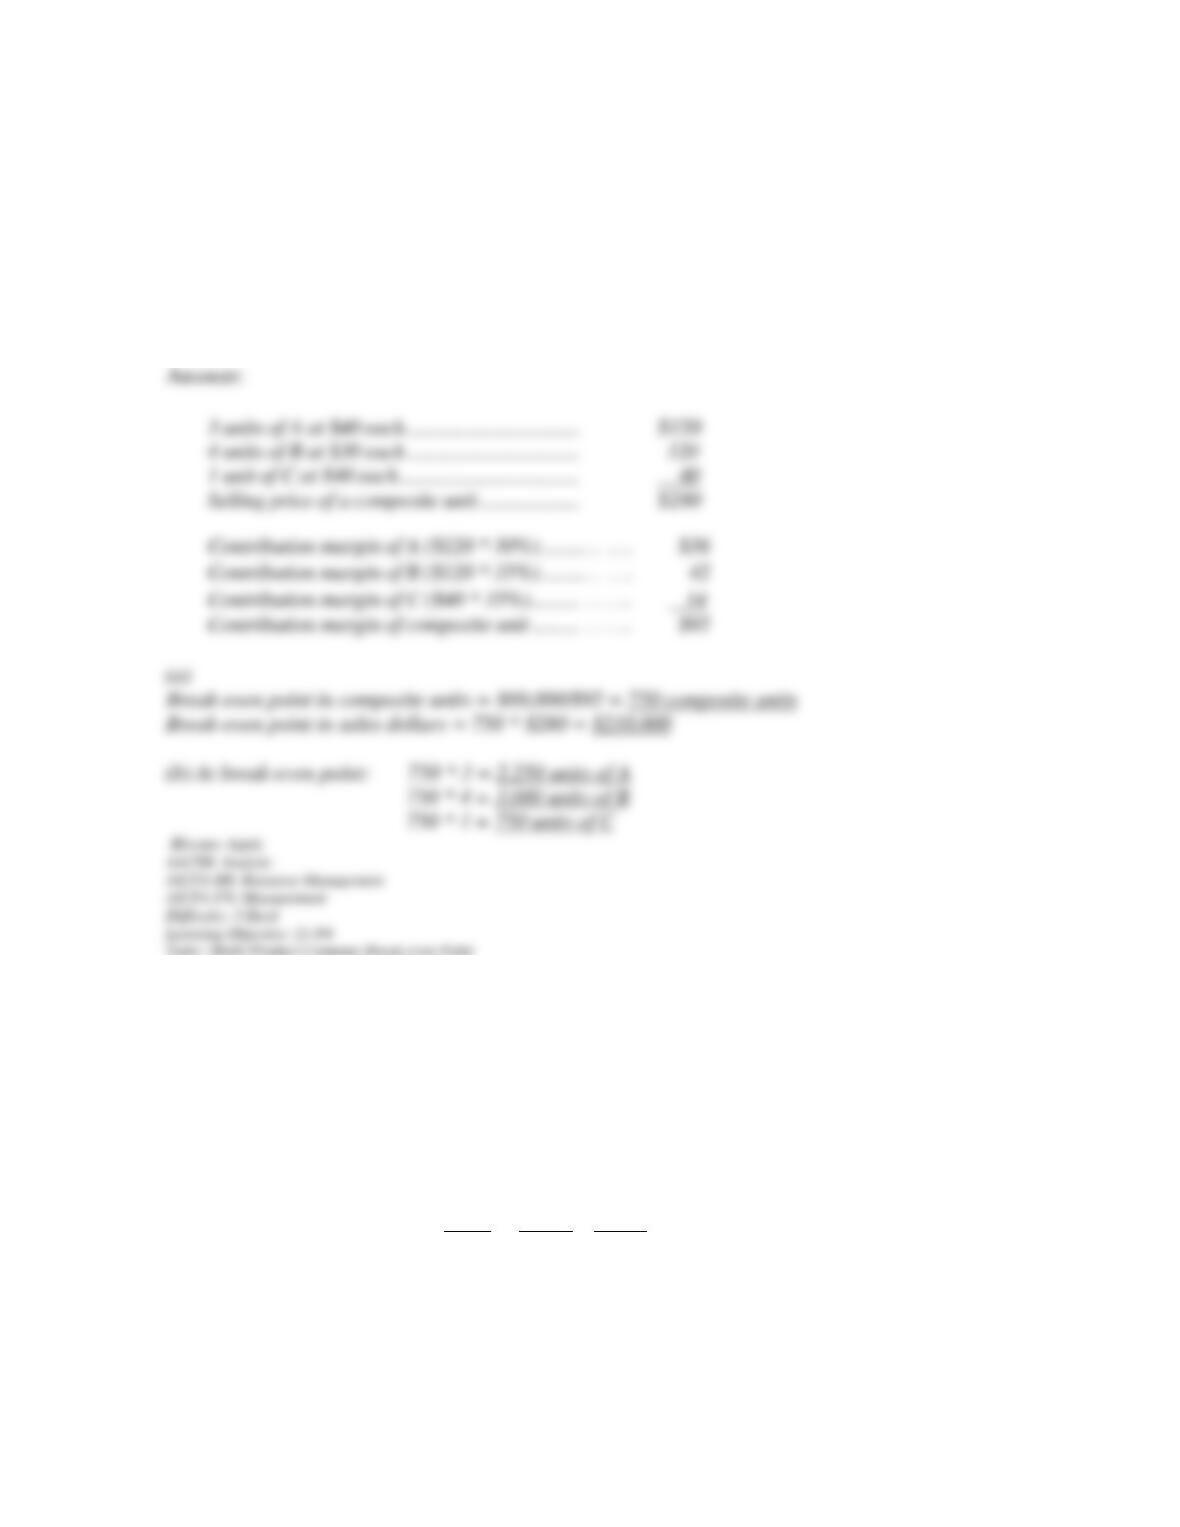
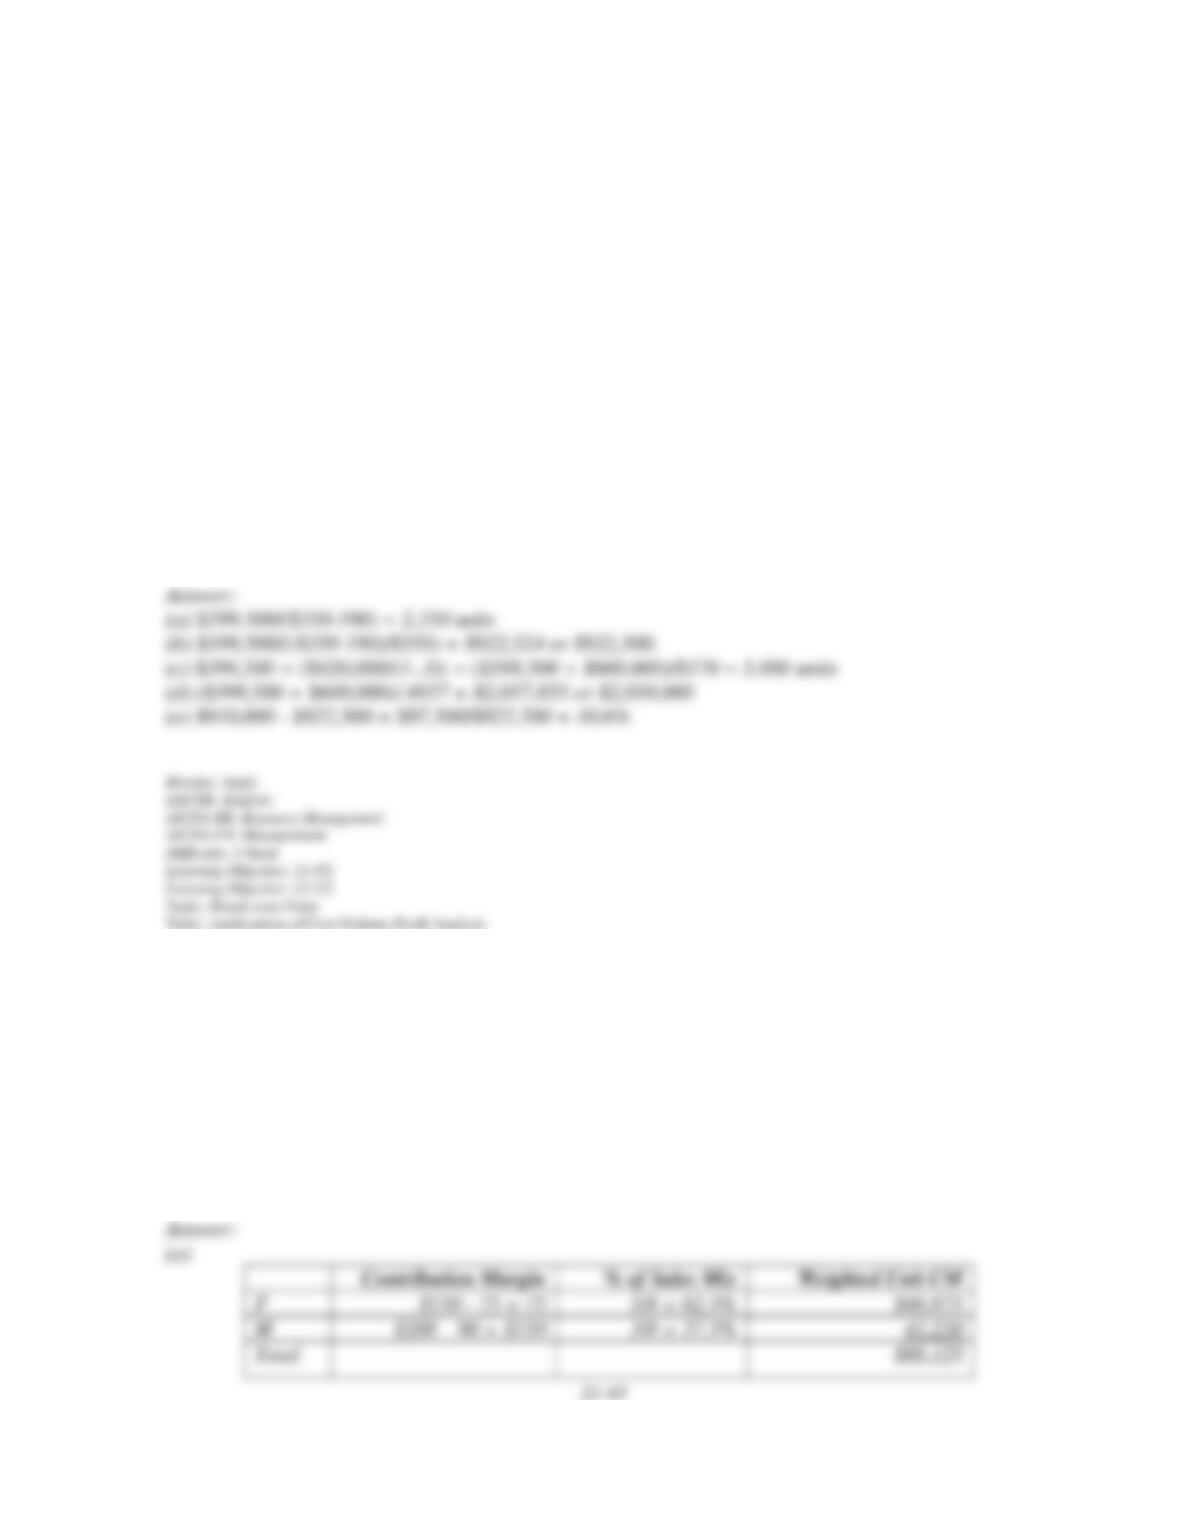
170. Joseph Co. has three products A, B, and C, and its fixed costs are $69,000. The sales mix
for its products are 3 units of A, 4 units of B, and 1 unit of C. Information about the three
products follows:
A B C
21-81
Projected sales in dollars…..
$192,000
$192,000
$64,000
Selling price per unit……….
$40
$30
$40
Contribution margin ratio…...
30%
35%
35%
(a) Calculate the company's break-even point in composite units and sales dollars.
(b) Calculate the number of units of each individual product to be sold at the break-even
point.
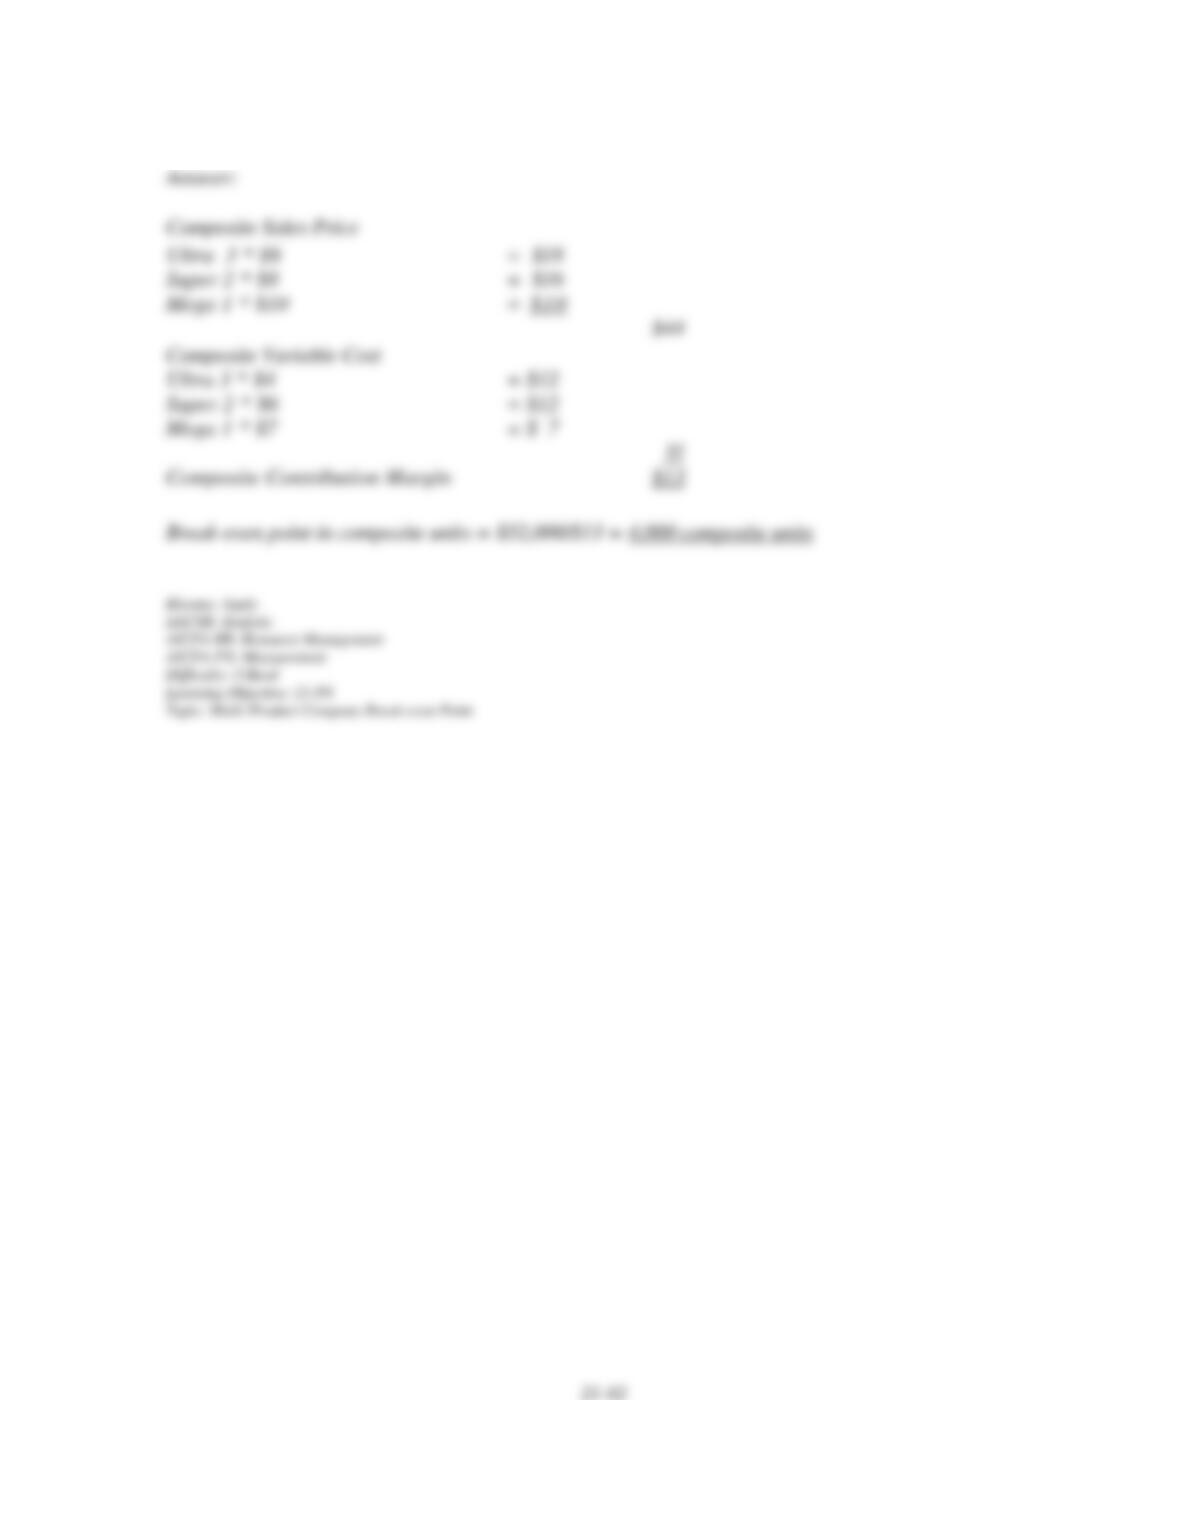
171. Thomas Co. produces and sells Ultra, Super, and Mega, and has total fixed costs of
$52,000. Sales and cost data follow:
Ultra Super Mega
Sales price per unit……….. $6 $8 $10
Variable costs per unit…… 4 6 7
Sales mix……………..….. 3 2 1
Calculate the break-even point in composite units.
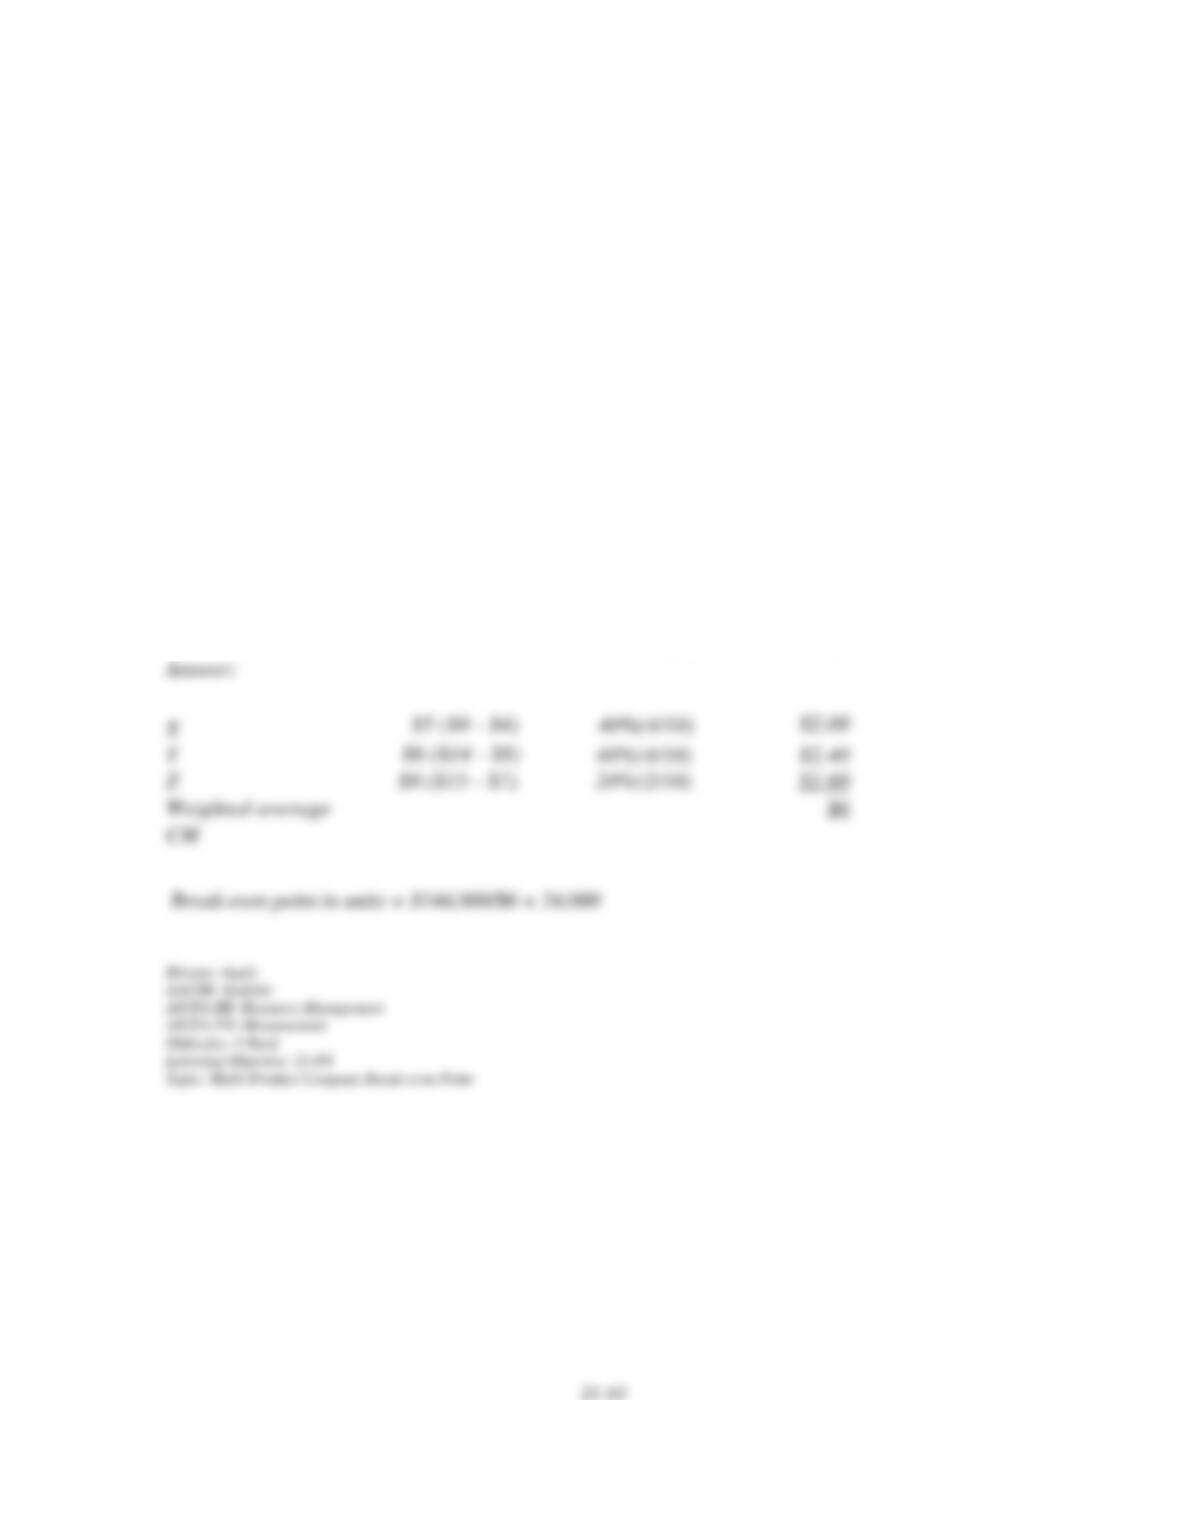
172. Browning Company sells a mix of three related products. Total fixed costs are $144,000.
The following additional information is available for Browning Company.
Sales Mix Variable Sales
Cost/Unit Price/Unit
X
4
$5
$9
Y
4
$8
$14
Z
2
$7
$15
Use the weighted average method to determine the company's break-even point for composite
units.
Cont Margin
per Unit
Percentage
of Sales
Mix
Weighted
Average
CM
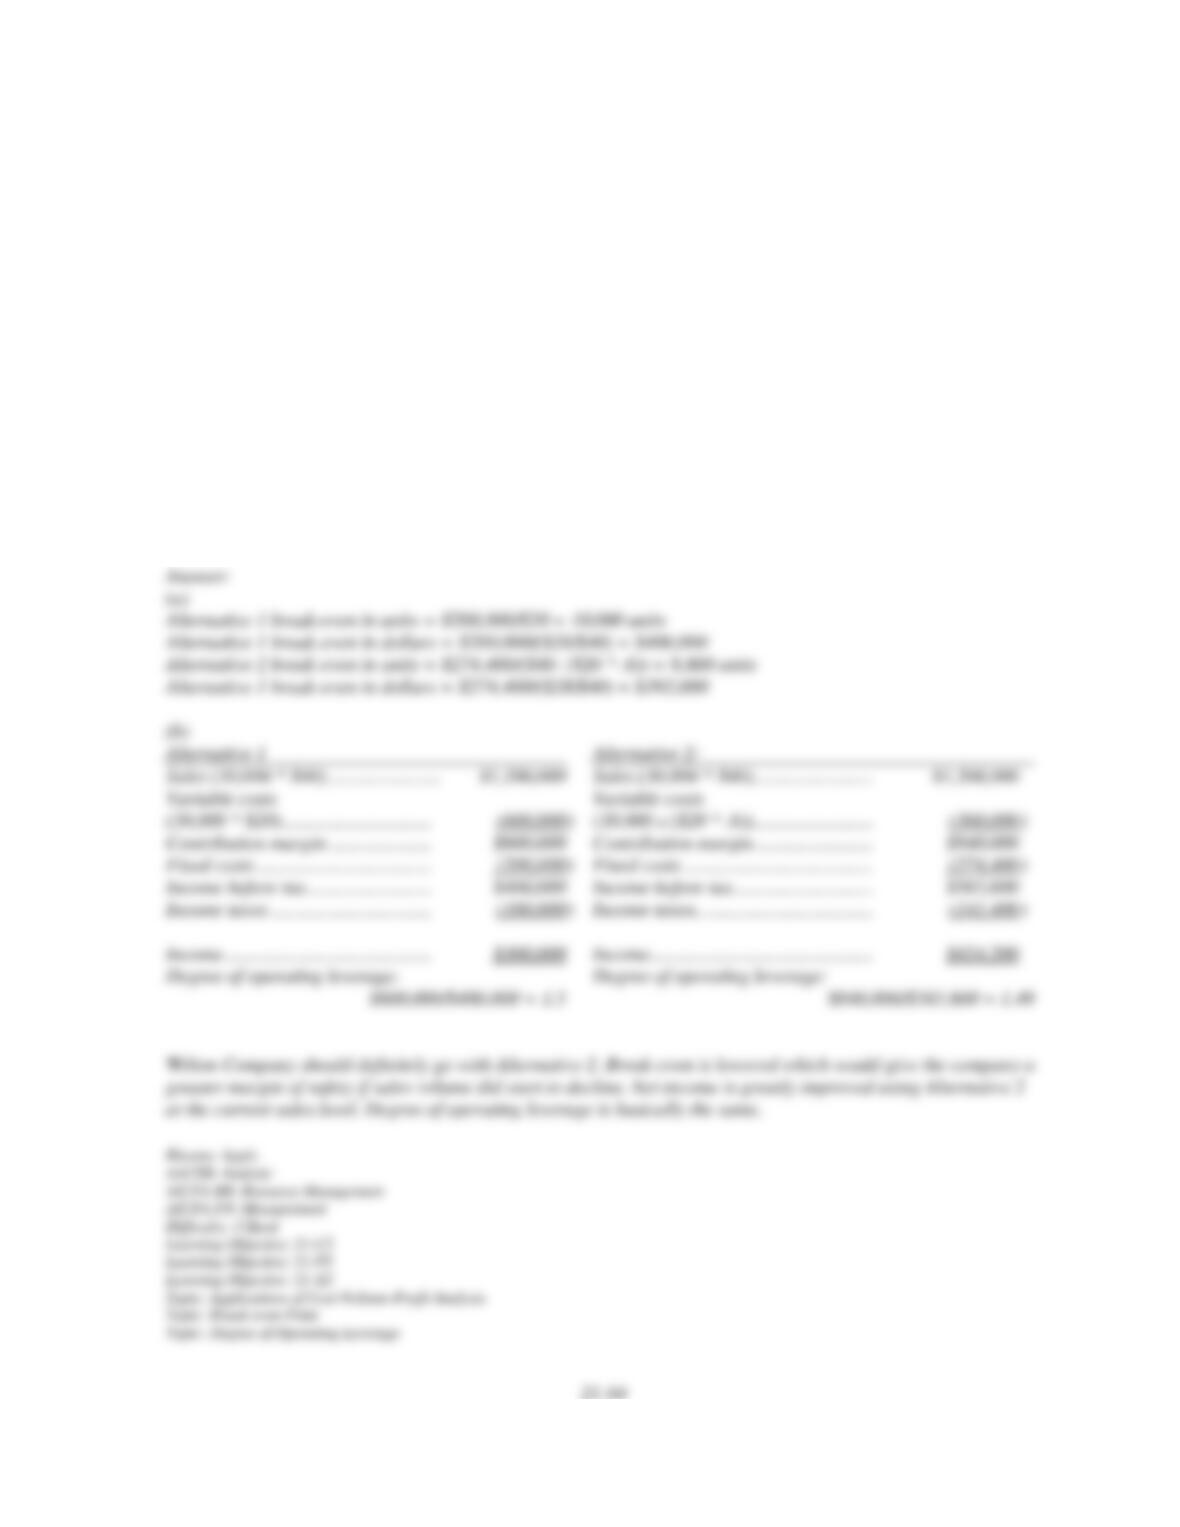
173. Wilton Company is analyzing two alternative methods of producing its product. The
production manager indicates that variable costs can be reduced 40% by installing a machine
that automates production, but fixed costs would increase. Alternative 1 shows costs before
installing the machine; Alternative 2 shows costs after the machine is installed. (a) Compute
the break-even point in units and dollars for both alternatives. (b) Prepare a forecasted income
statement for both alternatives assuming that 30,000 units will be sold. The statements should
report sales, total variable costs, contribution margin, fixed costs, income before taxes,
income taxes, and net income. Below the income statement, compute the degree of operating
leverage. Which alternative would you recommend and why?
Alternative 1
Alternative 2
Variable costs per unit .........
$20
?
Fixed costs ...........................
$200,000
$274,400
Selling price per unit ...........
$40
$40
Income tax rate ....................
25%
25%
174. Spruce Company is considering the production and sale of a new product with the
following sales and cost data: unit sales price, $350; unit variable costs, $180; total fixed
costs, $399,500; and projected sales, $910,000. Round your answers to the nearest whole unit
or dollar.
(a) Calculate break-even in units.
(b) Calculate break-even in dollars (use four decimal places when calculating the contribution
margin ratio).
(c) Calculate number of units that would need to be sold to generate an after-tax profit of
$420,000 assuming a 30% tax rate.
(d) Calculate dollar sales that would be needed to generate the same profit as above.
(e) Calculate the margin of safety stated as a percentage using the $910,000 projected sales
level.
Be sure to label each calculation and show all calculations.
175. Magee Windows manufactures two standard size windows, F and M, in the ratio of 5:3.
F has a selling price of $150 and M has a selling price of $200. The variable cost of F is
$75.00 and the variable cost of M is $90.00. Fixed costs are $352,500. Compute the (a)
weighted average contribution margin, (b) break-even point in units, (c) number of units of
each product that will be sold at the break-even point.
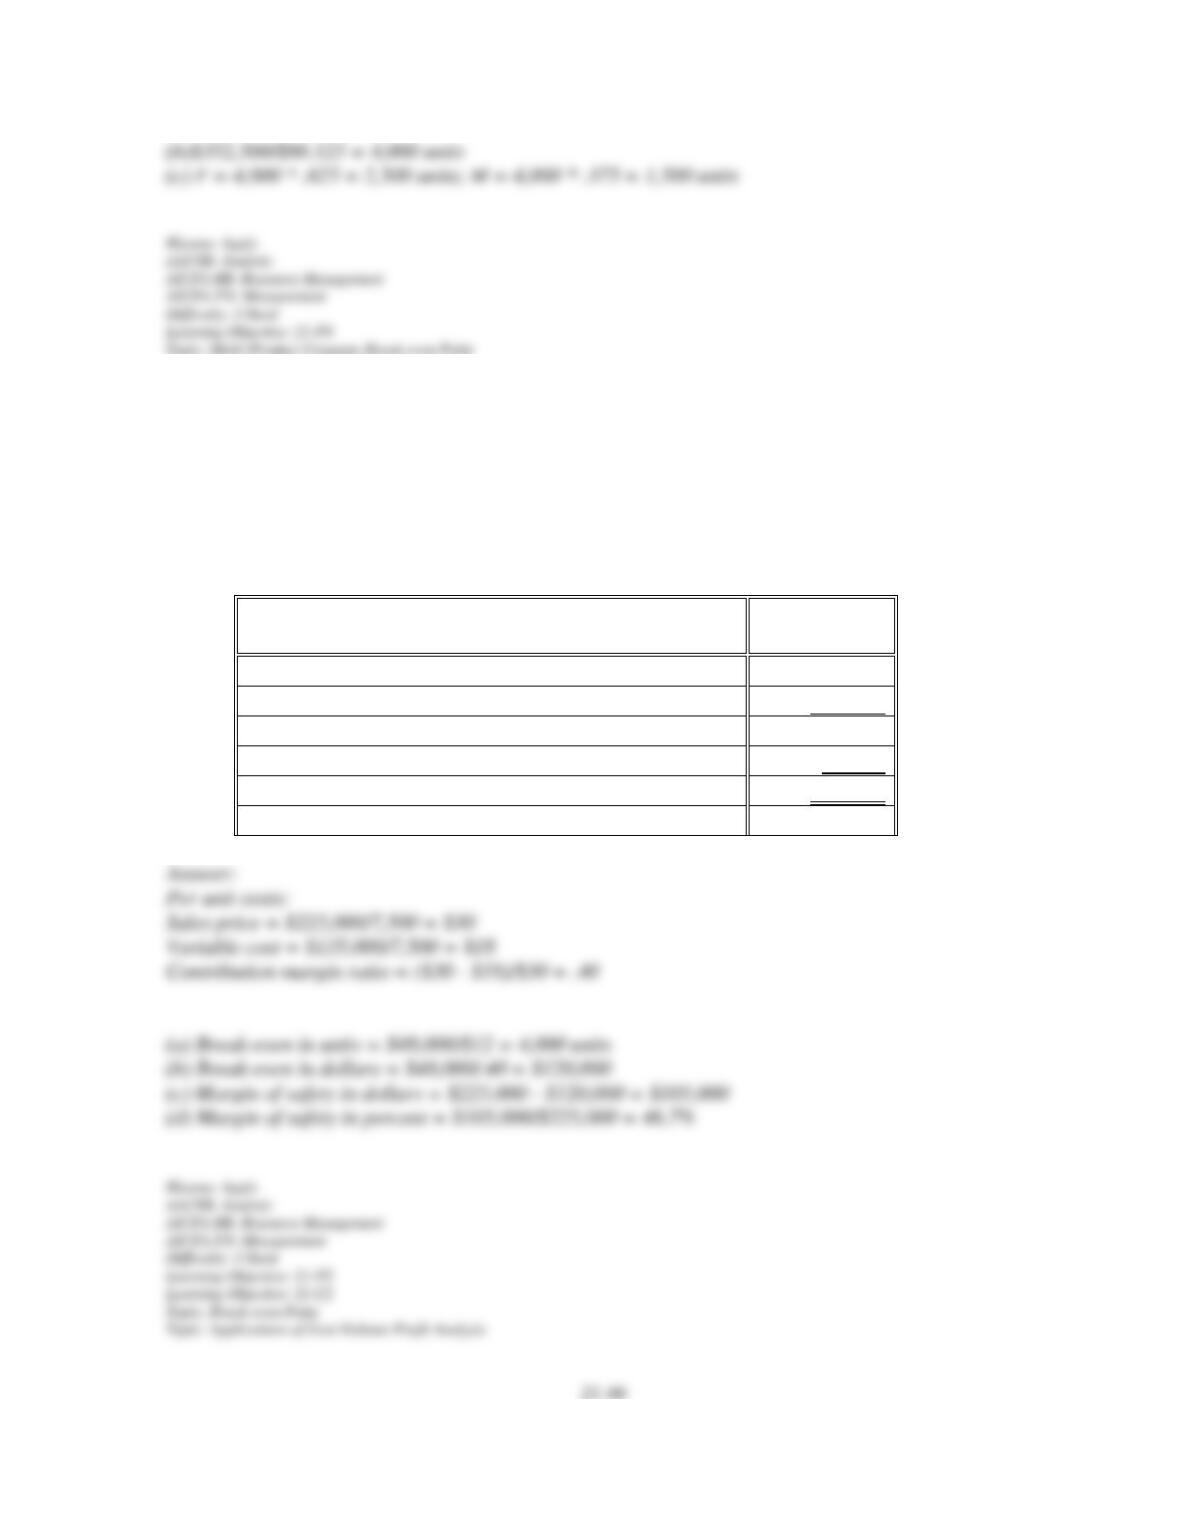
176. Bristol Company’s contribution margin income statement is presented below. Sales for
the current period consisted of 7,500 units. Compute the company’s break-even point in (a)
units, and (b) dollars. Compute the margin of safety in (c) dollars and (d) percent.
Bristol Company
Contribution Margin Income Statement
Sales
$225,000
Variable costs
135,000
Contribution margin
90,000
Fixed costs
48,000
Net income
$42,000
21-87
Fill in the Blank Questions
177. A _______________ cost is one that remains unchanged in amount when volume of
activity varies from period to period within a relevant range. A ______________ cost is one
that changes in proportion to changes in volume of activity.
178. A __________ cost is one that includes both fixed and variable cost components; a
______________ cost is one that reflects a step pattern.
179. Three important assumptions in cost-volume-profit analysis is that (1) _______________
per unit is constant, (2) _____________ per unit is constant, and (3) ______________ are
constant in total.
21-88
180. Solving problems to determine the relationship of cost, volume, and profit often
commences with the measurement of the ________ point. Further analysis emphasizing
profitability may be accomplished by measuring the __________ and _________________.
181. There are at least three different methods to separate costs into fixed and variable. These
methods are the _______________, _______________, and _______________ methods.
182. The unit contribution margin divided by the selling price per unit is the _____________.
183. The difference between the unit sales price and the unit variable cost of an item is
defined as the _________________________.
184. Examining strategies that impact several estimates in the CVP analysis is known as
_______________________.
185. One aid in measuring cost behavior involves creating a display of the data about past
costs in graphical form. Such a visual display is called a ______________________.
186. When using the high-low method for estimating cost behavior, the slope, or variable cost
per sales dollar, is calculated by ___________________________________.
187. _____________ is a statistical method of identifying an estimated line of cost behavior.
188. The ______________________ is the sales level at which a company neither earns a
profit nor incurs a loss.
189. A graphic presentation of cost-volume-profit data is known as a __________________
graph (or chart); this presentation is also sometimes called a ______________ chart.
190. The ratio of the volumes of the various products sold by a company is called the
______________________________.


