The current compensation package is an annual bonus award. The managers share in the bonus
pool. The pool is calculated as 10% of the annual residual income of the company. The residual
income is defined as operating income minus an interest charge of 14% of invested assets.
Required:
(1) Compute the bonus amount to be paid during each year. Also, compute (average) individual
executive bonus amounts.
(2) If the bonus was calculated by divisional residual income, what would be the bonus
amounts?

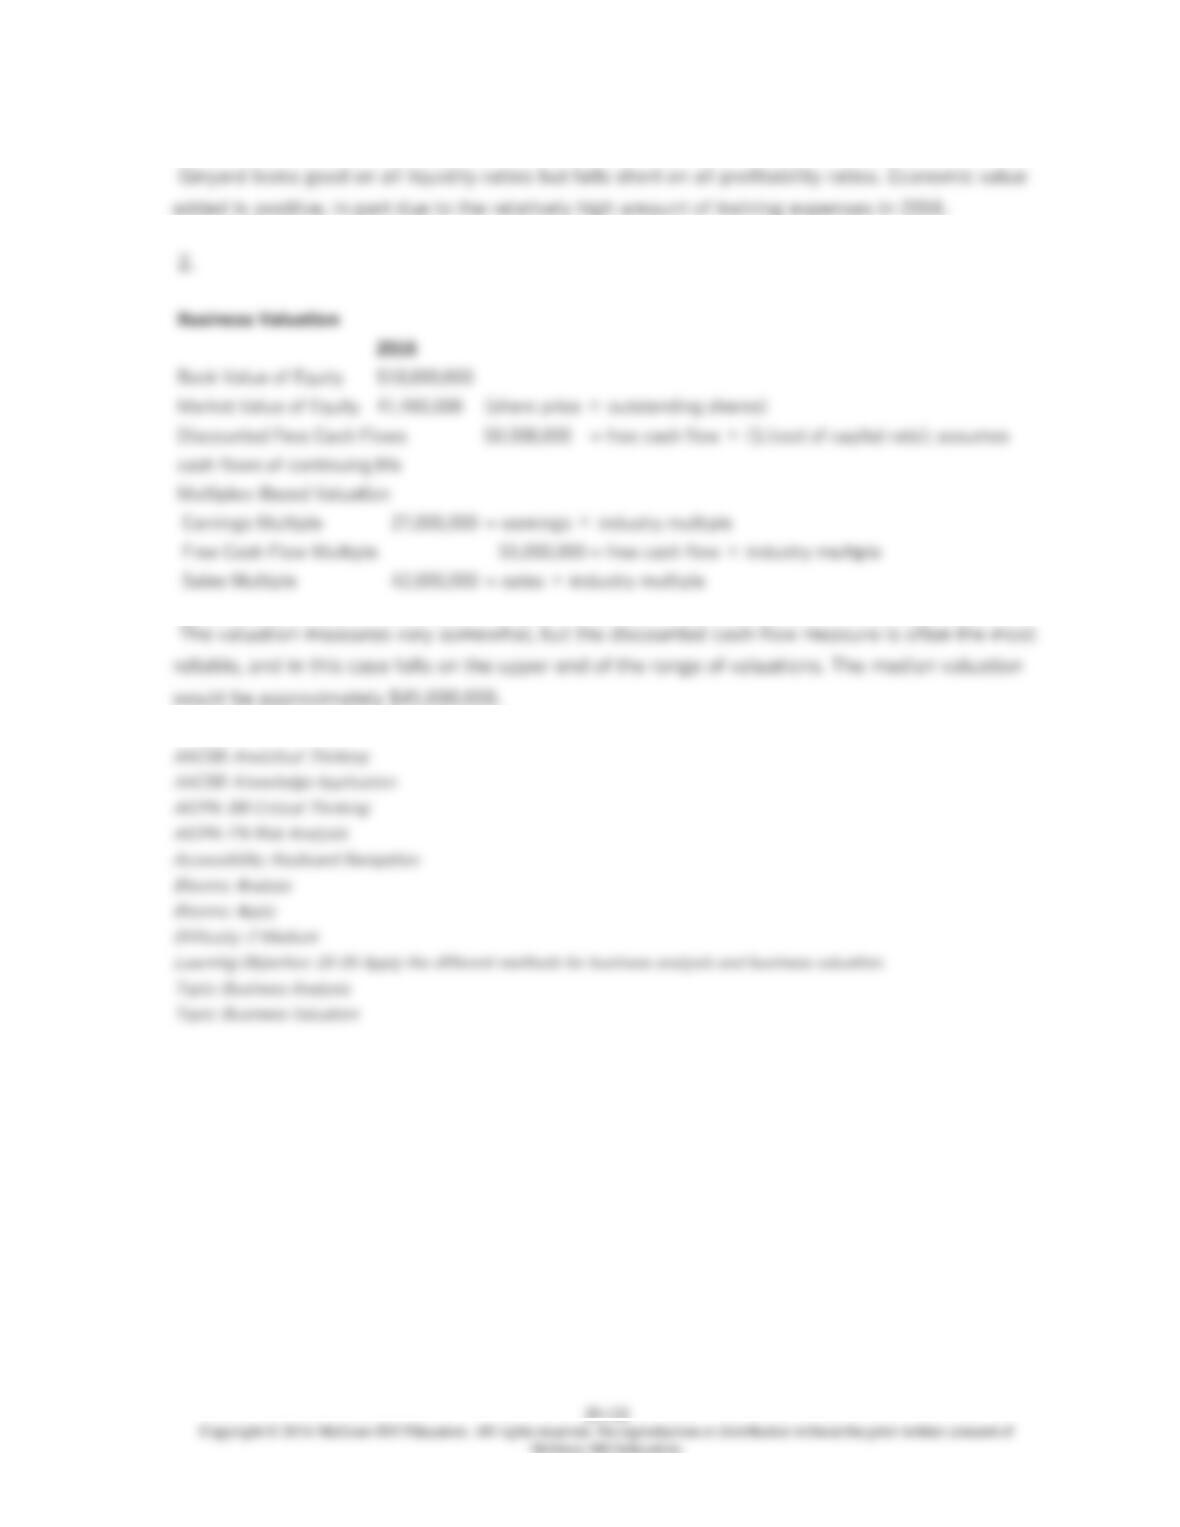
104. Ginyard Company has the following financial statements for the year ended December
31, 2016.
Balance Sheet 12/31/2016
Cash $1,600,000
Accounts Receivable 3,000,000
Inventory 2,500,000
Current Assets $7,100,000
Long-lived Assets 14,500,000
Total Assets $21,600,000
Current Liabilities $1,200,000
Long-term Debt $2,400,000
Shareholder Equity 18,000,000
Total Debt and Equity $21,600,000
Income Statement
For the year ended December 31, 2016
Sales $20,000,000
Cost of Sales 15,000,000
Gross Margin 5,000,000
Operating Expenses 2,500,000
Operating Income 2,500,000
Taxes 1,000,000
Net Income $1,500,000
Cash Flow From Operations
For the year ended December 31, 2016
Net Income $1,500,000
Plus Depreciation Expense 1,000,000
+Decrease (-inc) in AccRec. and Inv. –
+Increase (-dec) in Cur. Liabl. –
Cash Flow from Operations $2,500,000
Some additional information about 2016 includes:
Ginyard Industry Data
Year End Stock Price $23.00
Number of Outstanding Shares 1,800,000
Sales Multiplier 2.10
Free Cash Flow Multiplier 22.00
Earnings Multiplier 18.00
Cost of Capital 5.0%
Accounts Receivable Turnover 6.60
Inventory Turnover 5.80
Current Ratio 2.20
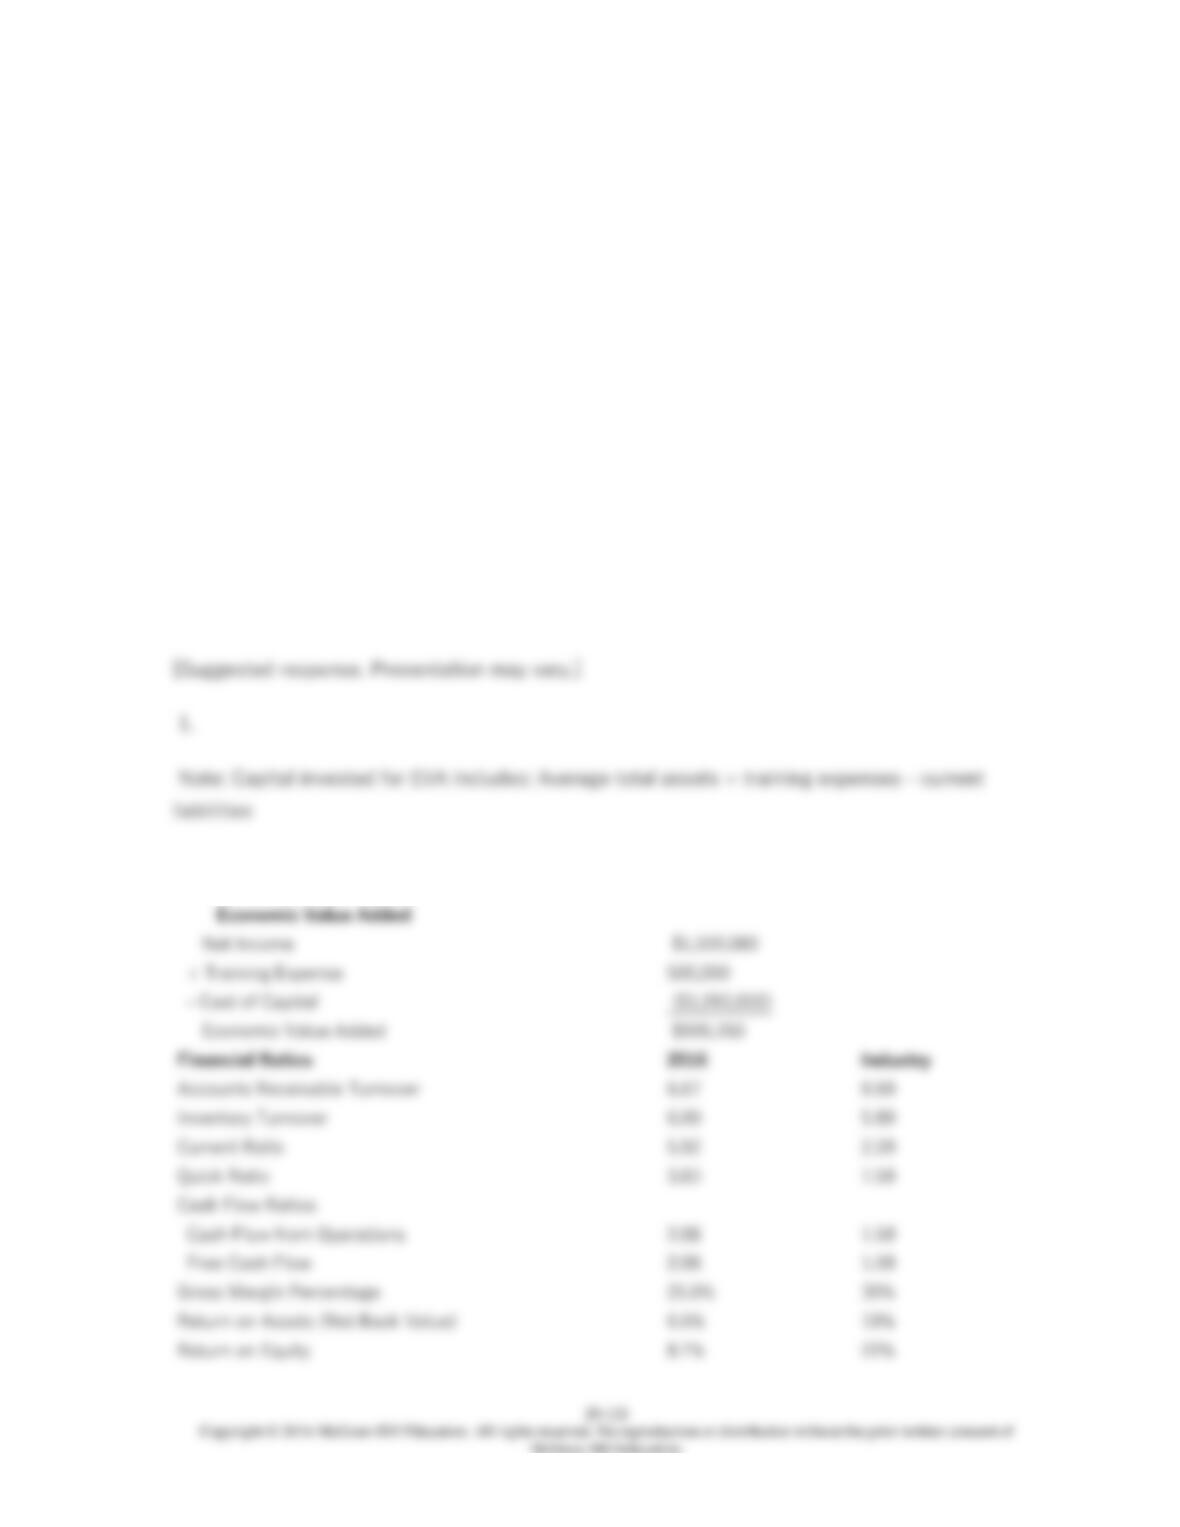
Quick Ratio 1.50
Cash Flow from Operations Ratio 1.50
Free Cash Flow Ratio 1.00
Gross Margin Percentage 30.0%
Return on Assets (Net Book Value) 18.0%
Return on Equity 22.0%
Training Expense 500,000
Income Tax Rate 40%
Depreciation Expense 1,000,000
Dividends –
Required:
1. Complete a business analysis of Ginyard Company for 2016.
2. Complete a business valuation for Ginyard Company for 2016.

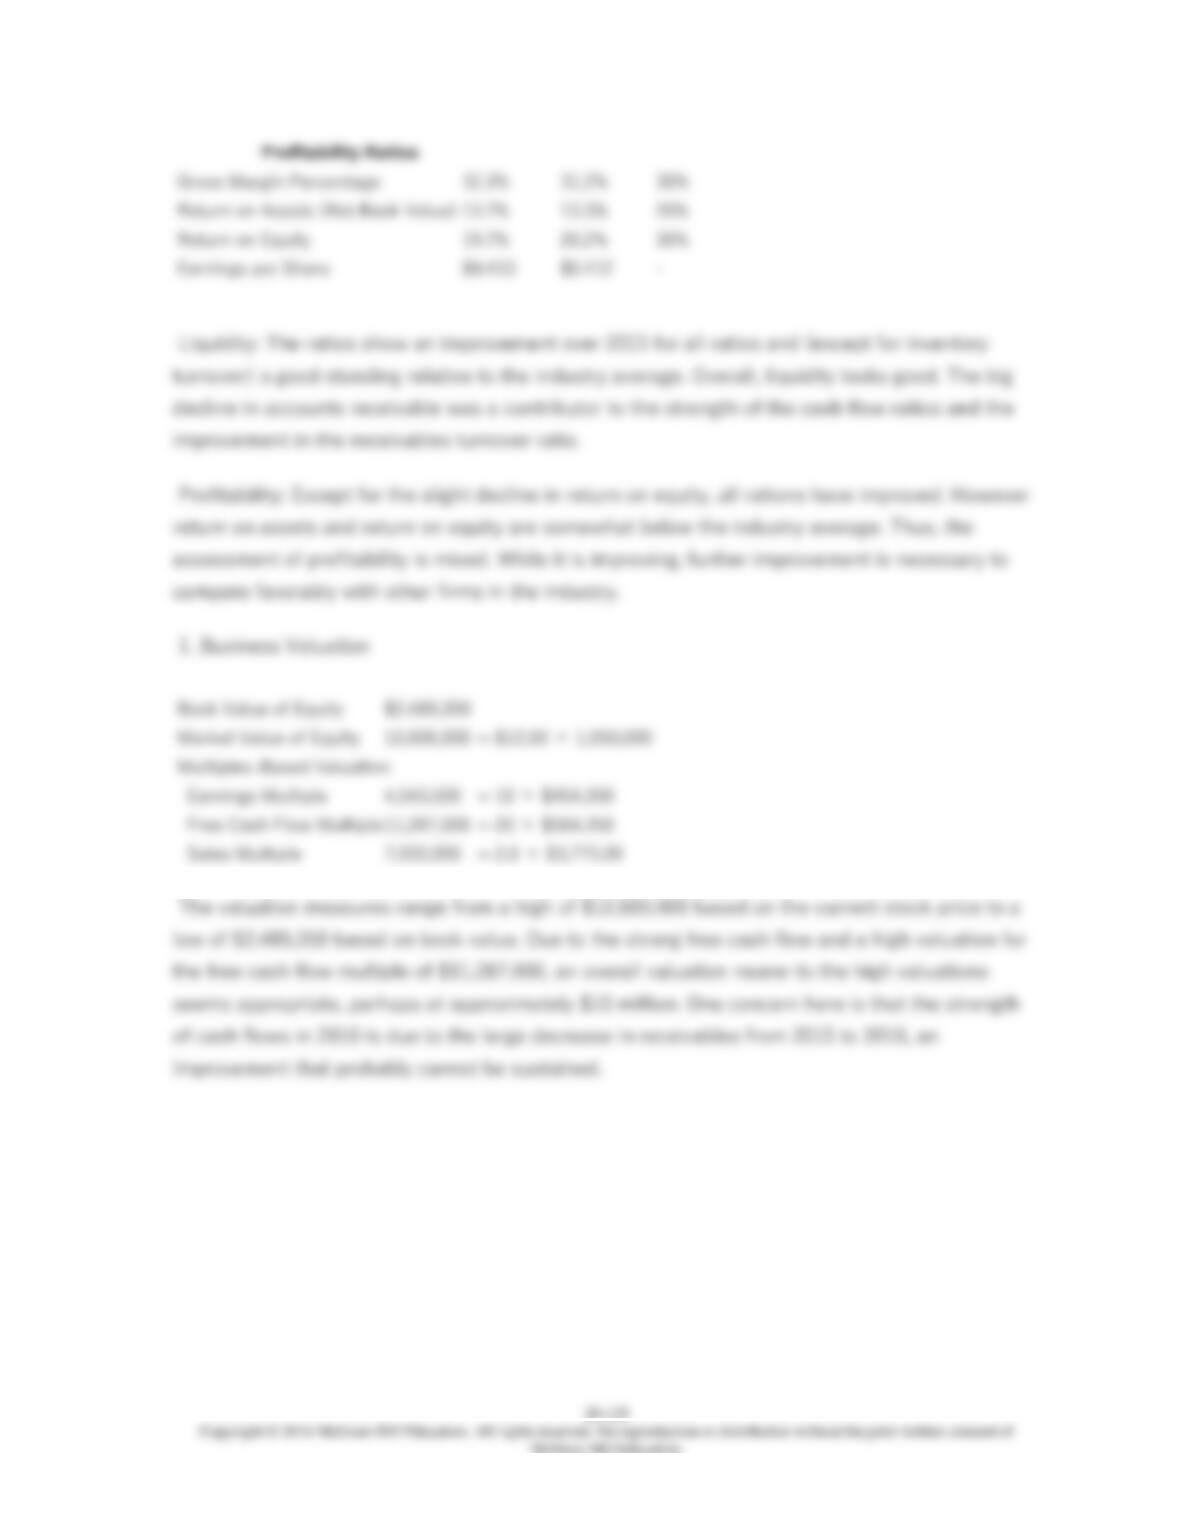
105. Jackson Manufacturing has the following operating results for 2016.
Balance Sheet, Dec 31,
2016 2015
Cash $489,350 $125,000
Accounts Receivable $315,000 $400,000
Inventory $225,000 $375,000
Total Current Assets $1,029,350 $900,000
Long-lived Assets 2,345,000 2,350,000
Total Assets $3,374,350 $3,250,000
Current Liabilities $285,000 $315,00
Long-term Debt 600,000 800,000
Shareholder Equity 2,489,350 2,135,000
Total Debt and Equity $3,374,350 $3,250,000
Income Statement, for year ended Dec 31,
2016 2015
Sales $3,775,000 $3,555,000
Cost of Sales 2,554,000 2,445,000
Gross Margin 1,221,000 1,110,000
Operating Expenses 522,000 445,000
Operating Income 699,000 665,000
Taxes 244,650 232,750
Net Income $454,350 $432,250
Cash Flow From Operations 2016 2015
Net Income $454,350 $432,250
Plus Depreciation Expense 50,000 50,000
+Decrease (-inc) in AccRec. and Inv. 235,000 –
+Increase (-dec) in Cur. Liabl. (30,000) –
Cash Flow from Operations $709,350 $482,250
In addition, the company paid dividends in both 2015 and 2016 of $100,000 per year and made
capital expenditures in both years of $45,000 per year. The company’s stock price in 2015 was
$10 and $12 in 2016. The industry average earnings multiple for the industry was 10 in 2016 and
the free cash flow and sales multiples were 20 and 2, respectively. The company is publicly
owned and has 1,050,000 shares of outstanding stock at the end of 2016. The industry average
ratios for Jackson’s industry were as follows in the most recent year.
Exhibit A: Industry Ratios for the Jackson Company
Accounts Receivable Turnover 11.10
Inventory Turnover 11.30
Current Ratio 2.80
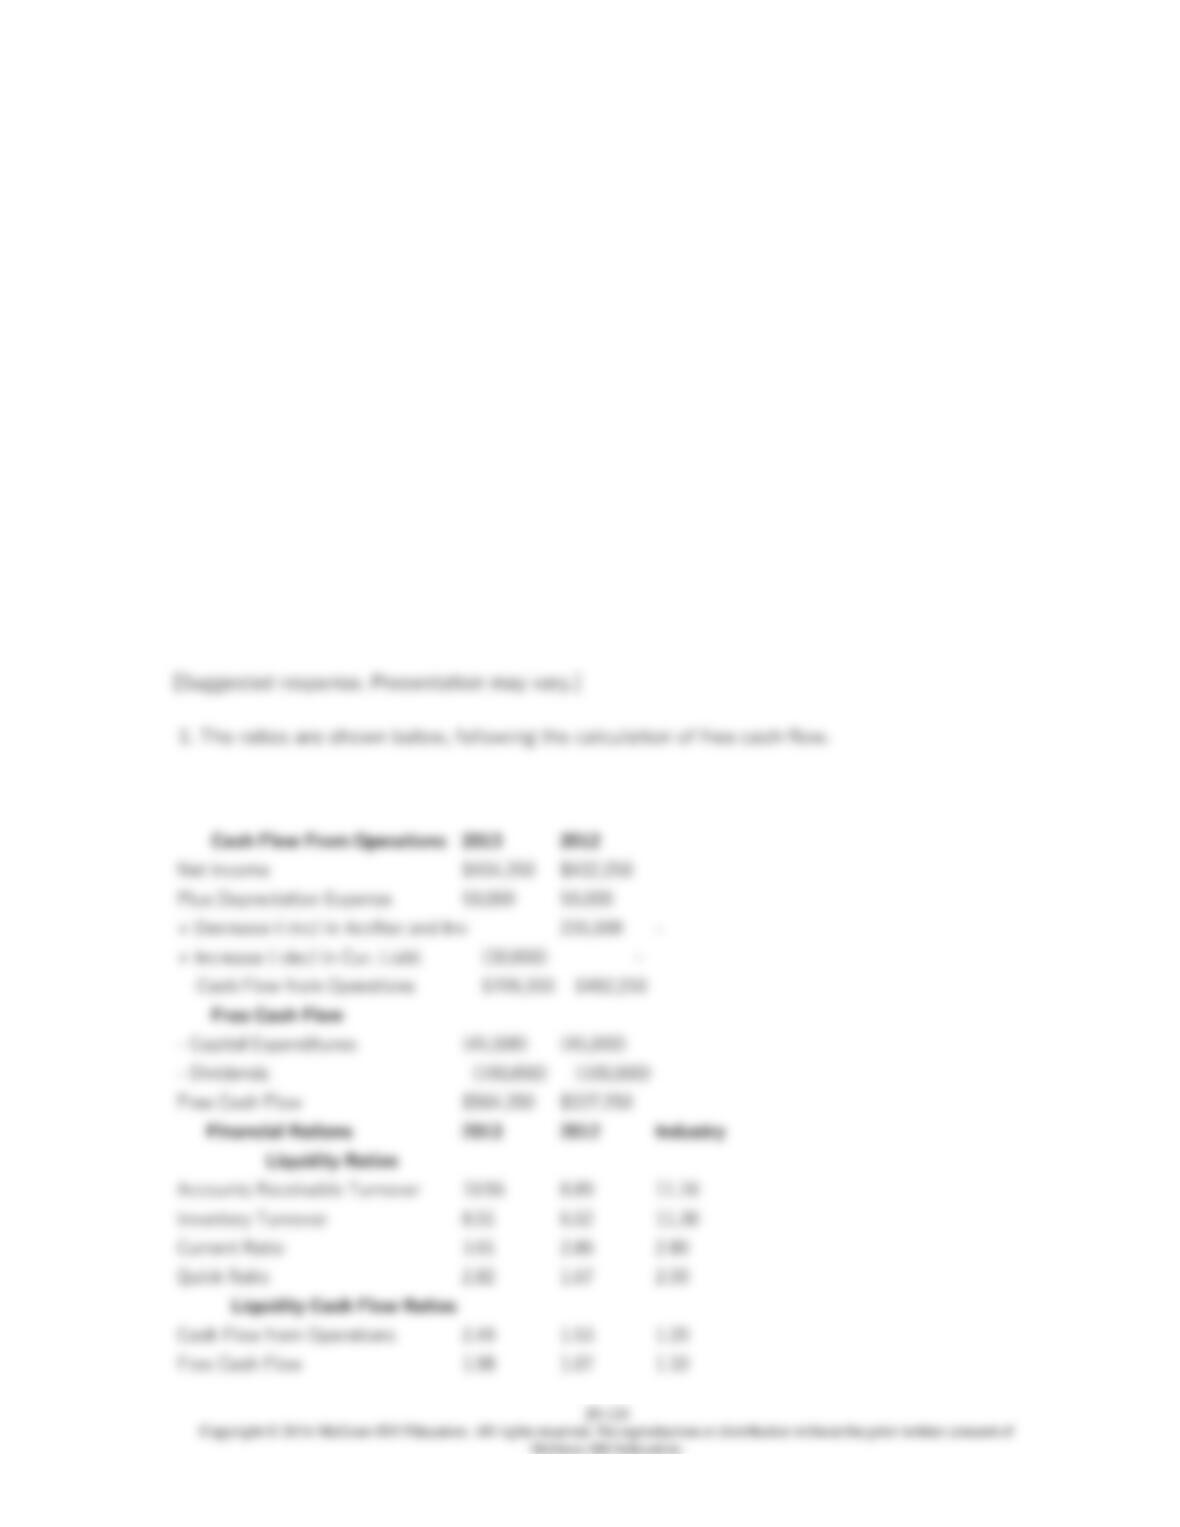
Quick Ratio 2.00
Cash Flow from Operations Ratio 1.20
Free Cash Flow Ratio 1.10
Gross Margin Percentage 30.0%
Return on Assets (Net Book Value) 20.0%
Return on Equity 30.0%
Required:
1. Calculate the ratios In Exhibit A for Jackson Company for 2016, group them by category
(liquidity, profitability) and develop a brief overview for the liquidity and profitability of the
Jackson Company at the end of 2016.
2. Complete a Business Valuation for the Jackson Company based on 2016 financial statement
information.
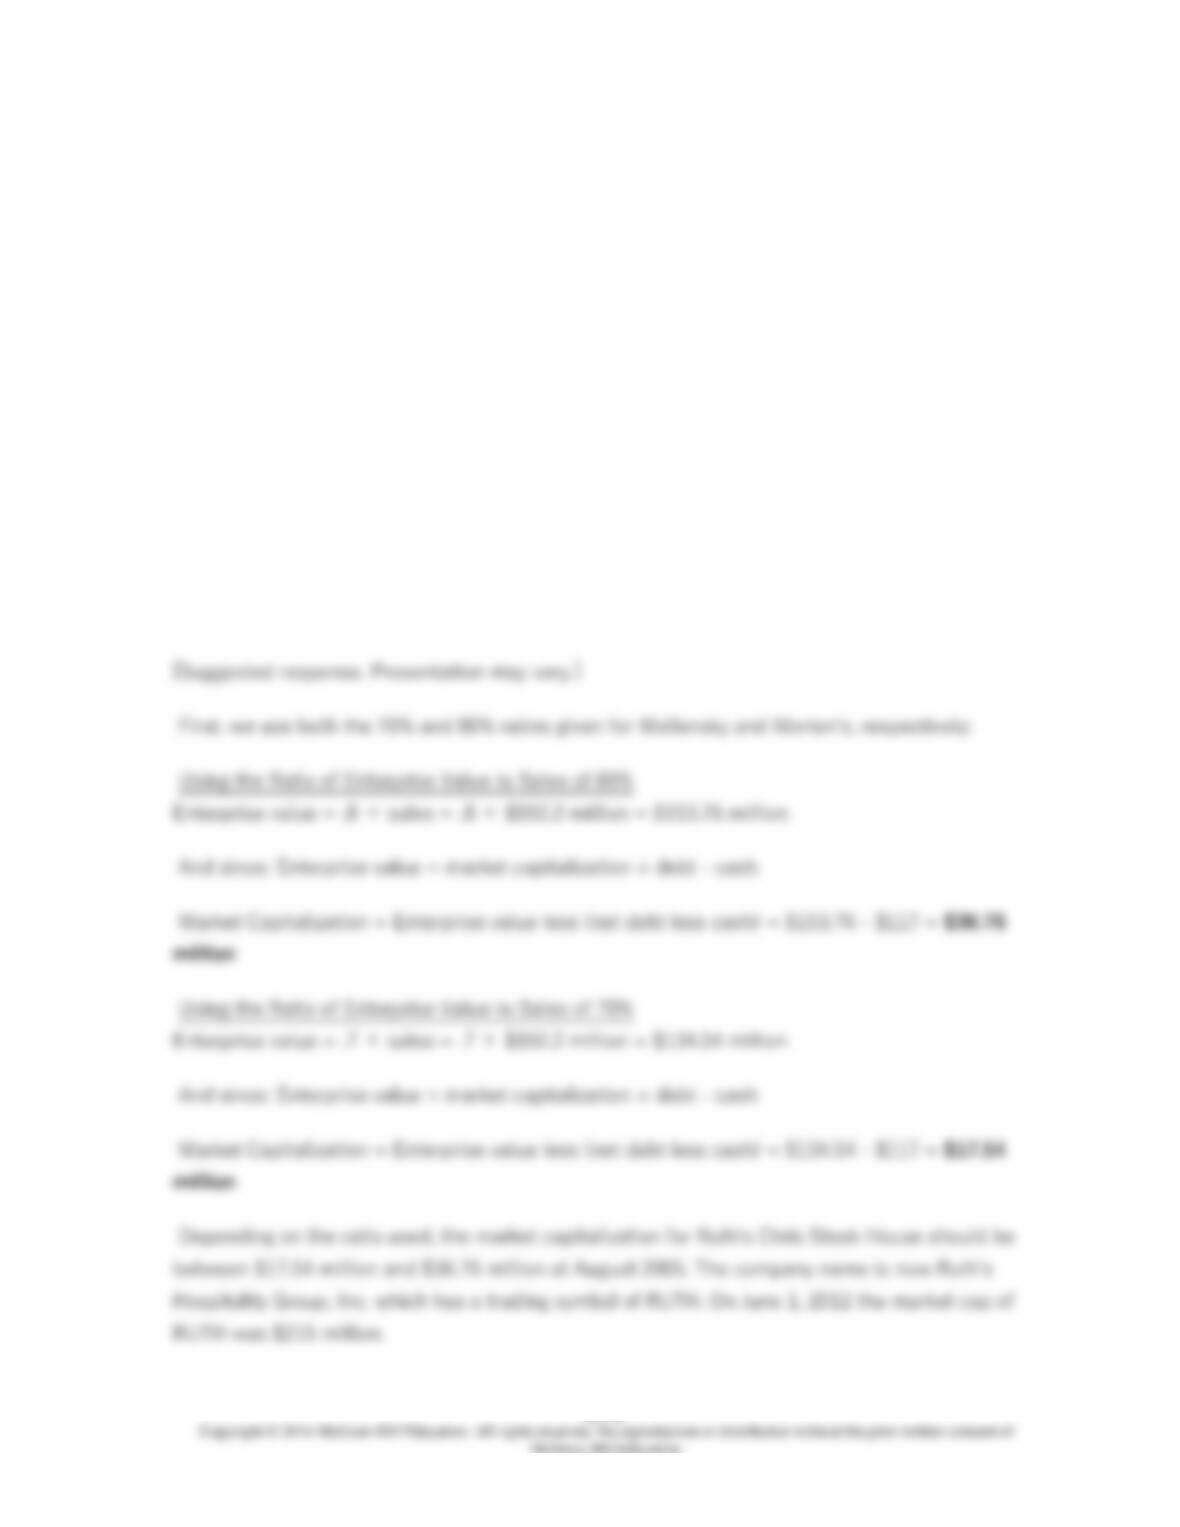
106. Ruth’s Chris Steak House is a chain of restaurants that began 43 years ago as a single
location in New Orleans and has grown to more than 90 restaurants. RCSH went public, with an
initial public offering of stock (IPO) in August 2005. A question at the time of the IPO was how to
value the company, given available information. Ruth’s had sales of $192.2 million in 2004,
earnings of $23.3 million, and net debt less cash of $117 million. One analyst chose to use the
enterprise value of comparable companies, noting that Smith and Wollensky Restaurant Group
(another chain of steak restaurants) had a ratio of enterprise value to sales of 70 percent.
Another restaurant chain, Morton’s, had recently gone private and, in the last year as a public
company, had an enterprise ratio to sales of 80 percent.
Required:
Develop an estimate of the market capitalization (market value of equity) of RCSH in August
2005 and explain your reasoning.

107. Corona is a privately held high-end luxury retailer that operates stores in the wealthiest
cities and suburbs in the United States. The corporate headquarters is located in New York City.
The company has a long history of profitability and a strong national image as the pinnacle of
luxury. However, in the past two years Corona’s profitability has begun to drop off and many of
the top executives fear that the company’s most important asset, its brand image, might come
into jeopardy if it cannot regain its past profitability.
Bernard Starnes, Corona’s long-time CEO, wonders if the company’s aged compensation plan
might be at least partially responsible for Corona’s tough times. He remembers a time when the
company was rapidly expanding by creating several new divisions and aggressively promoting its
brand image. It seemed like he was attending a new store opening every week. During those
times divisional managers worked hard for their bonuses. It was almost as if there was a
competition between divisions as to which could beat their sales plans by the widest margin
because that would mean the largest bonuses. This was due to the fact that a significant portion
of the managers’ compensation was tied to their bonuses. Now the company is not expanding as
rapidly and its focus has shifted to promoting current products and growing same-store sales.
Furthermore, Mr. Starnes has noticed several troubling trends within the company. First, he has
noticed a steady decline in cross-divisional cooperation and coordination. Second, there have
been several recent occasions where Mr. Starnes had to become personally involved in situations
where divisional managers were making decisions that were beneficial to their individual
divisions but not strategically aligned with the firm as a whole. Finally, management turnover is
becoming somewhat of a problem, especially right after bonuses are awarded at the end of each
fiscal year.
Required:
Suggest a new compensation plan that would help solve the problems Mr. Starnes has noticed at
Corona. Show how your answer effectively addresses the strategic goals of the company.

108. A leading author in accounting and finance, Alfred Rappaport focuses in his work on the
importance of a firm’s management continually taking steps that increase shareholder value. In a
recent article he set out his “Ten Ways to Create Shareholder Value:”
1. Do not manage earnings or provide earnings guidance; do not focus on earnings as it reflect
neither the company’s value or the change in value over the reporting period.
2. Make the strategic decisions that maximize expected value, even at the expense of lowering
near-term earnings; this may mean divesting units that do not contribute to the company’s long–
term strategic goals though they do contribute to current profits.
3. Make acquisitions that maximize expected value, even at the expense of lowering near-term
earnings; do not make acquisitions that improve only current earnings per share, but those that
are expected to contribute to long-term value.
4. Carry only assets that maximize value; continually review assets and be prepared to sell units,
brands, real estate, or other assets that can be sold for a price that is greater than their value to
the company.
5. Return cash to shareholders when there are no credible value-creating opportunities to invest
in the business; through cash dividends and stock buybacks.
6. Reward CEOs and other senior executives for delivering superior long-term returns.
7. Reward operating unit managers for adding superior multiyear value.
8. Reward middle managers and frontline employees for delivering superior performance on the
key value drivers that they influence directly.
9. Require senior executives to bear risks of ownership just as shareholders do.
10. Provide investors with value relevant information.
Required:
A key topic in management accounting is the valuation of a company. Focusing on public
companies, Rappaport explains how to increase business value to shareholders. Summarize his
10 recommendations and show how it can be related to cost management, management
compensation, and business valuation.