
86. The Harrison Bicycle Company had the following operating results for 2015-2016. In
addition, the company paid dividends in both 2015 and 2016 of $80,000 per year and made
capital expenditures in both years of $230,000 per year. The company’s stock price in 2015 was
$14.20 and $12.50 in 2016. Also in 2016, the industry average earnings multiple for the bicycle
industry was 8 and the free cash flow and sales multiples were 16 and 1.35, respectively. The
company is publicly owned and has 1,400,000 shares of outstanding stock at the end of 2016.
Balance Sheet, Dec 31,
2016 2015
Cash $267,000 $100,000
Accounts Receivable $525,000 $400,000
Inventory $450,000 $300,000
Total Current Assets $1,242,000 $800,000
Long-lived Assets 1,205,000 1,100,000
Total Assets $2,447,000 $1,900,000
Current Liabilities $500,000 $300,000
Long-term Debt 600,000 500,000
Shareholder Equity 1,347,000 1,100,000
Total Debt and Equity $2,447,000 $1,900,000
Income Statement, for year ended Dec 31,
2016 2015
Sales $6,250,000 $5,450,000
Cost of Sales 5,125,000 4,400,000
Gross Margin 1,125,000 1,050,000
Operating Expenses 580,000 550,000
Operating Income 545,000 500,000
Taxes 218,000 200,000
Net Income $327,000 $300,000
Cash Flow From Operations 2016 2015
Net Income $327,000 $300,000
Plus Depreciation Expense 125,000 125,000
+ Decrease (-inc) in AccRec. and Inv. (275,000) –
+ Increase (-dec) in Cur. Liabl. 200,000 –
Cash Flow from Operations $377,000 $425,000
The value of the company, calculated using the sales multiple for 2016 is:

87. The Harrison Bicycle Company had the following operating results for 2015-2016. In
addition, the company paid dividends in both 2015 and 2016 of $80,000 per year and made
capital expenditures in both years of $230,000 per year. The company’s stock price in 2015 was
$14.20 and $12.50 in 2016. Also in 2016, the industry average earnings multiple for the bicycle
industry was 8 and the free cash flow and sales multiples were 16 and 1.35, respectively. The
company is publicly owned and has 1,400,000 shares of outstanding stock at the end of 2016.
Balance Sheet, Dec 31,
2016 2015
Cash $267,000 $100,000
Accounts Receivable $525,000 $400,000
Inventory $450,000 $300,000
Total Current Assets $1,242,000 $800,000
Long-lived Assets 1,205,000 1,100,000
Total Assets $2,447,000 $1,900,000
Current Liabilities $500,000 $300,000
Long-term Debt 600,000 500,000
Shareholder Equity 1,347,000 1,100,000
Total Debt and Equity $2,447,000 $1,900,000
Income Statement, for year ended Dec 31,
2016 2015
Sales $6,250,000 $5,450,000
Cost of Sales 5,125,000 4,400,000
Gross Margin 1,125,000 1,050,000
Operating Expenses 580,000 550,000
Operating Income 545,000 500,000
Taxes 218,000 200,000
Net Income $327,000 $300,000
Cash Flow From Operations 2016 2015
Net Income $327,000 $300,000
Plus Depreciation Expense 125,000 125,000
+ Decrease (-inc) in AccRec. and Inv. (275,000) –
+ Increase (-dec) in Cur. Liabl. 200,000 –
Cash Flow from Operations $377,000 $425,000
The book value of the company’s equity for 2016 is:
88. Which of the following compensation plans would be tailored for a manager in a “growth”
product sales life cycle phase?
89. Which of the following is not a key category in determining bonus pay plans?
90. Which of the following is one of the most comprehensive bases of compensation?
91. Lack of controllability is a disadvantage associated with which bonus compensation base
relative to compensation objectives?
92. Which of the following is a bonus payment option?
93. What is the tax effect on the firm of a compensation plan deferred bonus?
94. Economic value added is a business unit’s income after taxes and after deducting the
_________.

95. Performance of divisional managers at Leakproof Faucet Corporation is judged by an
evaluation of the operating incomes of the divisions. Abbreviated income statements for the year
ending 2016 are shown below for the three divisions of Leakproof Faucet Corp:
Newton Granite Longview Totals
Revenues (in thousands)$2,500 $1,250 $1,500 $5,250
COGS 1,300 575 600 2,475
Gross Margin 1,200 675 900 2,775
Division Overhead 250 125 150 525
Corporate Overhead* 524 262 314 1,100
Operating Incomes 426 288 436 1,150
*Total Corporate Overhead is allocated to each division based on the division’s proportion of
total revenues.
The manager of the Newton division, through increases in manufacturing efficiency, created
some additional capacity in 2016. The only way he could have utilized this capacity would have
been to manufacture a model J-5 faucet, which would have had the following impact on the
Newton division:
Increase in annual revenues (in thousands) of $750.
Increase in cost of goods sold of $600.
Increase in divisional overhead of $100.
Mr. Garrett, the Newton division manager, chose not to manufacture the J-5 faucets; therefore,
the additional capacity went unused.
Required:
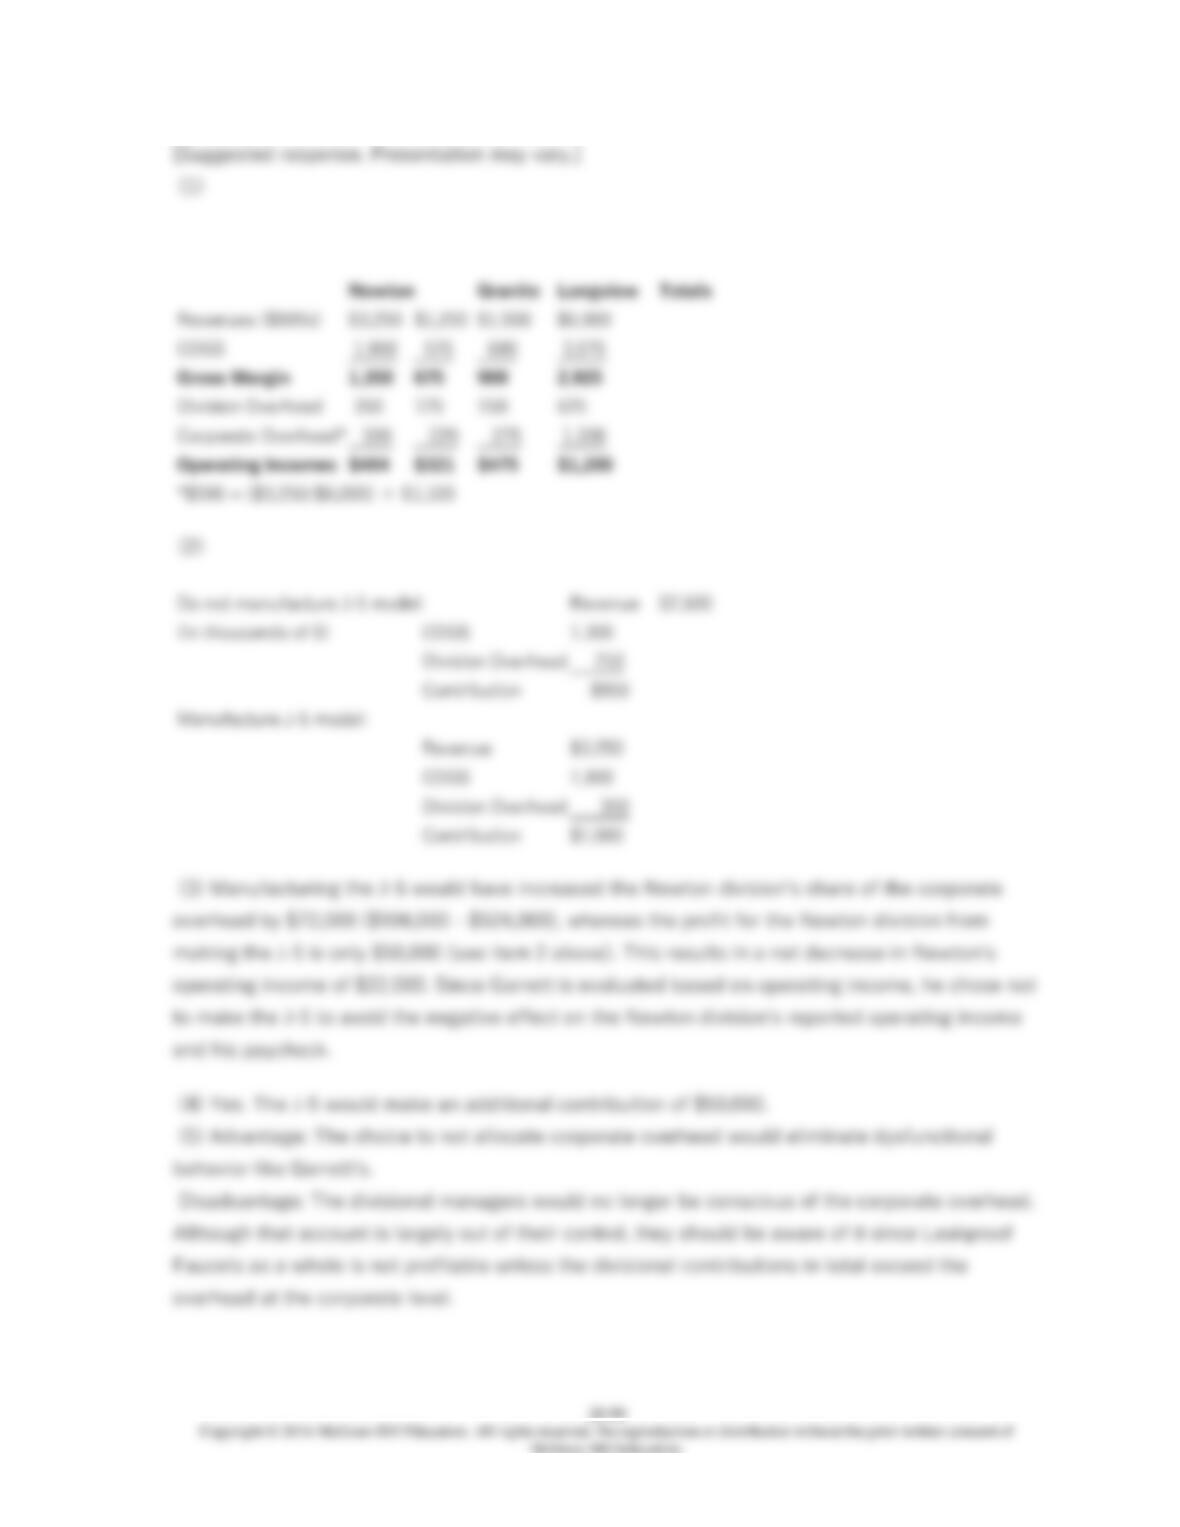
(1) Prepare revised income statements for the three divisions for 2016 assuming that Mr. Garrett
had chosen instead to utilize the additional capacity to manufacture the model J–5.
(2) Calculate the contribution margin of the Newton division if J-5 is manufactured and if it is not
manufactured.
(3) Why did Mr. Garrett choose not to manufacture the J–5?
(4) Would Leakproof Faucets have benefited from the manufacture of the J–5?
(5) Identify an advantage and a disadvantage of not allocating any corporate overhead to the
divisions.
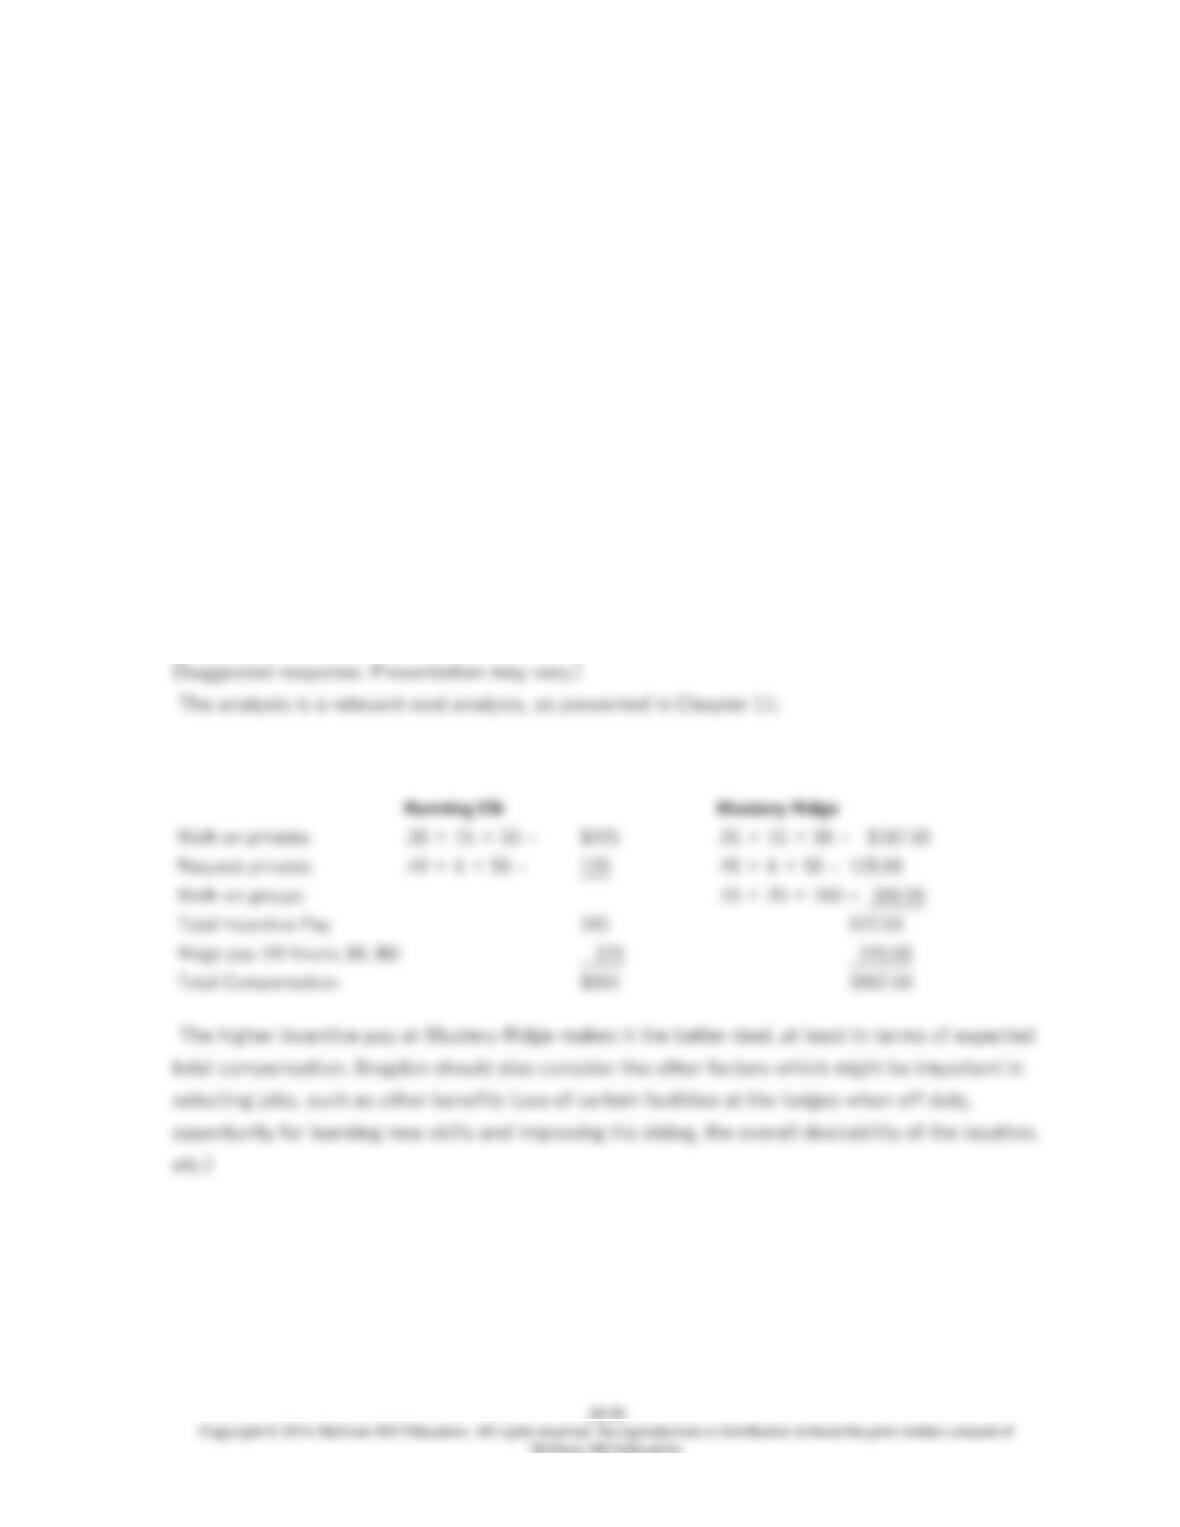
96. Brogdon is a ski instructor looking for employment in the Oregon mountains. He has
received full-time job offers from two ski lodges, and must choose between them. The two jobs
seem equally attractive, so Brogdon wants to choose the lodge which will pay him the higher
compensation. Running Elk Lodge offers a wage of $8.00 per hour for a 40 hour week, plus 30%
of the fees paid by walk-on pupils desiring private lessons, plus 40% of fees from pupils who
specifically request a private lesson from Brogdon. Blustery Ridge Lodge offers a wage of only
$6.00 per hour, plus 25% of walk-on privates lesson fees, 45% of request privates lesson fees,
and 15% of the fees paid by walk-on groups. Both lodges charge skiers $50 for private lessons
and $100 per 5-person group for group lessons. Brogdon’s previous experience leads him to
expect weekly volume of 15 walk-on privates, 6 request privates, and 20 walk-on groups.
Required:
Which job should Brogdon accept? What factors should Brogdon consider in making his choice?

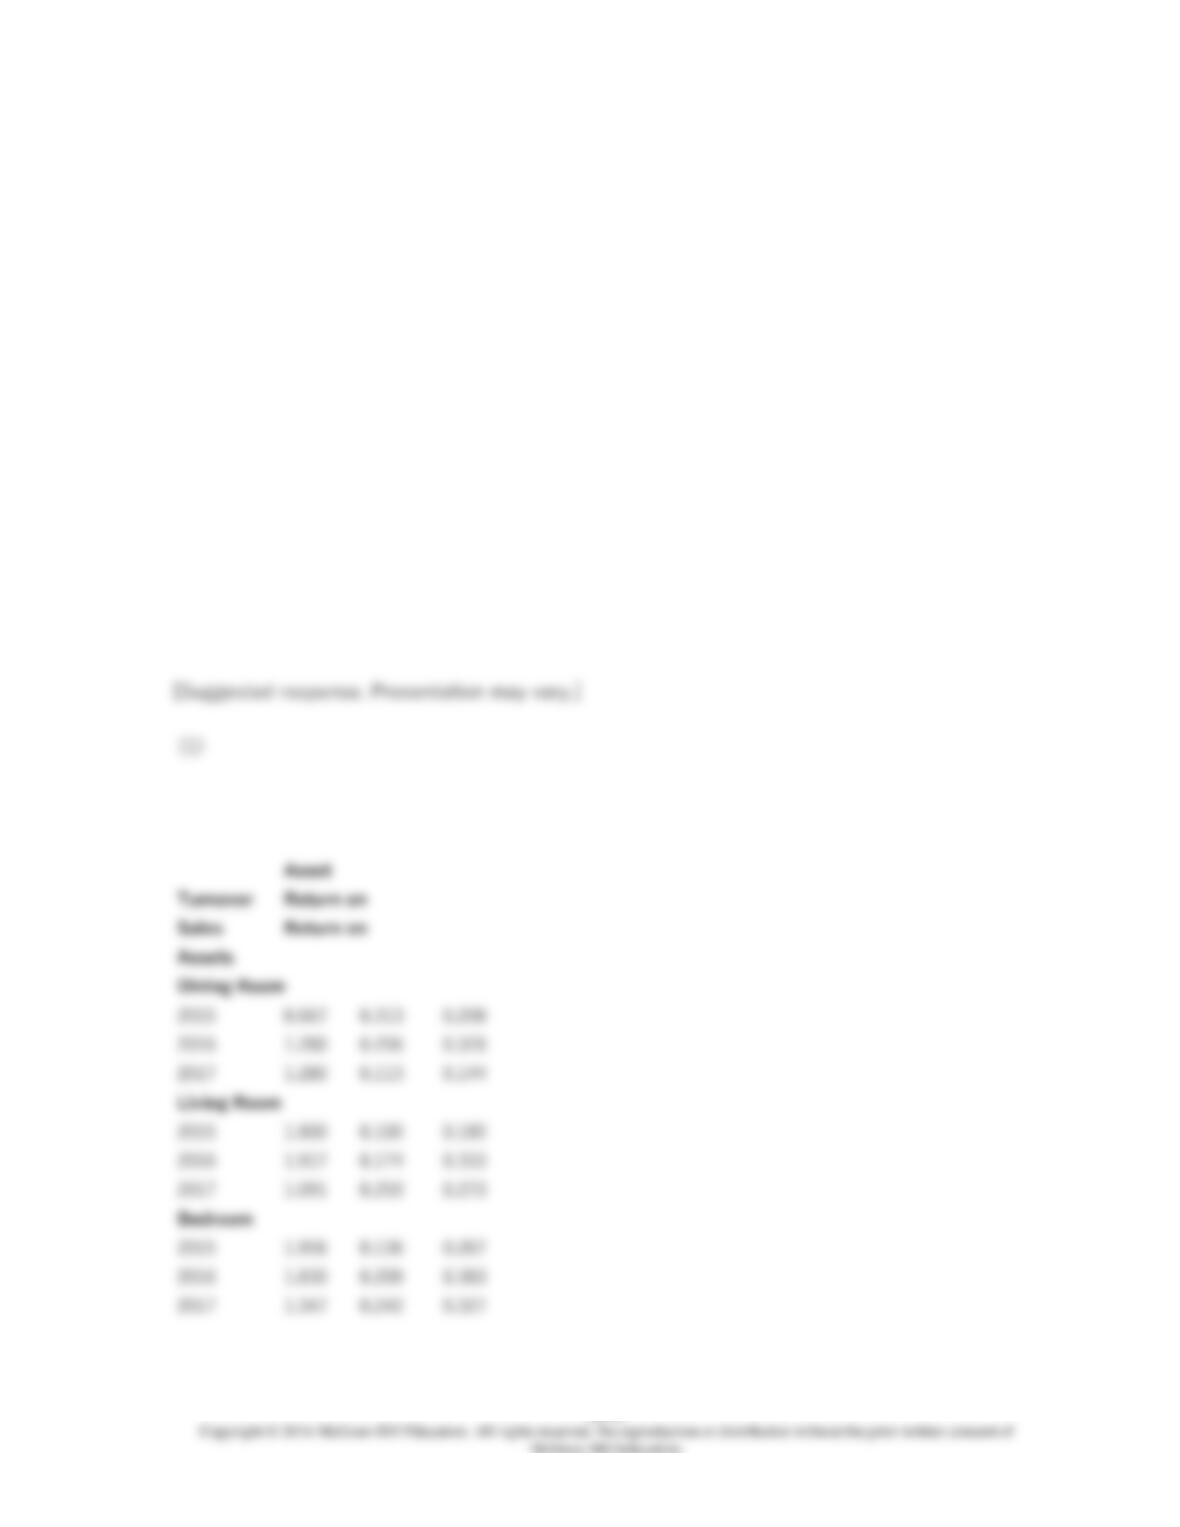
97. Products Inc. manufactures furniture and is organized into three large divisions: bedroom,
living room, and dining room furniture. The following information presents operating revenues,
operating incomes and invested assets of the company over the last three years. (all figures in
000s)
Operating
Revenue Operating
Income Invested
Assets
Dining Room
2015 $8,000 $2,500 $12,000
2016 16,000 4,100 12,500
2017 16,000 1,800 12,500
Living Room
2015 4,500 450 2,500
2016 4,600 800 2,400
2017 2,400 600 2,200
Bedroom
2015 8,800 1,200 4,500
2016 8,600 1,800 4,700
2017 6,600 1,600 4,900
The following table shows the number of managers covered by the current compensation
package of Products Inc.:
Number of
Executives Dining
Room Living
Room
Bedroom
Total
2015 300 40 120 460
2016 350 40 140 530
2017 375 37 175 587
The current compensation package is an annual bonus award. The managers share in the bonus
pool. The pool is calculated as 12% of the annual residual income of the company. The residual
income is defined as operating income minus an interest charge of 10% of invested assets.
Required:
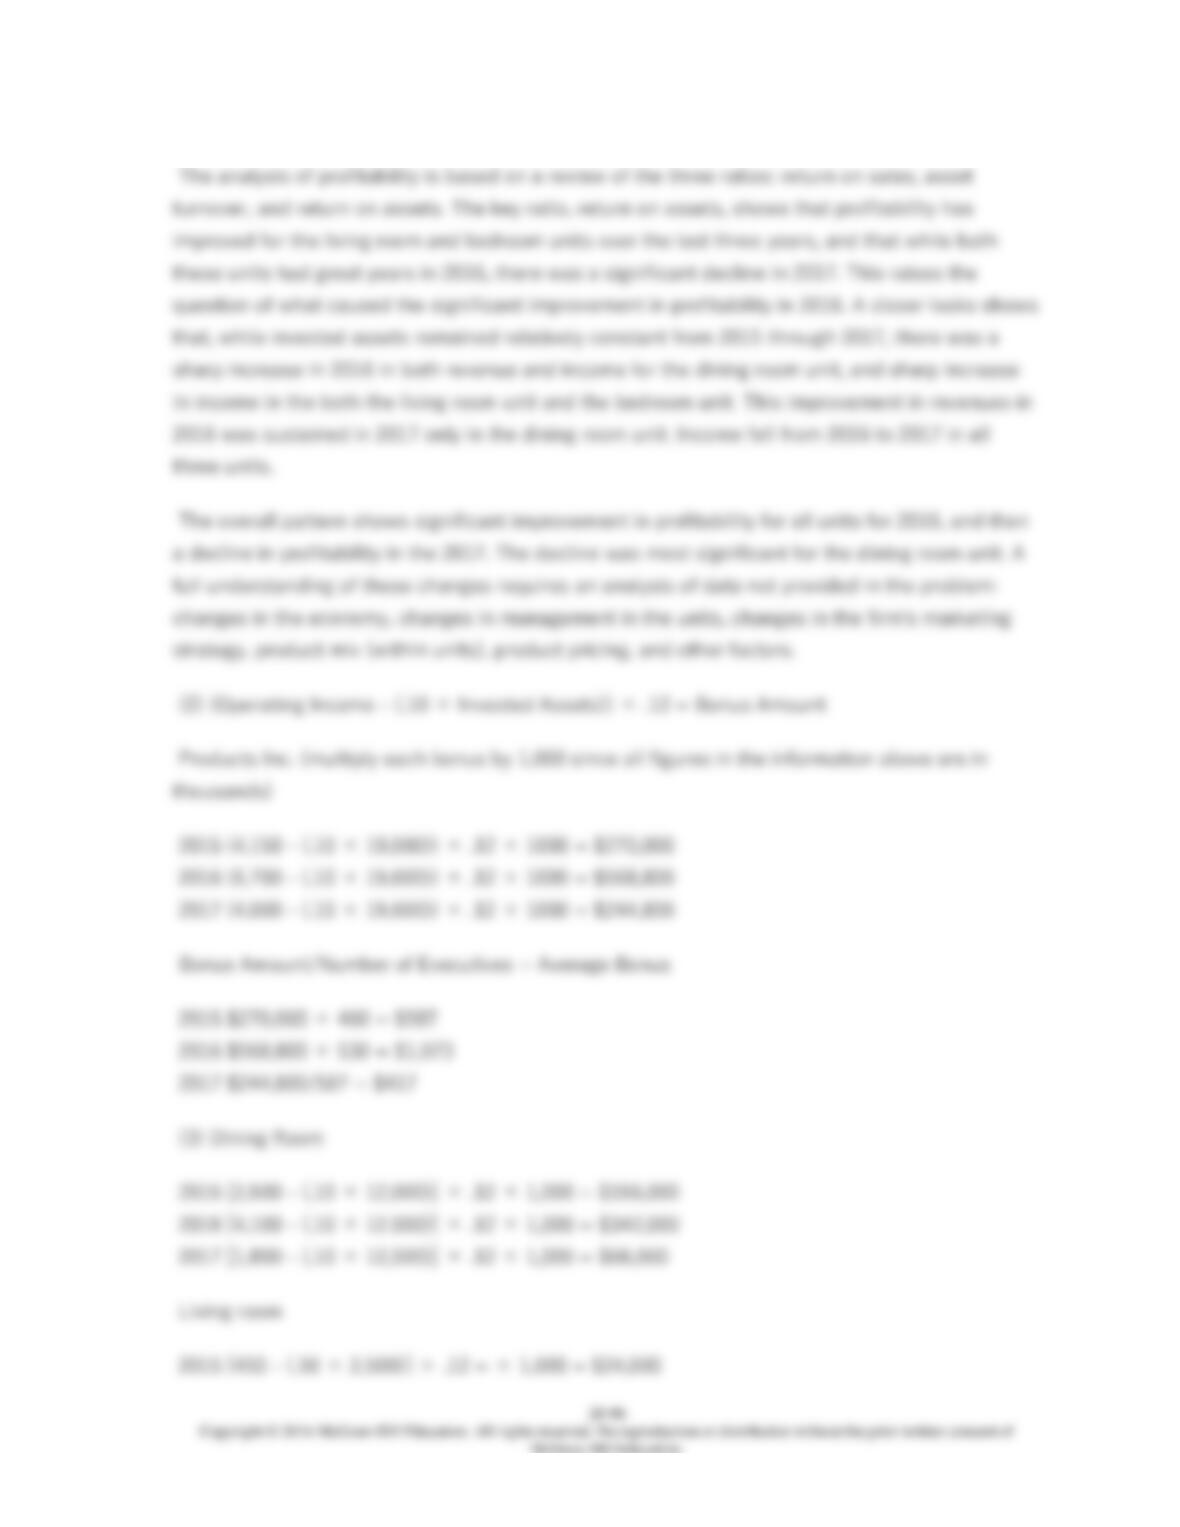
(1) Use investment turnover, return on sales, and ROI to explain the differences in profitability of
the three divisions for 2015, 2016 and 2017.
(2) Compute the bonus amount to be paid during each year. Also, compute the average
individual executive bonus amounts (round to even dollar).
(3) If the bonus were calculated by divisional residual income what would be the bonus amounts
for each division?
(4) Discuss the benefits and problems of basing the bonus on firm-wide residual income of a
company compared to using divisional residual income.

98. Mobile Business Incorporated (MBI) is a worldwide manufacturing company that
specializes in high technology products for the aerospace, automotive and plastics industries.
The state-of–the-art technology and business innovation have been key to MBI’s success over
the last ten years.
After a meeting of the board of directors, there was some feeling that the company was moving
away from its goal of striving to maintain and expand its global position through innovative
management teams.
One area of concern was with the company’s bonus compensation package. The company’s
current bonus plan focuses on giving reward based on the utilization of capital within the
company, i.e. management of inventory, collection of receivables and use of physical assets. Even
with such a state of the art bonus plan, the board of directors is concerned with the short-term
focus of the compensation package. MBI’s basis in current financial standards suggests that the
future period consequences of managerial actions will not be reflected when presenting bonus
compensation.
Required:
Help MBI solve the problem of basing bonuses on short-term decisions. Develop a bonus
package that takes into consideration the long-term financial position of MBI.

99. Harold Small joined Morton Electric Company eight months ago as Vice President of
Personnel Administration. Morton Electric Company is a small regional public utility serving
50,000 customers in three communities and the surrounding rural area. Electricity is generated at
a central plant, but each community has a substation and its own work crew. The total labor
force at the central plant and three substations, exclusive of administrative and clerical
personnel, numbers 180 people.
Small designed and introduced a Performance Evaluation and Review System (PERS) shortly
after joining Morton. This system was based upon a similar system he had developed and
administered in his prior position with a small company. He thought the system had worked well
and that it could be easily adapted for use at Morton. The purpose of PERS, as conceived by
Small, is to provide a positive feedback system for evaluating employees that would be uniform
for each class of employees. Thus, the system would indicate to employees how they were
performing on the job and help them correct any shortcomings. The Plant Supervisors and Field
Supervisors are responsible for administering the system for the plant workers and the
substation crew workers respectively. The General Supervisors are responsible for the
Plant/Field Supervisors. Employees get personal PERS Reports monthly informing them of their
current status, and there is a review and evaluation every six months.
PERS is based on a point system in an attempt to make it uniform for all workers. There are
eight categories for evaluation with a maximum number of points for each category and a total of
100 points for the system. The eight categories for the plant and crew workers and the maximum
number of points in each category are as follows.
Categories Points
1.
Quality of work
15
Points are deducted if the job must be redone within 48 hours of completion.
2.
Productivity
15
Points are deducted if the work was not completed within the time specified for the type of job.
3.
Safety on the job
15
Points are deducted if the employee does not use safe work habits on the job to protect him/herself and
others.
4.
Neatness of work area or repair truck
15
Points are deducted if the work area or truck is not clean and neat
5.
Cooperation with fellow workers
10
Points are deducted if an employee does not work well with others.
6.
Courtesy on the job and with the public
10
Points are deducted if an employee is rude and unpleasant when there is contact with the public.
7.
Appearance
10
Points are deducted if an employee does not wear standard work clothing or if the clothing is sloppy
and/or dirty at the beginning of each day.