Unlock document.
This document is partially blurred.
Unlock all pages and 1 million more documents.
Get Access
59. There is a common concern today that executive compensation in the U.S. is:
60. Salary is:
61. Economic value added is calculated from:
62. Performance shares grant stock for achieving certain performance goals:
63. There is always a current tax deduction for the firm for which of the following types of
compensation?
64. There is a current taxable event for the manager when which of the following types of
compensation is received?
65. Which of the following types of compensation does not provide a deduction to the firm for
tax purposes?
66. Bonus payment options include all of the following except:
67. A CFO whose compensation plan may have had the effect of creating an incentive for
unethical actions includes:
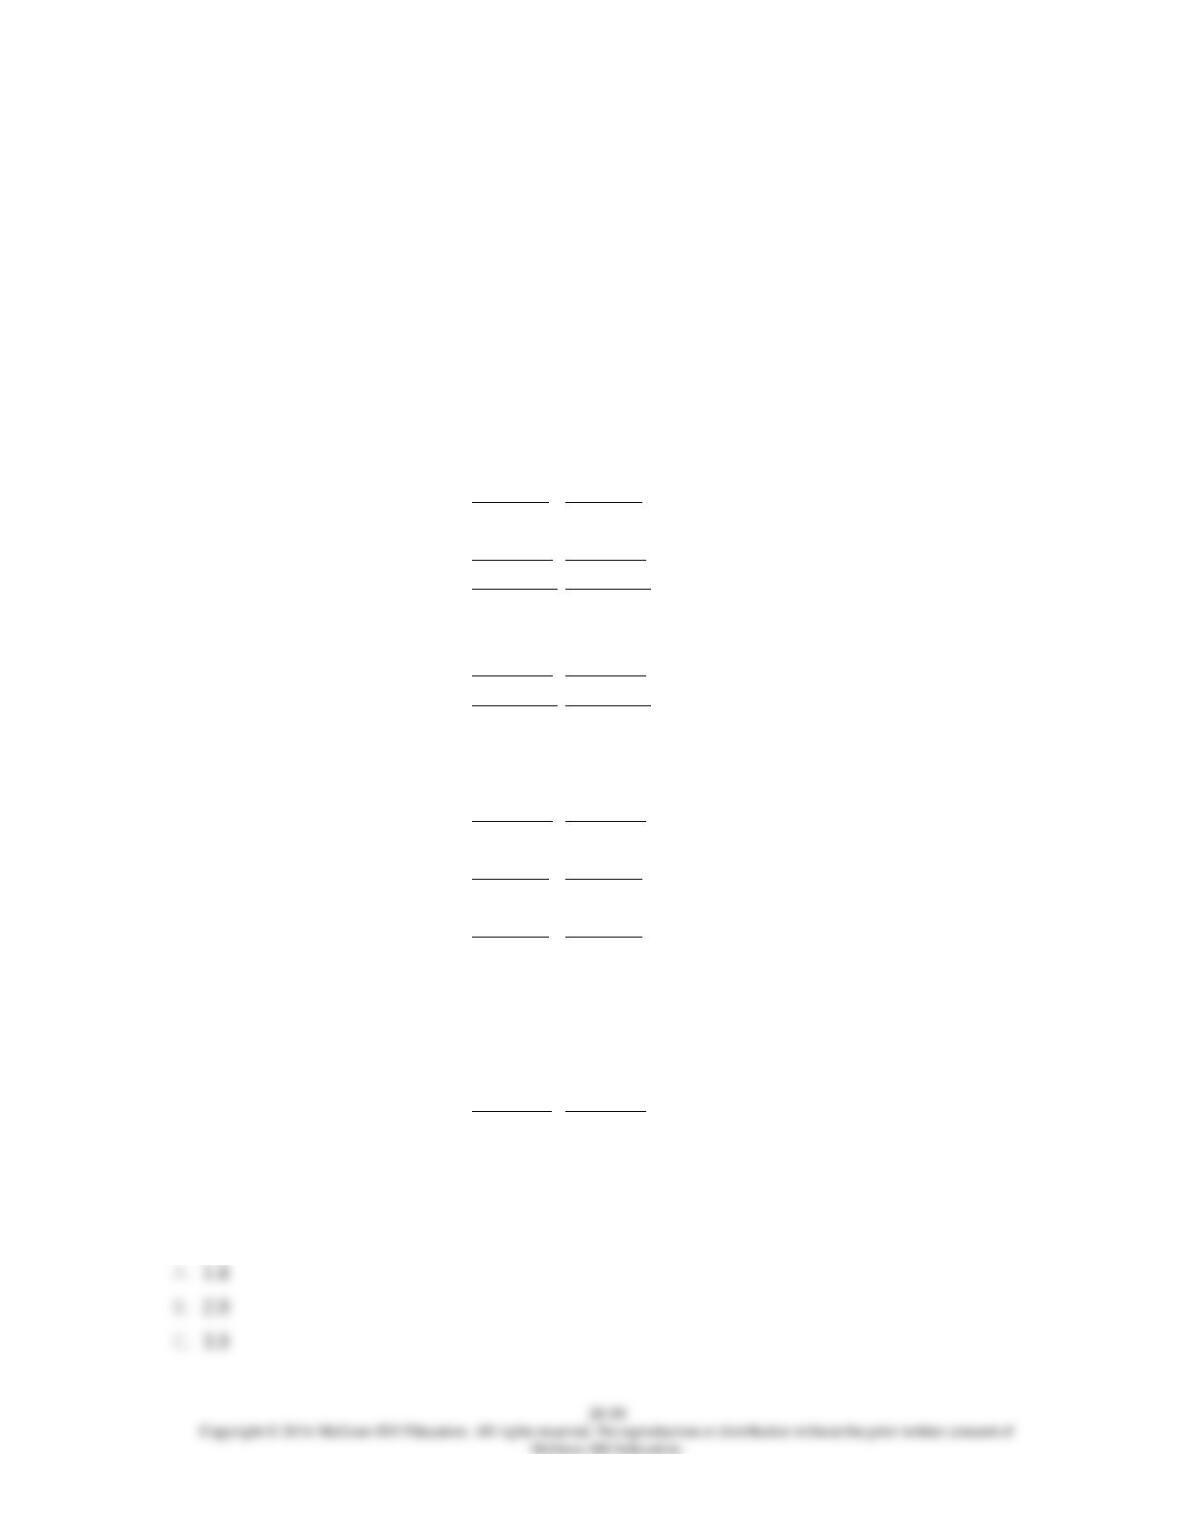
68. The King Mattress Company had the following operating results for 2015-2016. In
addition, the company paid dividends in both 2015 and 2016 of $60,000 per year and made
capital expenditures in both years of $30,000 per year. The company's stock price in 2015 was $8
and $7 in 2016. The industry average earnings multiple for the mattress industry was 9 in 2016
and the free cash flow and sales multiples were 18 and 1.5, respectively. The company is publicly
owned and has 1,200,000 shares of outstanding stock at the end of 2016.
Balance Sheet, Dec 31,
2016 2015
Cash $340,000 $100,000
Accounts Receivable $350,000 $400,000
Inventory $250,000 $300,000
Total Current Assets $940,000 $800,000
Long-lived Assets 1,080,000 1,100,000
Total Assets $2,020,000 $1,900,000
Current Liabilities $200,000 $300,000
Long-term Debt 600,000 500,000
Shareholder Equity 1,220,000 1,100,000
Total Debt and Equity $2,020,000 $1,900,000
Income Statement, for year ended Dec 31,
2016 2015
Sales $4,750,000 $4,500,000
Cost of Sales 4,100,000 4,000,000
Gross Margin 650,000 500,000
Operating Expenses 350,000 400,000
Operating Income 300,000 100,000
Taxes 120,000 40,000
Net Income $180,000 $60,000
Cash Flow From Operations 2016 2015
Net Income $180,000 $60,000
Plus Depreciation Expense 50,000 50,000
+ Decrease (-inc) in AccRec. and Inv. 100,000 -
+ Increase (-dec) in Cur. Liabl. (100,000) -
Cash Flow from Operations $230,000 $110,000
The accounts receivable turnover ratio for 2016 is (rounded):
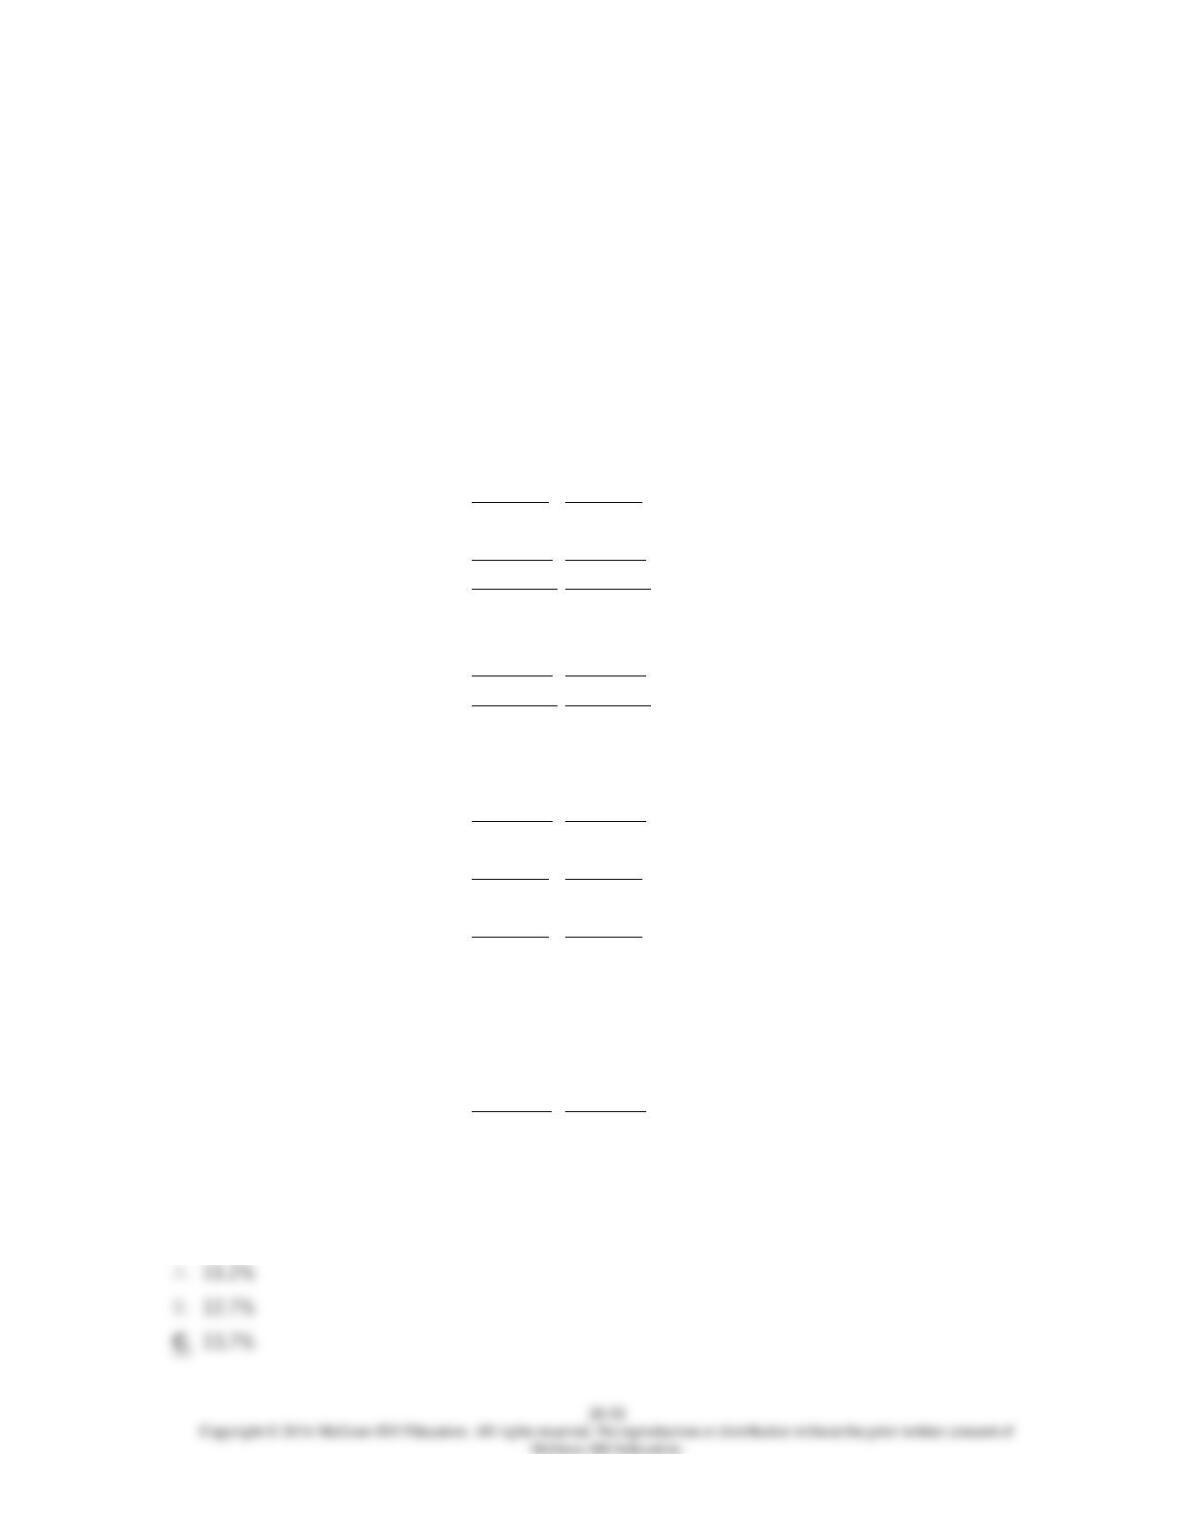
69. The King Mattress Company had the following operating results for 2015-2016. In
addition, the company paid dividends in both 2015 and 2016 of $60,000 per year and made
capital expenditures in both years of $30,000 per year. The company's stock price in 2015 was $8
and $7 in 2016. The industry average earnings multiple for the mattress industry was 9 in 2016
and the free cash flow and sales multiples were 18 and 1.5, respectively. The company is publicly
owned and has 1,200,000 shares of outstanding stock at the end of 2016.
Balance Sheet, Dec 31,
2016 2015
Cash $340,000 $100,000
Accounts Receivable $350,000 $400,000
Inventory $250,000 $300,000
Total Current Assets $940,000 $800,000
Long-lived Assets 1,080,000 1,100,000
Total Assets $2,020,000 $1,900,000
Current Liabilities $200,000 $300,000
Long-term Debt 600,000 500,000
Shareholder Equity 1,220,000 1,100,000
Total Debt and Equity $2,020,000 $1,900,000
Income Statement, for year ended Dec 31,
2016 2015
Sales $4,750,000 $4,500,000
Cost of Sales 4,100,000 4,000,000
Gross Margin 650,000 500,000
Operating Expenses 350,000 400,000
Operating Income 300,000 100,000
Taxes 120,000 40,000
Net Income $180,000 $60,000
Cash Flow From Operations 2016 2015
Net Income $180,000 $60,000
Plus Depreciation Expense 50,000 50,000
+ Decrease (-inc) in AccRec. and Inv. 100,000 -
+ Increase (-dec) in Cur. Liabl. (100,000) -
Cash Flow from Operations $230,000 $110,000
The inventory turnover ratio for 2016 is (rounded):
70. The King Mattress Company had the following operating results for 2015-2016. In
addition, the company paid dividends in both 2015 and 2016 of $60,000 per year and made
capital expenditures in both years of $30,000 per year. The company's stock price in 2015 was $8
and $7 in 2016. The industry average earnings multiple for the mattress industry was 9 in 2016
and the free cash flow and sales multiples were 18 and 1.5, respectively. The company is publicly
owned and has 1,200,000 shares of outstanding stock at the end of 2016.
Balance Sheet, Dec 31,
2016 2015
Cash $340,000 $100,000
Accounts Receivable $350,000 $400,000
Inventory $250,000 $300,000
Total Current Assets $940,000 $800,000
Long-lived Assets 1,080,000 1,100,000
Total Assets $2,020,000 $1,900,000
Current Liabilities $200,000 $300,000
Long-term Debt 600,000 500,000
Shareholder Equity 1,220,000 1,100,000
Total Debt and Equity $2,020,000 $1,900,000
Income Statement, for year ended Dec 31,
2016 2015
Sales $4,750,000 $4,500,000
Cost of Sales 4,100,000 4,000,000
Gross Margin 650,000 500,000
Operating Expenses 350,000 400,000
Operating Income 300,000 100,000
Taxes 120,000 40,000
Net Income $180,000 $60,000
Cash Flow From Operations 2016 2015
Net Income $180,000 $60,000
Plus Depreciation Expense 50,000 50,000
+ Decrease (-inc) in AccRec. and Inv. 100,000 -
+ Increase (-dec) in Cur. Liabl. (100,000) -
Cash Flow from Operations $230,000 $110,000
The current ratio for 2016 is:
71. The King Mattress Company had the following operating results for 2015-2016. In
addition, the company paid dividends in both 2015 and 2016 of $60,000 per year and made
capital expenditures in both years of $30,000 per year. The company's stock price in 2015 was $8
and $7 in 2016. The industry average earnings multiple for the mattress industry was 9 in 2016
and the free cash flow and sales multiples were 18 and 1.5, respectively. The company is publicly
owned and has 1,200,000 shares of outstanding stock at the end of 2016.
Balance Sheet, Dec 31,
2016 2015
Cash $340,000 $100,000
Accounts Receivable $350,000 $400,000
Inventory $250,000 $300,000
Total Current Assets $940,000 $800,000
Long-lived Assets 1,080,000 1,100,000
Total Assets $2,020,000 $1,900,000
Current Liabilities $200,000 $300,000
Long-term Debt 600,000 500,000
Shareholder Equity 1,220,000 1,100,000
Total Debt and Equity $2,020,000 $1,900,000
Income Statement, for year ended Dec 31,
2016 2015
Sales $4,750,000 $4,500,000
Cost of Sales 4,100,000 4,000,000
Gross Margin 650,000 500,000
Operating Expenses 350,000 400,000
Operating Income 300,000 100,000
Taxes 120,000 40,000
Net Income $180,000 $60,000
Cash Flow From Operations 2016 2015
Net Income $180,000 $60,000
Plus Depreciation Expense 50,000 50,000
+ Decrease (-inc) in AccRec. and Inv. 100,000 -
+ Increase (-dec) in Cur. Liabl. (100,000) -
Cash Flow from Operations $230,000 $110,000
The gross margin percentage for 2016 is (rounded):


72. The King Mattress Company had the following operating results for 2015-2016. In
addition, the company paid dividends in both 2015 and 2016 of $60,000 per year and made
capital expenditures in both years of $30,000 per year. The company's stock price in 2015 was $8
and $7 in 2016. The industry average earnings multiple for the mattress industry was 9 in 2016
and the free cash flow and sales multiples were 18 and 1.5, respectively. The company is publicly
owned and has 1,200,000 shares of outstanding stock at the end of 2016.
Balance Sheet, Dec 31,
2016 2015
Cash $340,000 $100,000
Accounts Receivable $350,000 $400,000
Inventory $250,000 $300,000
Total Current Assets $940,000 $800,000
Long-lived Assets 1,080,000 1,100,000
Total Assets $2,020,000 $1,900,000
Current Liabilities $200,000 $300,000
Long-term Debt 600,000 500,000
Shareholder Equity 1,220,000 1,100,000
Total Debt and Equity $2,020,000 $1,900,000
Income Statement, for year ended Dec 31,
2016 2015
Sales $4,750,000 $4,500,000
Cost of Sales 4,100,000 4,000,000
Gross Margin 650,000 500,000
Operating Expenses 350,000 400,000
Operating Income 300,000 100,000
Taxes 120,000 40,000
Net Income $180,000 $60,000
Cash Flow From Operations 2016 2015
Net Income $180,000 $60,000
Plus Depreciation Expense 50,000 50,000
+ Decrease (-inc) in AccRec. and Inv. 100,000 -
+ Increase (-dec) in Cur. Liabl. (100,000) -
Cash Flow from Operations $230,000 $110,000
Return on assets for 2016 is (rounded):

73. The King Mattress Company had the following operating results for 2015-2016. In
addition, the company paid dividends in both 2015 and 2016 of $60,000 per year and made
capital expenditures in both years of $30,000 per year. The company's stock price in 2015 was $8
and $7 in 2016. The industry average earnings multiple for the mattress industry was 9 in 2016
and the free cash flow and sales multiples were 18 and 1.5, respectively. The company is publicly
owned and has 1,200,000 shares of outstanding stock at the end of 2016.
Balance Sheet, Dec 31,
2016 2015
Cash $340,000 $100,000
Accounts Receivable $350,000 $400,000
Inventory $250,000 $300,000
Total Current Assets $940,000 $800,000
Long-lived Assets 1,080,000 1,100,000
Total Assets $2,020,000 $1,900,000
Current Liabilities $200,000 $300,000
Long-term Debt 600,000 500,000
Shareholder Equity 1,220,000 1,100,000
Total Debt and Equity $2,020,000 $1,900,000
Income Statement, for year ended Dec 31,
2016 2015
Sales $4,750,000 $4,500,000
Cost of Sales 4,100,000 4,000,000
Gross Margin 650,000 500,000
Operating Expenses 350,000 400,000
Operating Income 300,000 100,000
Taxes 120,000 40,000
Net Income $180,000 $60,000
Cash Flow From Operations 2016 2015
Net Income $180,000 $60,000
Plus Depreciation Expense 50,000 50,000
+ Decrease (-inc) in AccRec. and Inv. 100,000 -
+ Increase (-dec) in Cur. Liabl. (100,000) -
Cash Flow from Operations $230,000 $110,000
Return on equity for 2016 is (rounded):


74. The King Mattress Company had the following operating results for 2015-2016. In
addition, the company paid dividends in both 2015 and 2016 of $60,000 per year and made
capital expenditures in both years of $30,000 per year. The company's stock price in 2015 was $8
and $7 in 2016. The industry average earnings multiple for the mattress industry was 9 in 2016
and the free cash flow and sales multiples were 18 and 1.5, respectively. The company is publicly
owned and has 1,200,000 shares of outstanding stock at the end of 2016.
Balance Sheet, Dec 31,
2016 2015
Cash $340,000 $100,000
Accounts Receivable $350,000 $400,000
Inventory $250,000 $300,000
Total Current Assets $940,000 $800,000
Long-lived Assets 1,080,000 1,100,000
Total Assets $2,020,000 $1,900,000
Current Liabilities $200,000 $300,000
Long-term Debt 600,000 500,000
Shareholder Equity 1,220,000 1,100,000
Total Debt and Equity $2,020,000 $1,900,000
Income Statement, for year ended Dec 31,
2016 2015
Sales $4,750,000 $4,500,000
Cost of Sales 4,100,000 4,000,000
Gross Margin 650,000 500,000
Operating Expenses 350,000 400,000
Operating Income 300,000 100,000
Taxes 120,000 40,000
Net Income $180,000 $60,000
Cash Flow From Operations 2016 2015
Net Income $180,000 $60,000
Plus Depreciation Expense 50,000 50,000
+ Decrease (-inc) in AccRec. and Inv. 100,000 -
+ Increase (-dec) in Cur. Liabl. (100,000) -
Cash Flow from Operations $230,000 $110,000
The value of the company, calculated using the earnings multiple for 2016 is:
75. The King Mattress Company had the following operating results for 2015-2016. In
addition, the company paid dividends in both 2015 and 2016 of $60,000 per year and made
capital expenditures in both years of $30,000 per year. The company's stock price in 2015 was $8
and $7 in 2016. The industry average earnings multiple for the mattress industry was 9 in 2016
and the free cash flow and sales multiples were 18 and 1.5, respectively. The company is publicly
owned and has 1,200,000 shares of outstanding stock at the end of 2016.
Balance Sheet, Dec 31,
2016 2015
Cash $340,000 $100,000
Accounts Receivable $350,000 $400,000
Inventory $250,000 $300,000
Total Current Assets $940,000 $800,000
Long-lived Assets 1,080,000 1,100,000
Total Assets $2,020,000 $1,900,000
Current Liabilities $200,000 $300,000
Long-term Debt 600,000 500,000
Shareholder Equity 1,220,000 1,100,000
Total Debt and Equity $2,020,000 $1,900,000
Income Statement, for year ended Dec 31,
2016 2015
Sales $4,750,000 $4,500,000
Cost of Sales 4,100,000 4,000,000
Gross Margin 650,000 500,000
Operating Expenses 350,000 400,000
Operating Income 300,000 100,000
Taxes 120,000 40,000
Net Income $180,000 $60,000
Cash Flow From Operations 2016 2015
Net Income $180,000 $60,000
Plus Depreciation Expense 50,000 50,000
+ Decrease (-inc) in AccRec. and Inv. 100,000 -
+ Increase (-dec) in Cur. Liabl. (100,000) -
Cash Flow from Operations $230,000 $110,000
The value of the company, calculated using the free cash flow multiple for 2016 is:


