123. T-shirts R Us Inc. operates two divisions that each manufactures t-shirts for universities.
Each division has its own manufacturing facility. The historical-cost accounting system reports
the following financial data for 2016.
Atlantic Coast Division
Condensed Income Statement Data
(000s)
Revenues $600
Operating Costs 470
Operating Income $130
Big-10 Division
Condensed Income Statement Data
(000s)
Revenues $600
Operating Costs 400
Operating Income $200
T-shirts R Us Inc. estimates the useful life of each manufacturing facility to be 15 years. The
company uses straight line depreciation, with a depreciation charge of $70,000 per year for each
division and no salvage value at the end of 15 years. The manufacturing facility is the only long–
lived asset of either division. Current assets are $300,000 in each division. At the end of 2016 the
Atlantic Coast Division is 4 years old and the Big-10 Division is 6 years old. An index of
construction costs, replacement cost, and liquidation values for manufacturing facilities used in
the production of t-shirts for the 7-year period that T-shirts R Us Inc. has been operating, are as
follows:
Liquidation Value

Year
Cost Index Replacement
Cost Atlantic
Coast
Big 10
2010 80 $1,000,000 $800,000 $800,000
2011 82 1,000,000 800,000 800,000
2012 84 1,100,000 700,000 700,000
2013 89 1,150,000 700,000 600,000
2014 94 1,200,000 800,000 600,000
2015 96 1,250,000 900,000 600,000
2016 100 1,300,000 1,000,000 500,000

Required:
Round answers to 2 decimal places where appropriate.
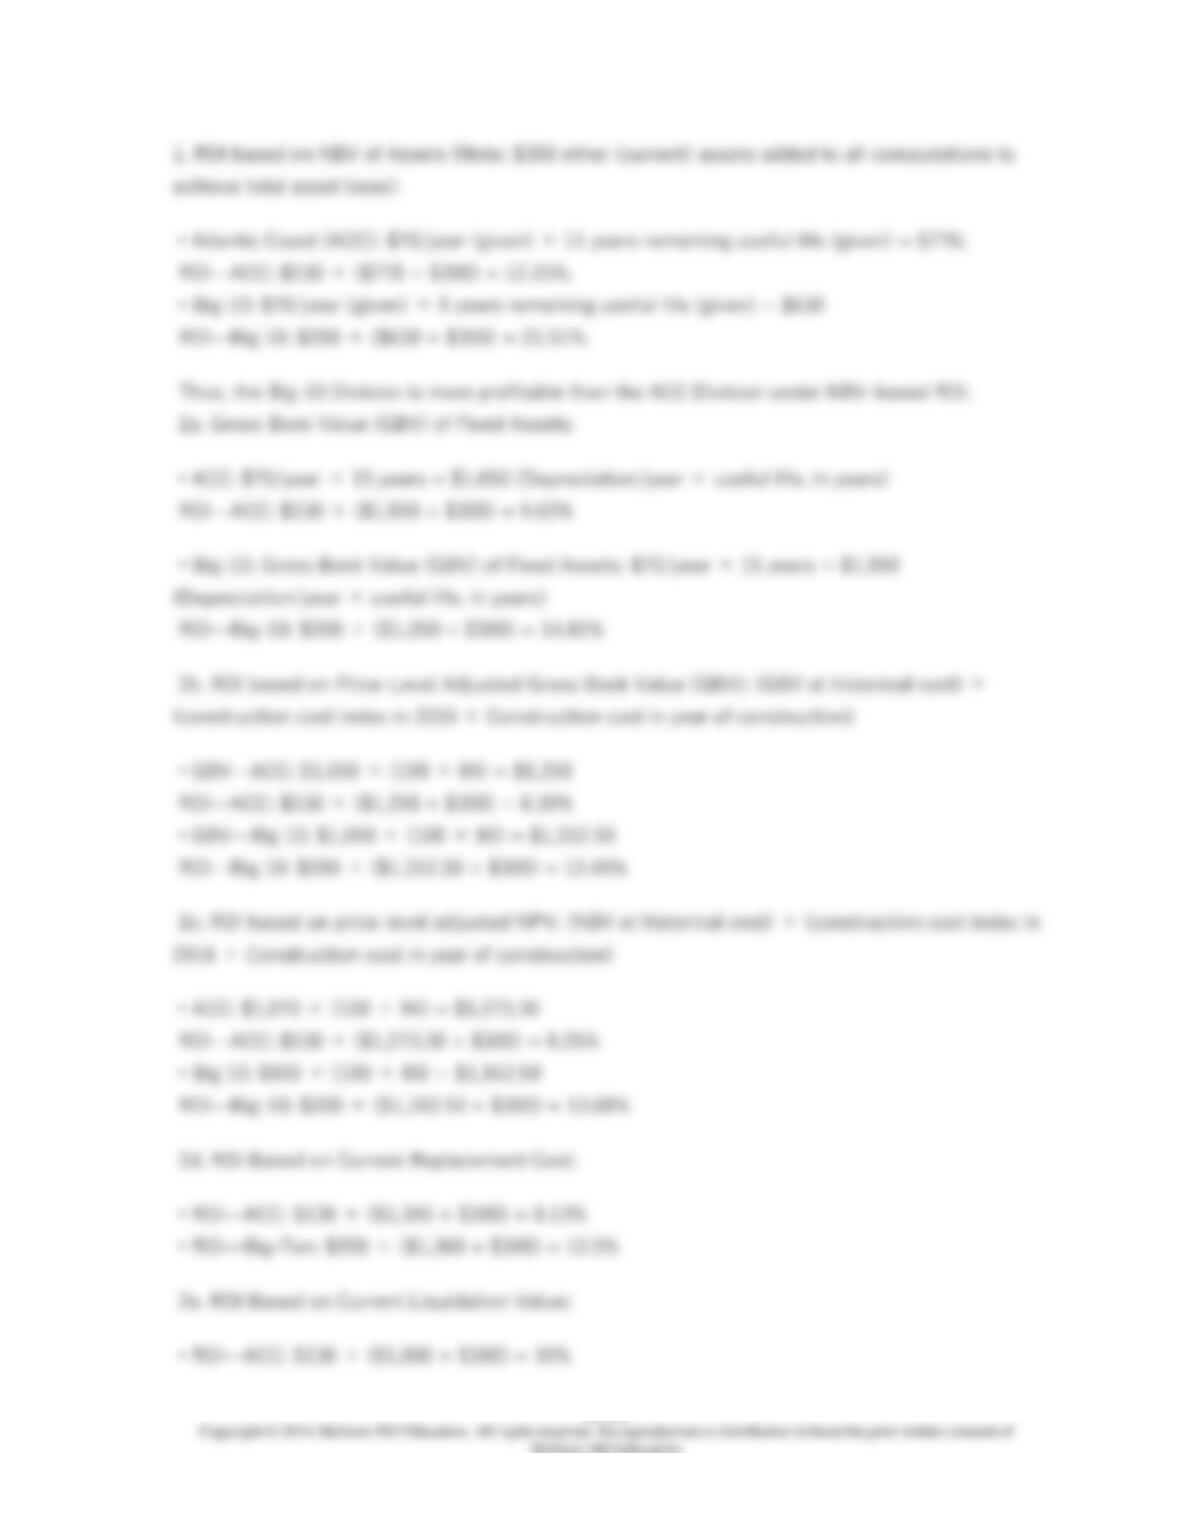
1. Compute return on investment (ROI) for each division using net book value (NBV). Interpret
the results.
2. Compute return on investment (ROI) for each division, incorporating current–cost estimates as
follows, using:
(a) Gross book values (GBV) under historical cost;
(b) GBV at historical cost restated to current cost using the index of construction costs;
(c) NBV of long-lived assets restated at current cost using the index of construction costs (the
facility was constructed the year before the first year of use);
(d) Current replacement cost; and
(e) Current liquidation value.
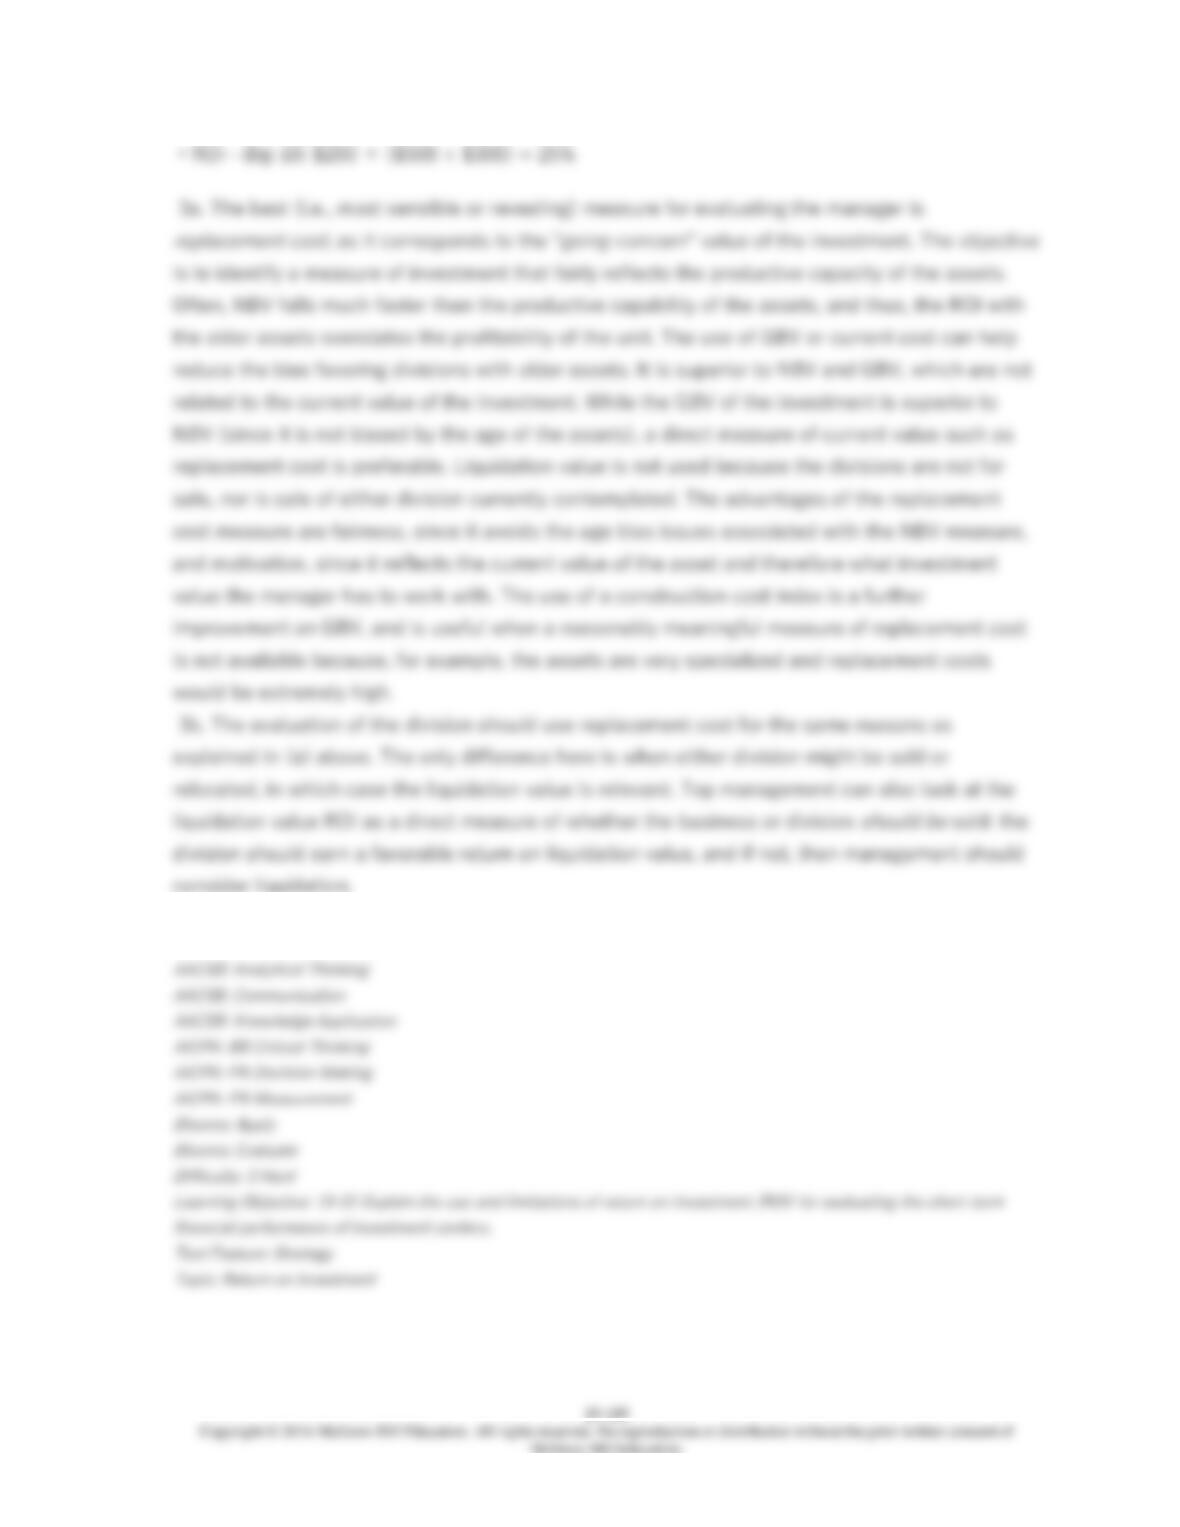
3. Which of the measures calculated in (2) above would you choose for (a) performance
evaluation of each division manager, and (b) deciding which division is most profitable for the
overall firm? What are the strategic advantages and disadvantages to the firm of each measure
for both (a) and (b)?

124. Domi Products, a multi-divisional manufacturing company, measures performance and
awards bonuses to division managers based upon divisional operating income. Under the current
bonus plan, common company-wide operating expenses are allocated evenly to all five of its
divisions. For example, if rent were $50,000, each division would be charged $10,000. In planning
next year’s budget, corporate management has requested that the division managers recommend
how common expenses should be distributed to the divisions. The division managers met and
jointly developed an incentive plan that would more equitably distribute common expenses on the
basis of resources used and that would measure each division manager’s performance based on
return on assets (ROI), with divisional bonuses based on a target ROI. They jointly presented
their recommendation to corporate management.
Required:
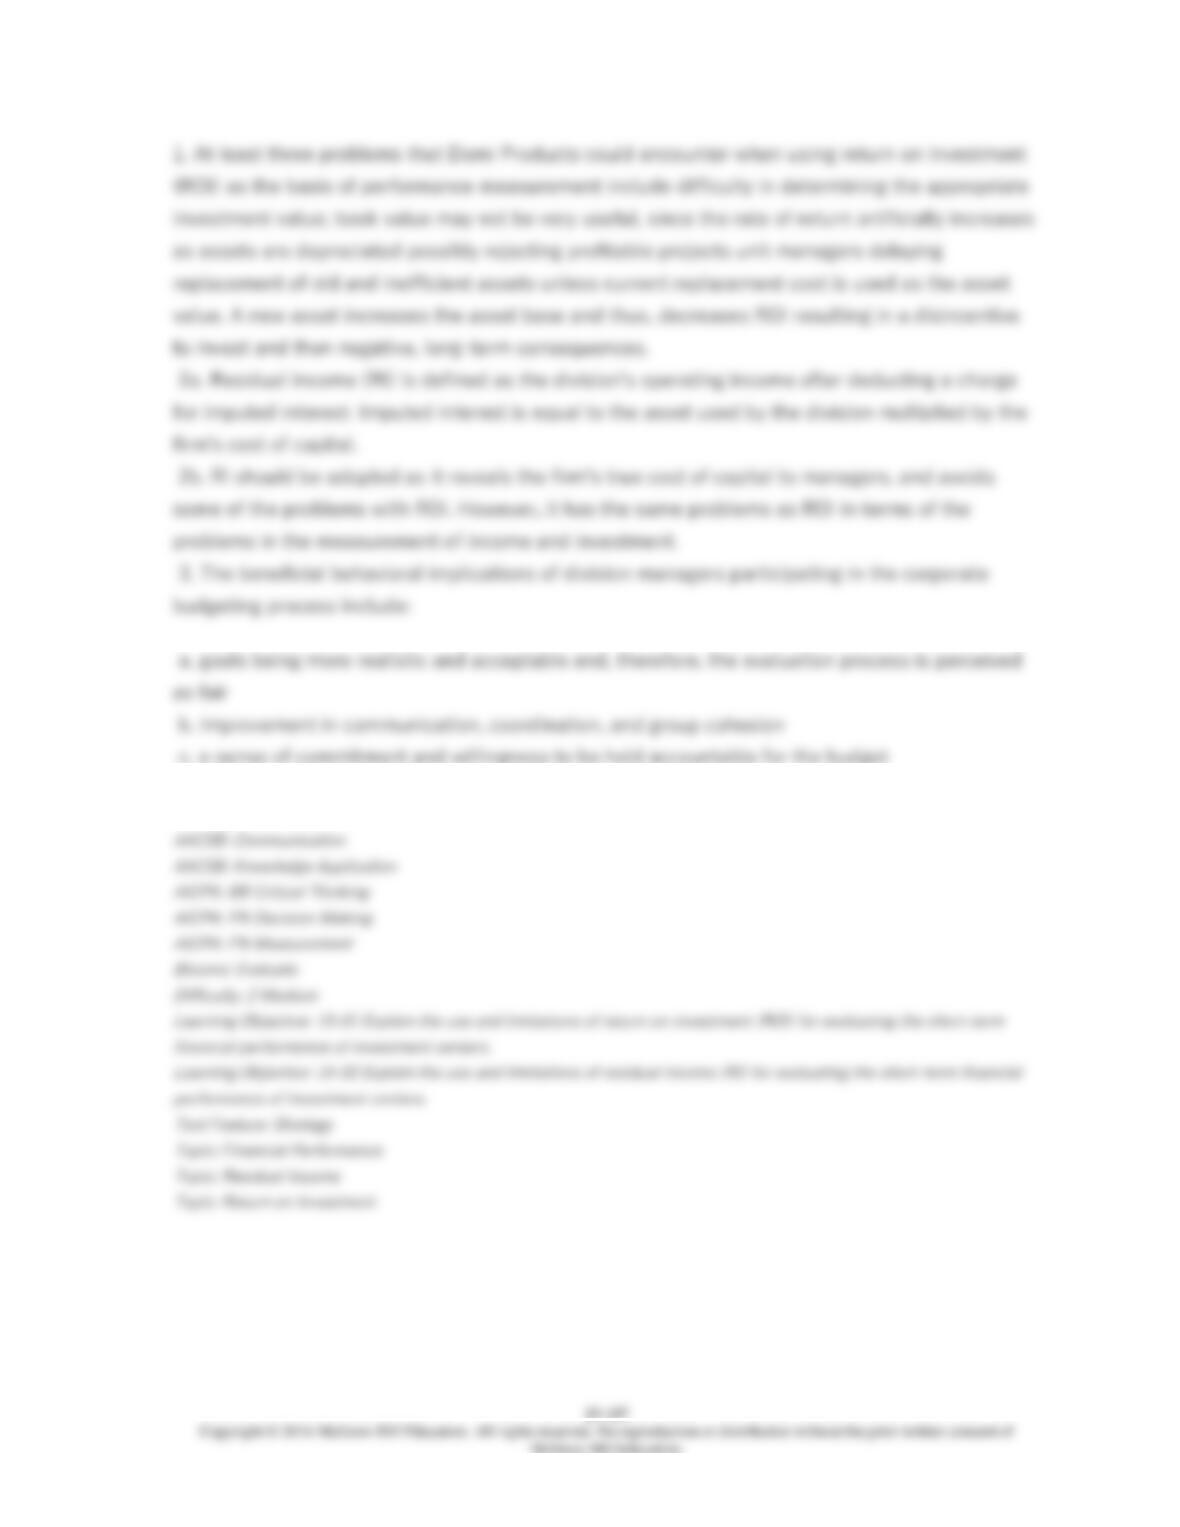
1. Describe at least three problems that Domi Products could encounter when using return on
investment (ROI) as the basis of performance measurement.
2a. Define the residual income (RI) approach to segment performance measurement.
2b. Determine if Domi Products should implement this approach instead of the ROI approach.
3. Discuss the behavioral implications of the division managers’ involvement in the corporate
budgeting process, and the decision to more equitably allocate common costs.
125. Eikelberry, Inc. has the following financial results for 2016 for its three regional divisions:
Current Cost
Region
Income Net Book
Value Gross
Book Value Replacement
Cost Liquidation
Value
FINANCIAL DATA
North Atlantic $45,000 $225,000 $450,600
$990,000 $350,000
Mid Atlantic 33,000 289,000 310,000 380,000
445,000
South Atlantic 22,000 115,000 166,000 650,000
980,000
Required:
126. Edwards Inc. manufactures electronics. It consists of several divisions classified as
investment centers for performance-evaluation purposes. Division A desires to purchase
materials from Division B at a price of $85 per unit. Division B can produce 25,000 units at full
capacity, and is currently operating at 90% capacity with a variable cost of $80 per unit. Division
B currently sells only to outside customers who pay $115 per unit. Division A pays an outside
company $110 per unit. If purchased from Division B, B’s variable costs per unit would be $10
less because the division would save on marketing expenses for these internal transfers. Division
A requires 10,000 units.
Required:
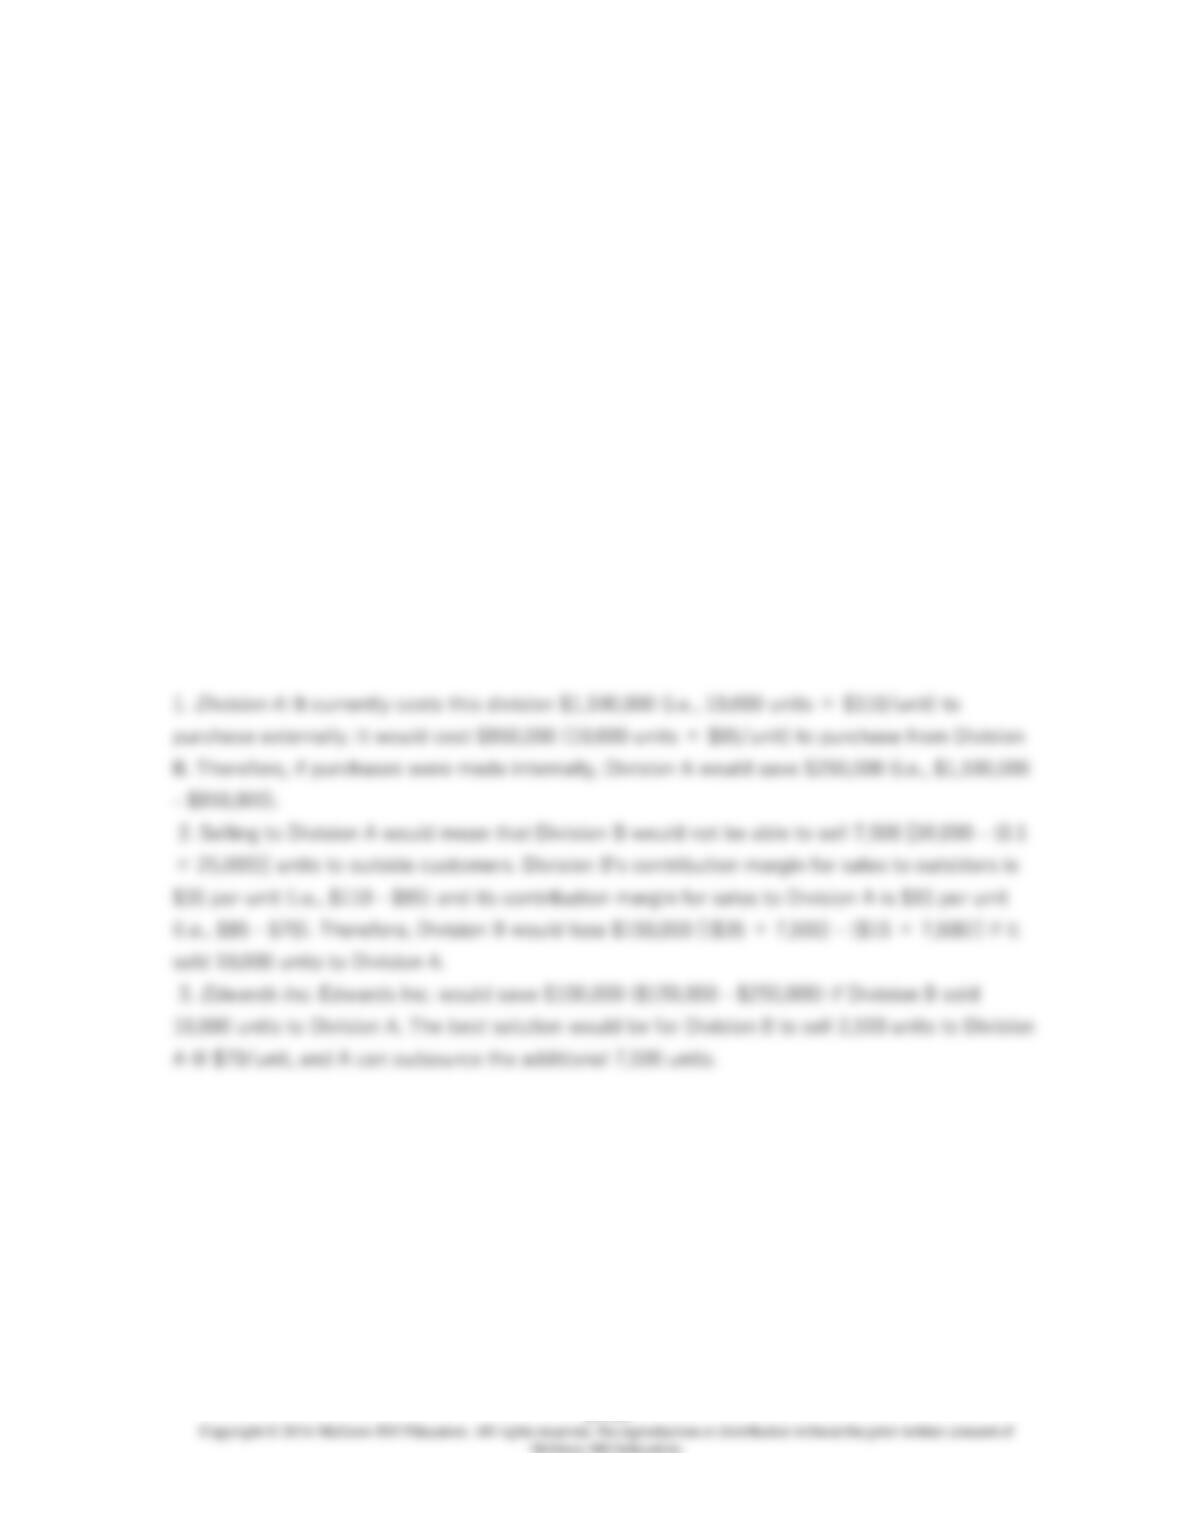
1. How would Division B selling to Division A affect Division A’s purchasing costs?
2. How would intercompany sales affect Division B?
3. What solution would be best for Edwards Inc., assuming Division B has the ability to operate
at full capacity?
127. Max Ltd. produces kitchen tools, and operates several divisions as investment centers.
Division M produces a product that it sells to other companies for $16 per unit. It is currently
operating at its full capacity of 45,000 units per year. Variable manufacturing cost is $9 per unit,
and variable marketing cost is $3 per unit. The company wishes to create a new division, Division
N, to produce an innovative new tool that requires the use of Division B’s product (or one very
similar). Division N will produce 30,000 units per year. Currently, Division N can purchase a
product equivalent to Division M’s from Company X for $15 per unit. However, Max Ltd. is
considering transferring the necessary product from Division M.
Required:
1. Assume the transfer price is $12 per unit:
a. How would this price affect the purchasing costs of Division N?
b. How would this price affect the profits of Division M?
c. How would this price affect Max Ltd. as a whole?
2. What if the transfer price was $13 per unit?
128. Pearl Inc. has the following financial results for 2016 for its three regional divisions:
Historical Cost Estimated Current Cost
Region Operating Income
NBV
GBV Replacement Cost Liquidation Value
Northeast $50,000 $100,000 $150,000 $750,000 $500,000
Midwest $80,000 $300,000 $400,000 $500,000 300,000
Southeast $90,000 $400,000 $500,000 $900,000 950,000
Required:
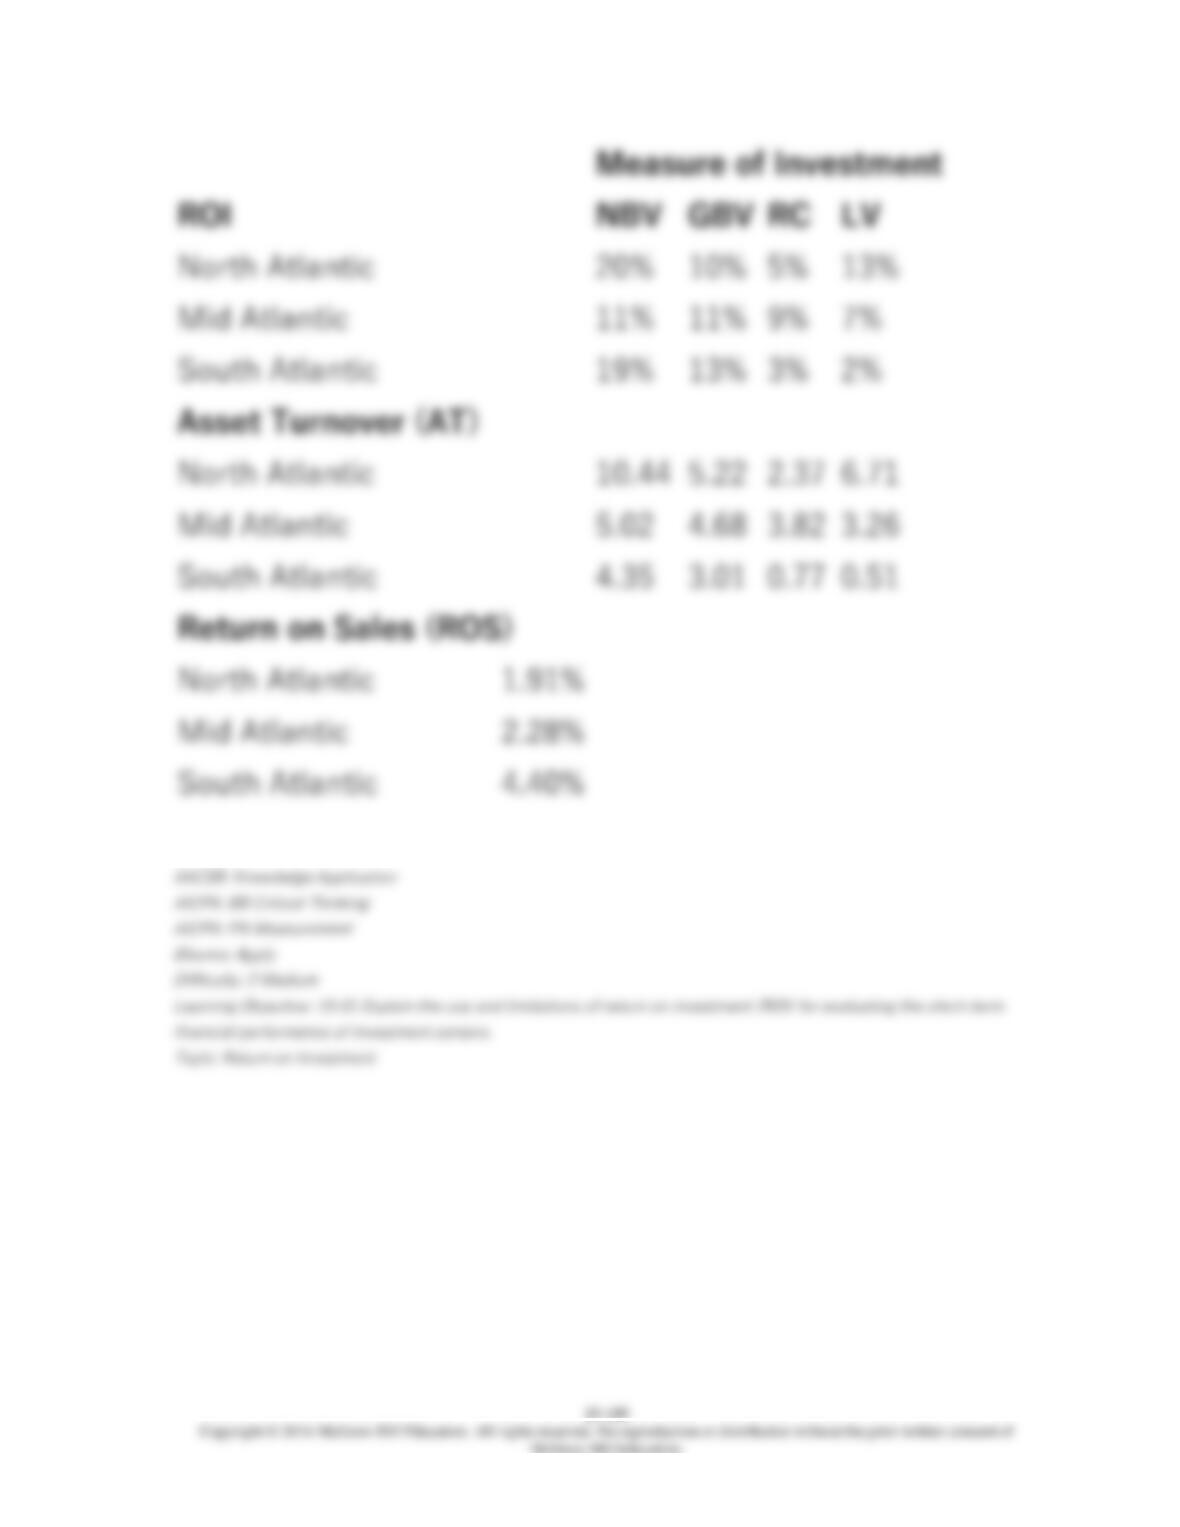
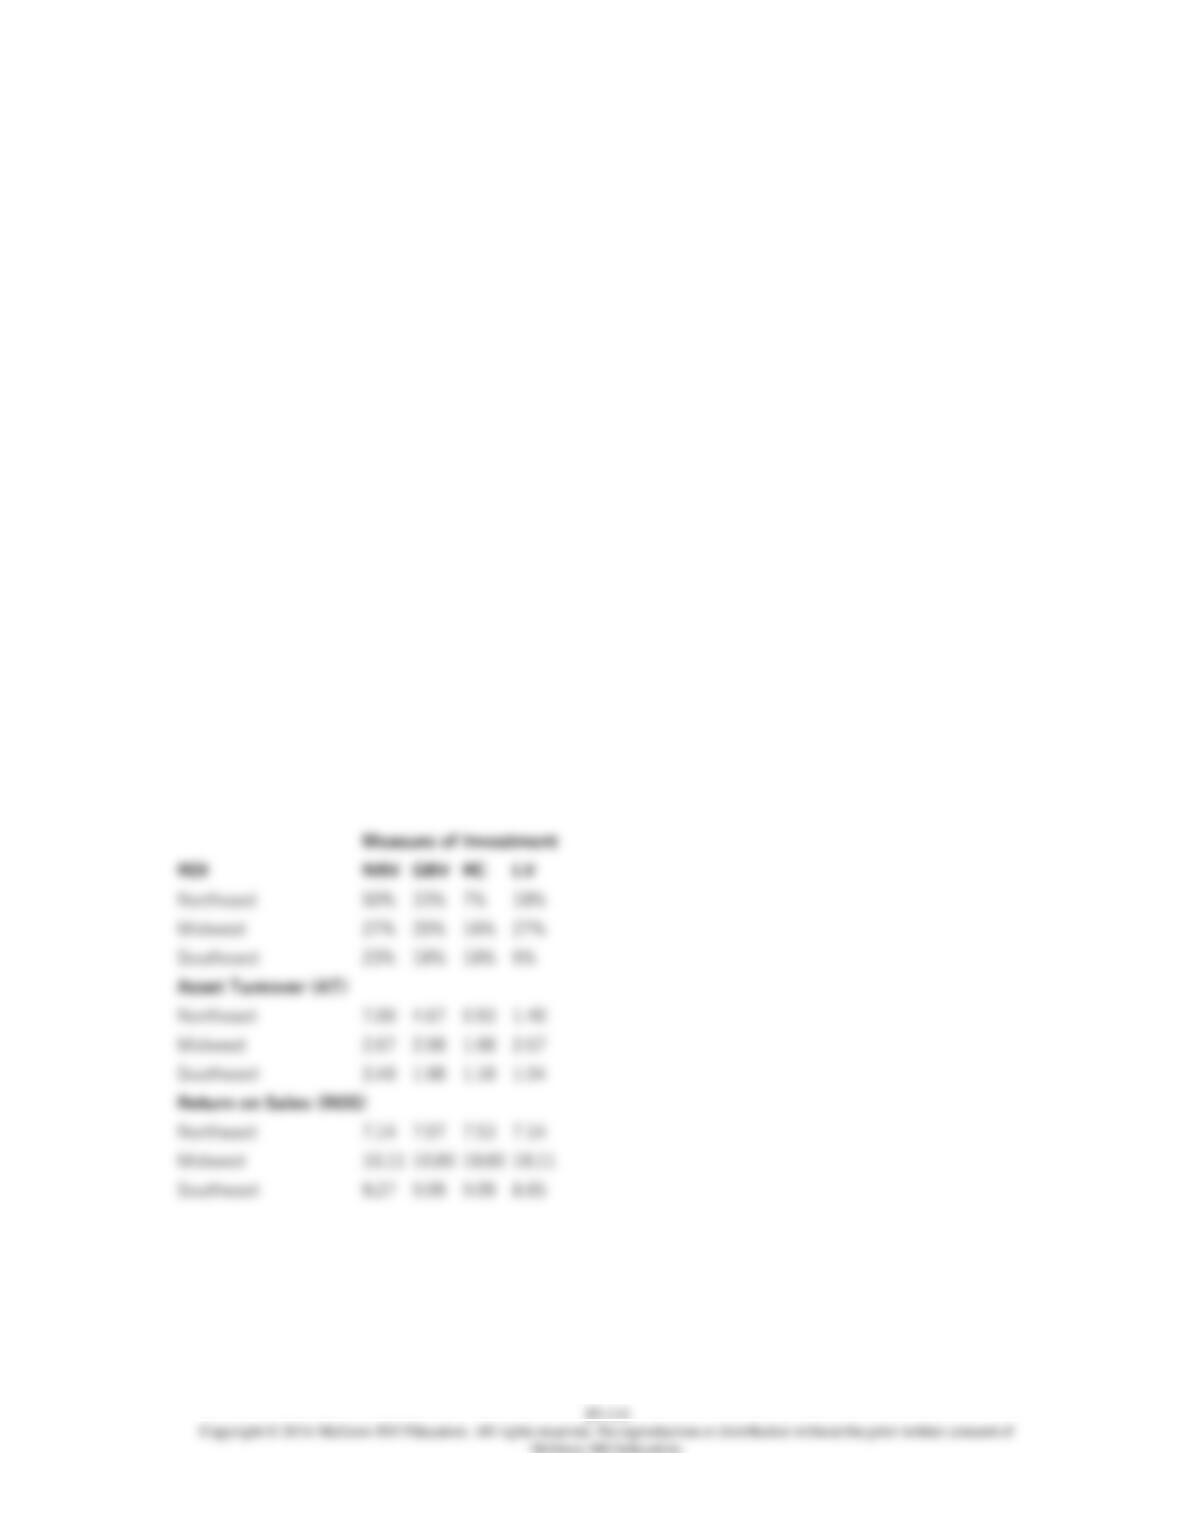
Calculate return on investment (ROI), asset turnover (AT), and return on sales (ROS) for each
division for 2016. The sales in the Northeast, Midwest, and Southeast regions are $700,000,
$800,000, and $990,000, respectively. Calculate ROI and AT for each of the four measures of
investment (i.e., NBV (net book value), GBV (gross book value), Replacement Cost, and
Liquidation Value). Round all answers except ROI to 2 decimal places (e.g., 0.12522 becomes
12.52%); round ROI to whole percentage amounts, e.g., 0.1998 becomes 20%.
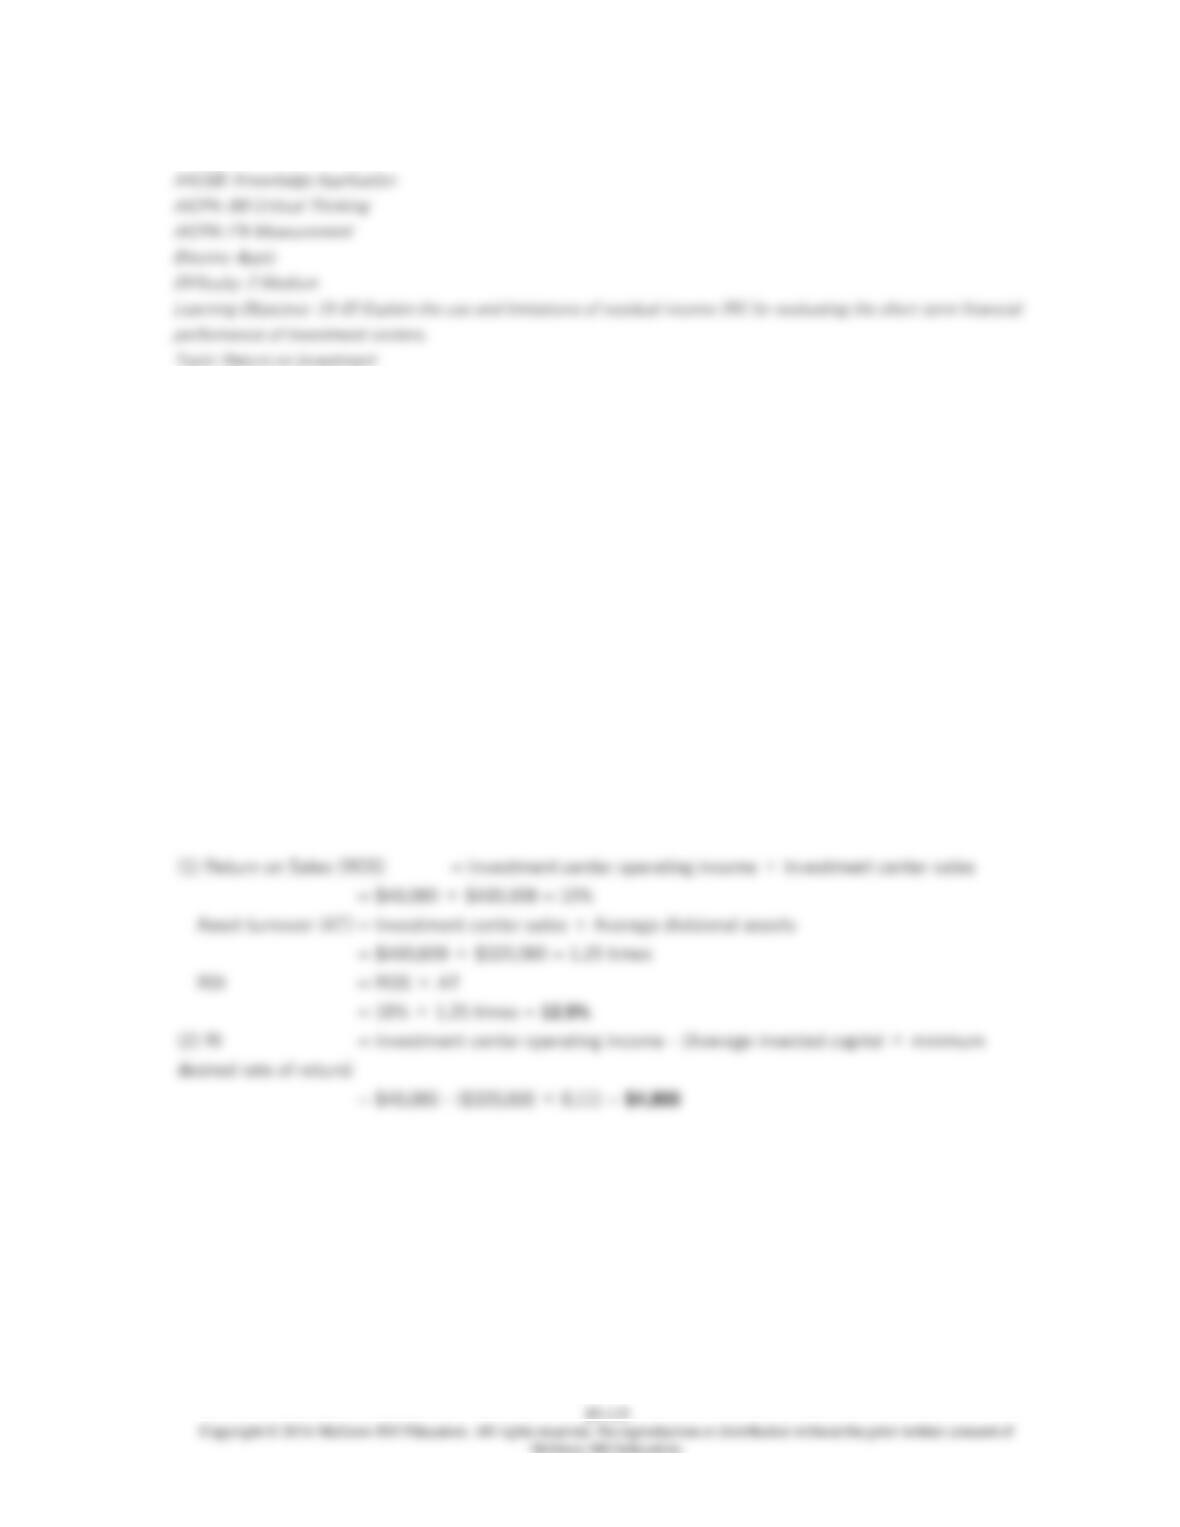
129. Selected data from one of the investment centers from Jones Company are as follows:
Sales $400,000
Average divisional assets $320,000
Divisional operating income $40,000
Minimum rate of return 11%
Required:
1. Calculate return on investment (ROI), including each of the two component measures of ROI.
2. Calculate residual income (RI).
130. Brown’s Mill has two operating units, each of which is considered an investment center
for evaluation purposes. The Cutting Division of the mill prepares timber at its sawmills.
Afterwards, the Assembly Division prepares the cut lumber into finished wood, to be sold to
furniture manufacturers. During the most recent year, the Cutting Division produced 120,000
cords of wood, at a total cost of $1,320,000. The entire output was transferred to the Assembly
Division, where additional costs of $6 per cord were incurred. The 1,200,000 board-feet of
finished wood were then sold in the open market for $5,000,000.
Required:
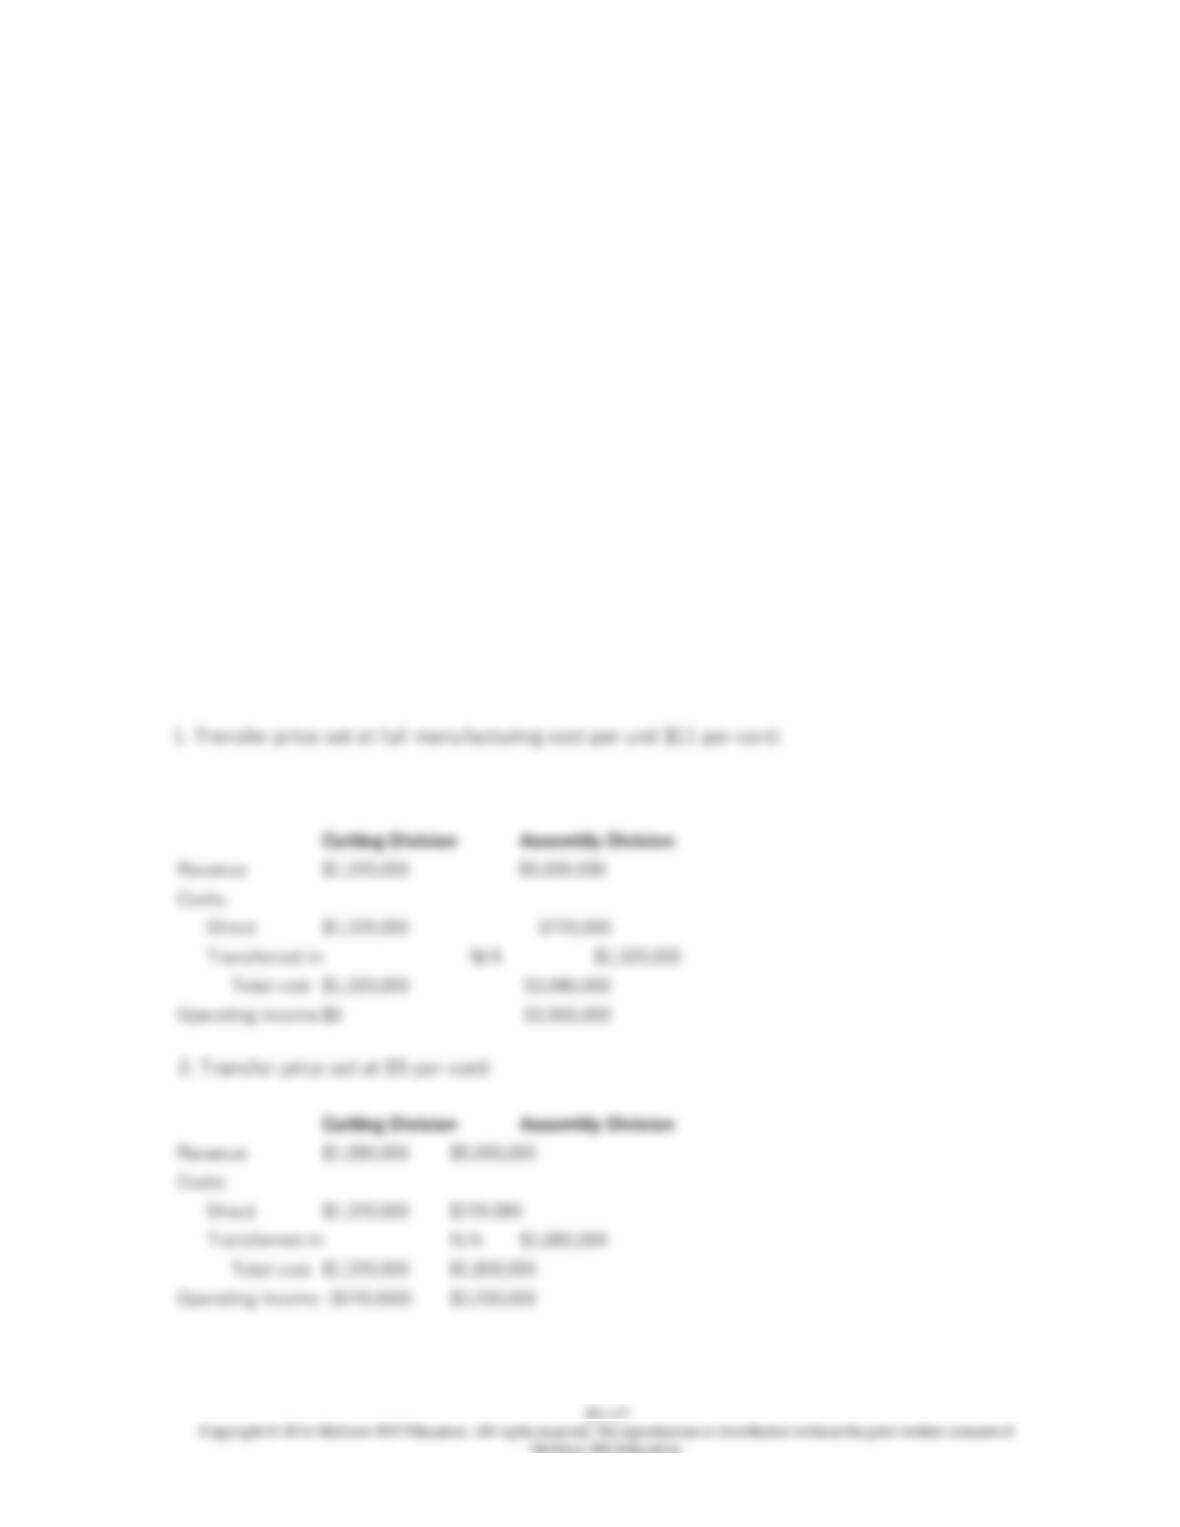
1. Determine the operating income for each division if the transfer price from the Cutting
Division to the Assembly Division is set at full production cost, $11 per cord.
2. Determine the operating income for each division if the transfer price is set at $9 per cord.
3. Since the Cutting Division sells all of its output internally, does the manager care about what
price is charged? Why? Should the Cutting Division in this case be considered a cost center or
a(n) profit/investment center?
131. Simmons Bedding Company manufactures an array of bedding-related products,
including pillows. The Cover Division of Simmons makes covers, while the Assembly Division of
the company produces finished pillows. The covers can be sold separately for $10.00 a piece,
while the pillows sell for $12.00 per unit. For performance-evaluation purposes, these two
divisions are treated as investment centers. Financial results from the most recent accounting
period are as follows:
Division
Division
Traceable manufacturing costs
External sales
Market value of output transferred from Cover Division to the Assembly Division
$6,000,000
Required:
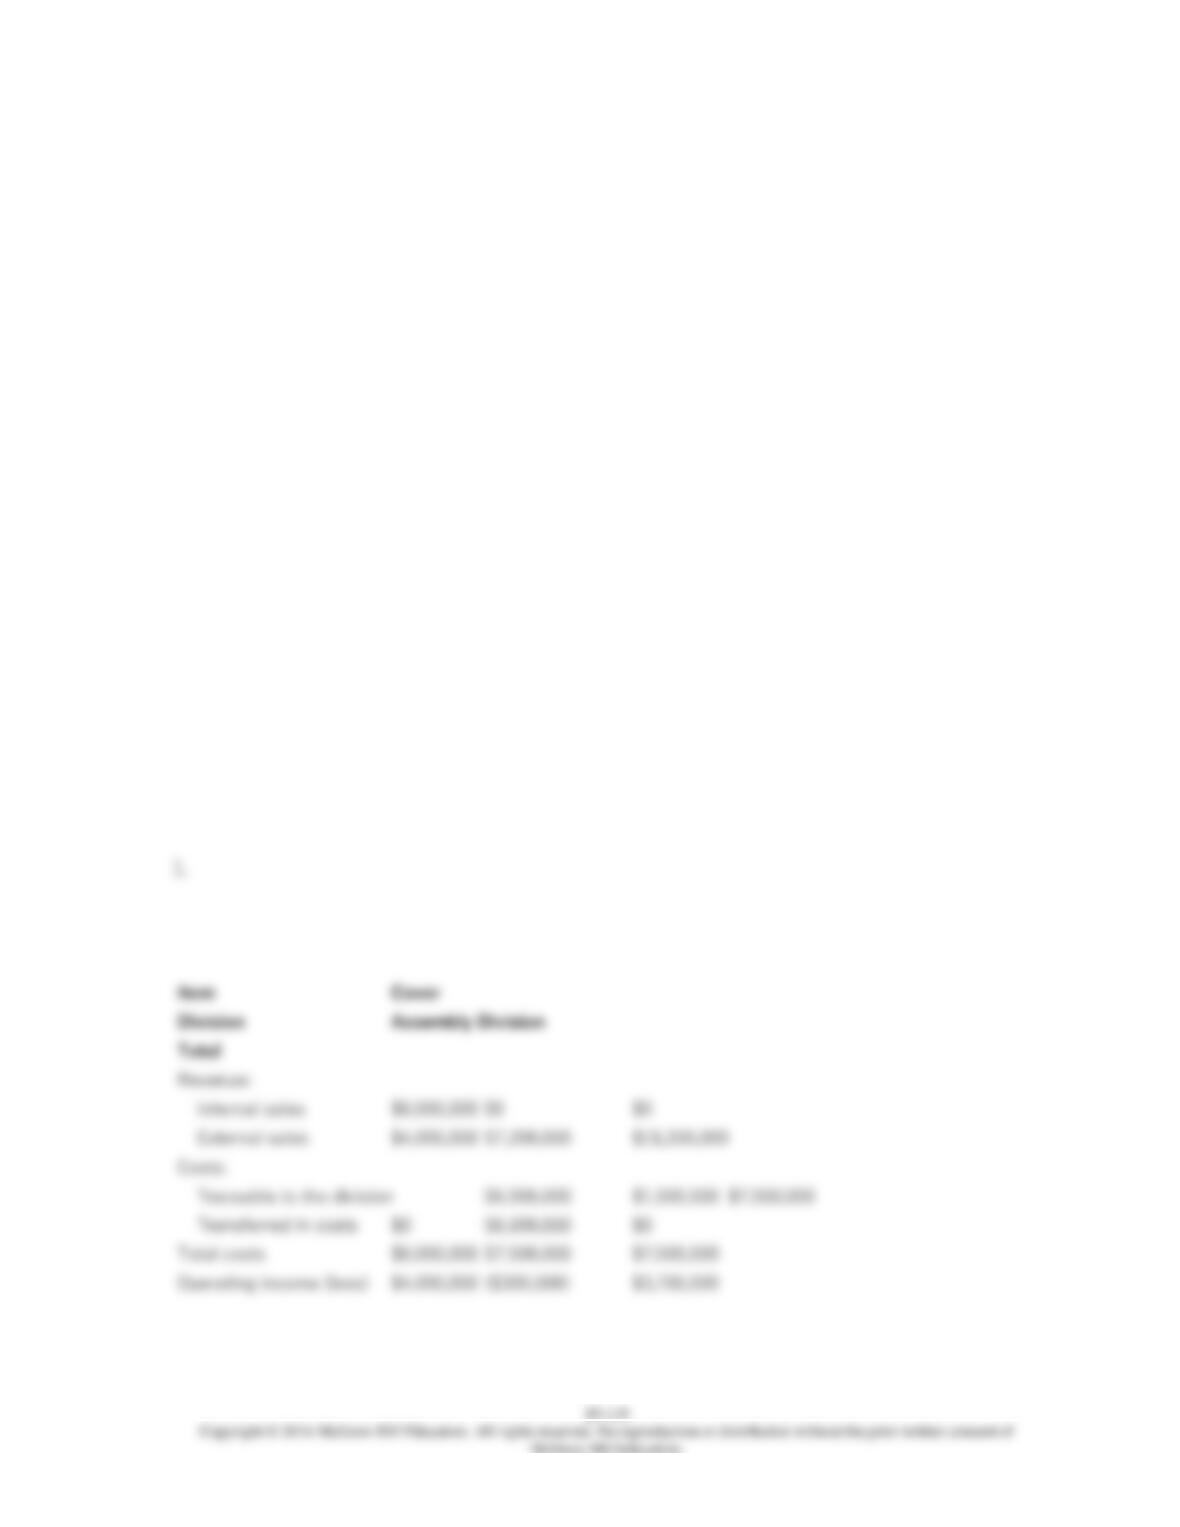
1. What is the operating income for each of the two divisions and for the company as a whole?
(Use market value as the transfer price.)
2. Do you think each of the two divisional managers is happy with this transfer-pricing method?
Explain.