
139. Six Sigma is one approach for setting quality expectations for a given process or output.
As pointed out in Chapter 17 of your text, the term “Six Sigma” comes from statistics: in a normal
distribution, the area (probability) outside of +/– six standard deviations from the mean value is
exceedingly small. You are provided the following values from a standardized normal distribution
(i.e., a mean of zero and a standard deviation of 1):
Z p
0.00 0.50000000
1.00 0.15870000
1.50 0.06681000
1.75 0.04006000
2.00 0.02275000
2.50 0.00621000
3.00 0.00135000
3.50 0.00023270
4.00 0.00003169
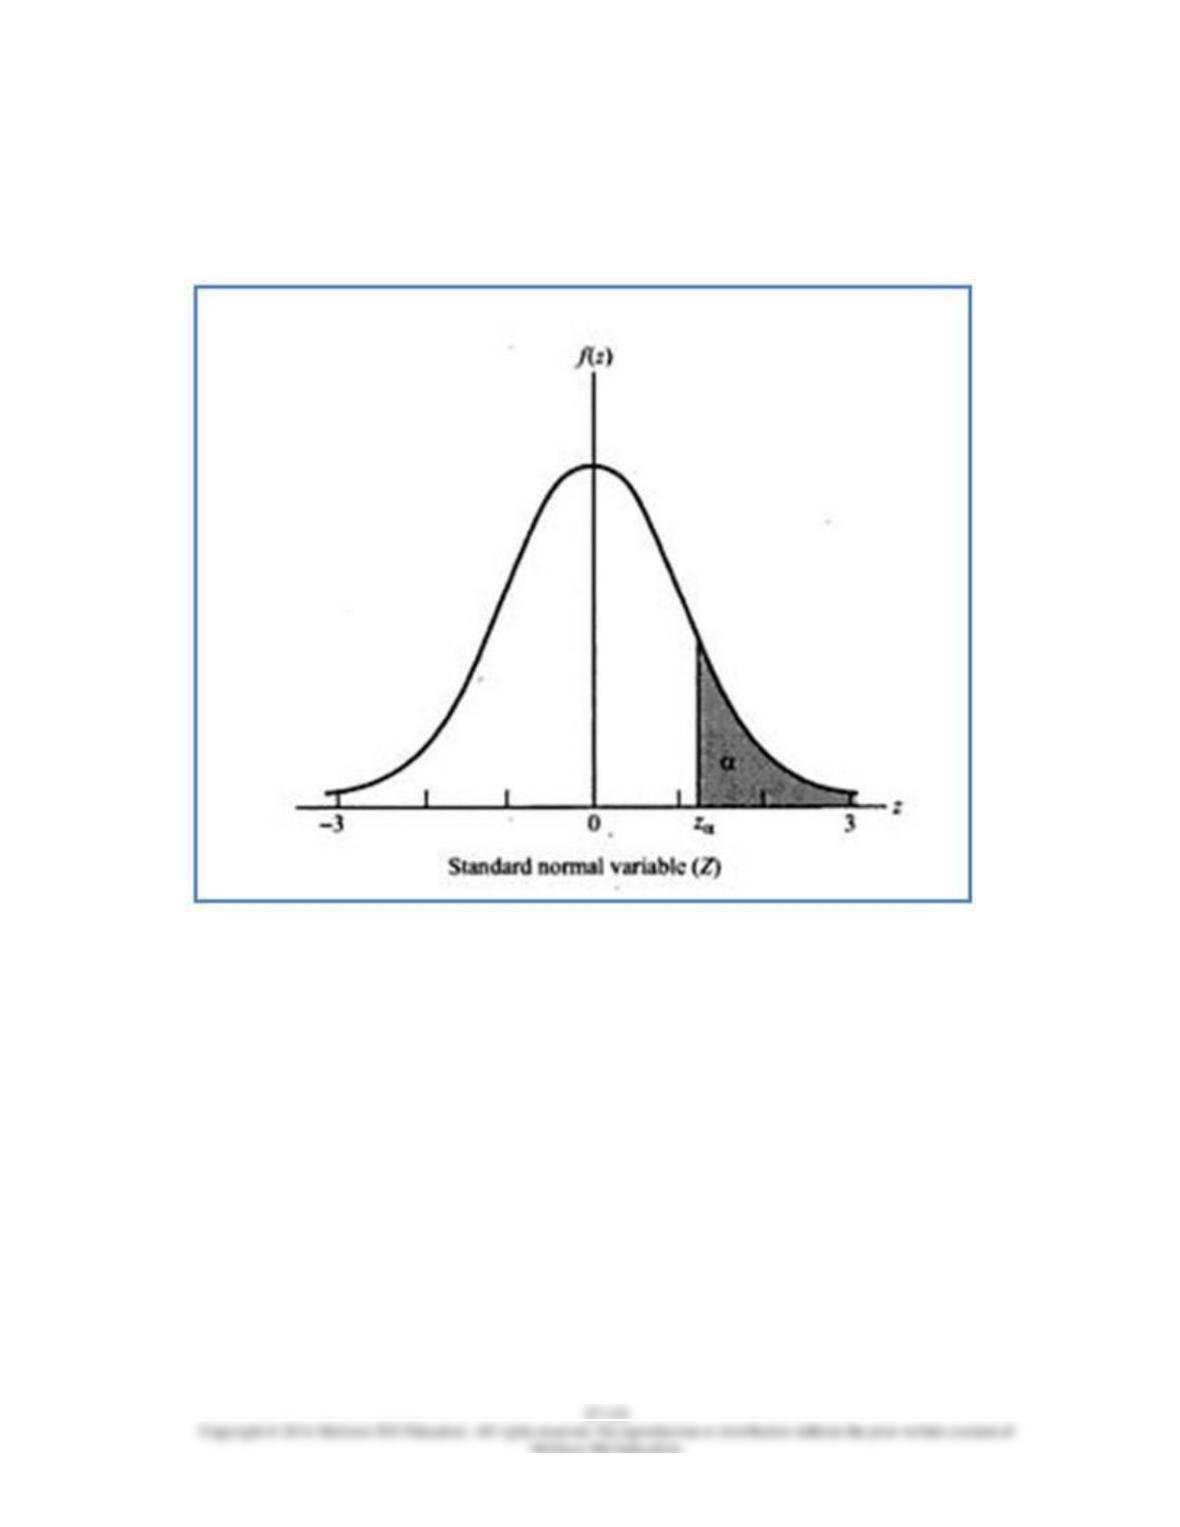
Note: The Z values in the above table refer to the number of sigmas to the right of center (i.e., to
the right of Z = 0). The listed probabilities,
p
, refer to the area to the
right
of the chosen Z point,
as illustrated by the graph below:
Required:
1. Given the above, what is the probability for a 1-sigma performance level? How many defects
might we expect for a process that is operating at 1-sigma level?
2. Redo #1 above, but this time for a 3-sigma level. What is the percentage increase in quality
expected under a 3-sigma performance level compared to a 1-sigma level?
3. Redo #1 above, but this time for a 4-sigma level. Also, what is the anticipated percentage
improvement in quality when moving from a 3-sigma to a 4-sigma performance level?
140. In an effort to improve its competitive position, J. J. Borden Company recently introduced
Just–in-Time (JIT) production techniques. Its management accountant assembled the following
data regarding the recent change:
Item Prior to JIT After JIT Implementation
Production cycle time 68 days 30 days
Inventory level $160,000 $40,000
Total sales $1,260,000 $1,700,000
Estimated cost data, % of sales:
Direct materials 30% 20%
Direct labor 22% 15%
Variable overhead 28% 10%
Fixed overhead 12% 5%
Inventory financing cost is estimated as 15% per year.
Required:
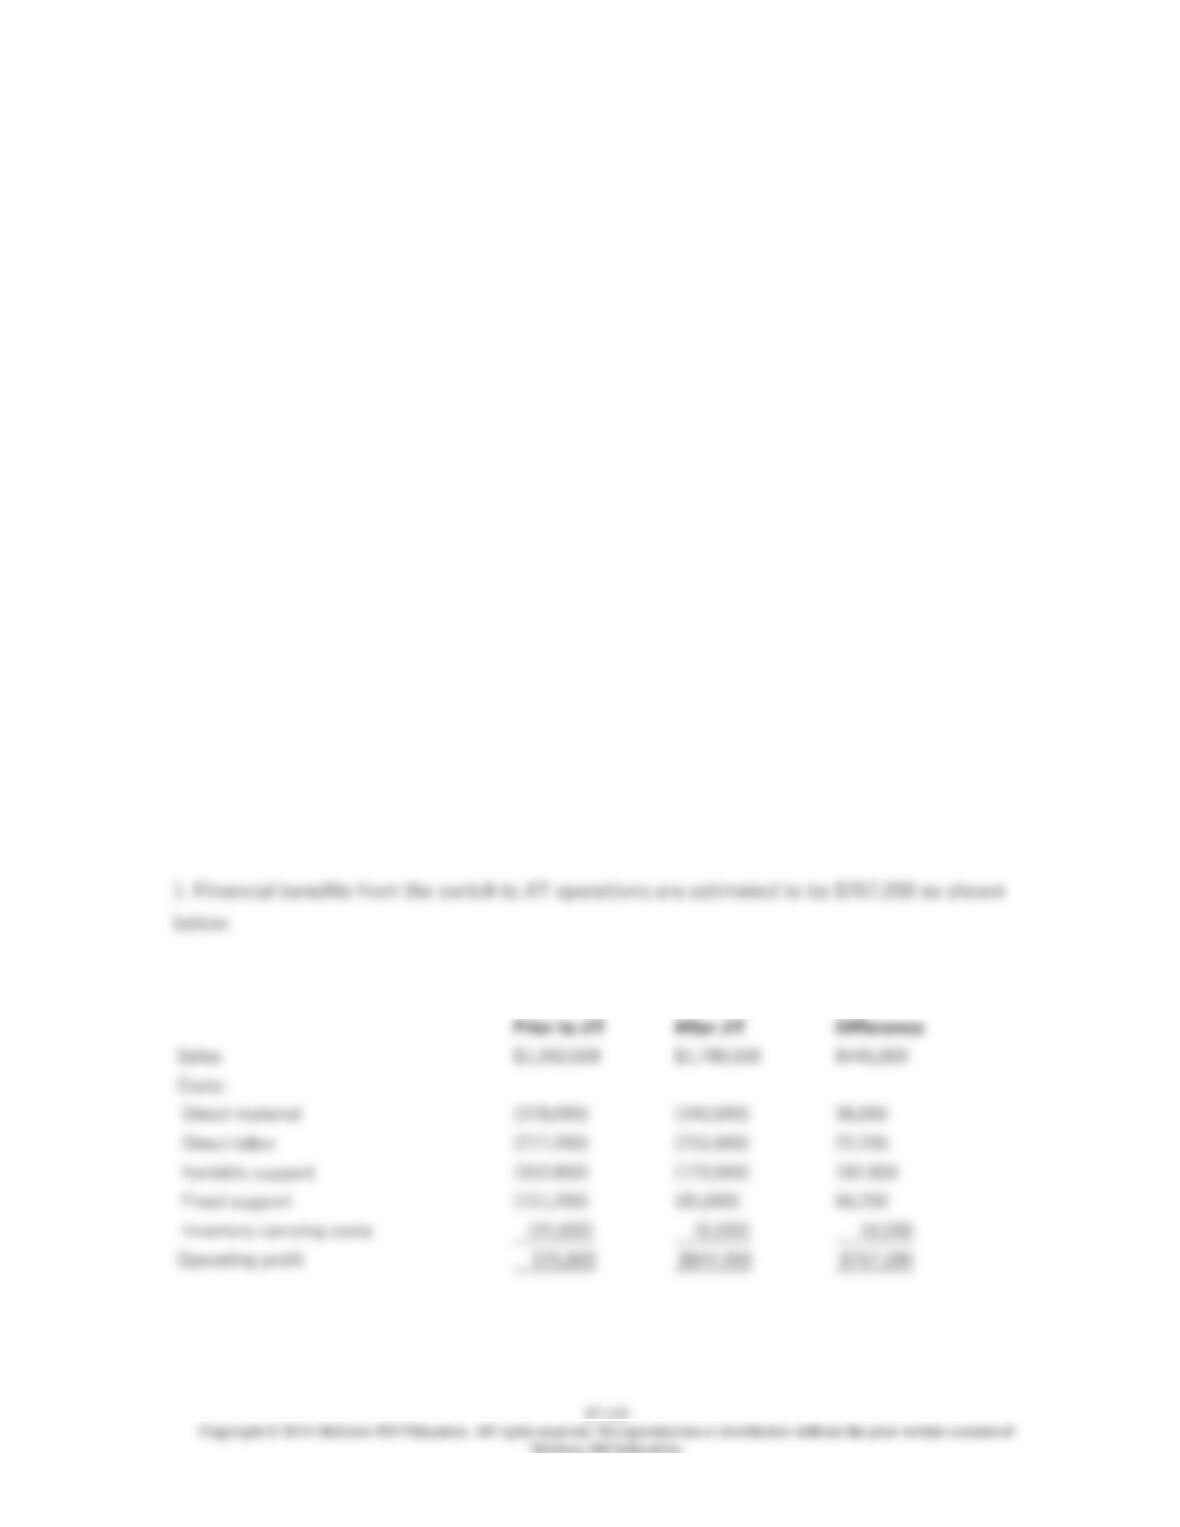
1. Estimate the net financial benefit (expressed in terms of operating income) that the company
realized from the switch to JIT manufacturing.
2. List four (4) nonfinancial benefits the company might expect as a result to its move to JIT.
3. What are the primary expected costs of implementing a JIT system?
141. Because of the need to improve its competitive standing, the XYZ Company has
embraced a JIT production philosophy. To facilitate the transition to JIT, the company is
contemplating a change in its production layout. You, as the management accountant for the
company, have recently been asked to prepare an analysis of relevant costs and benefits
associated with the proposed change in plant layout. After consulting with relevant managers
within the company, you have come up with the following pieces of information:
(a) Estimated cost to move/reinstall existing machinery and equipment = $100,000.
(b) Estimated increase in sales = 20% (to $1,200,000). (This increase is based on an assumed
decrease in production cycle time under the new plan layout. Past experience shows an average
contribution margin of 31% of sales revenue.)
(c) Inventory-related costs are predicted to decrease by 25%. Currently, the company holds an
average inventory of approximately $200,000. You estimate that inventory-holding costs amount
to 15% (on an annual basis).
Required:
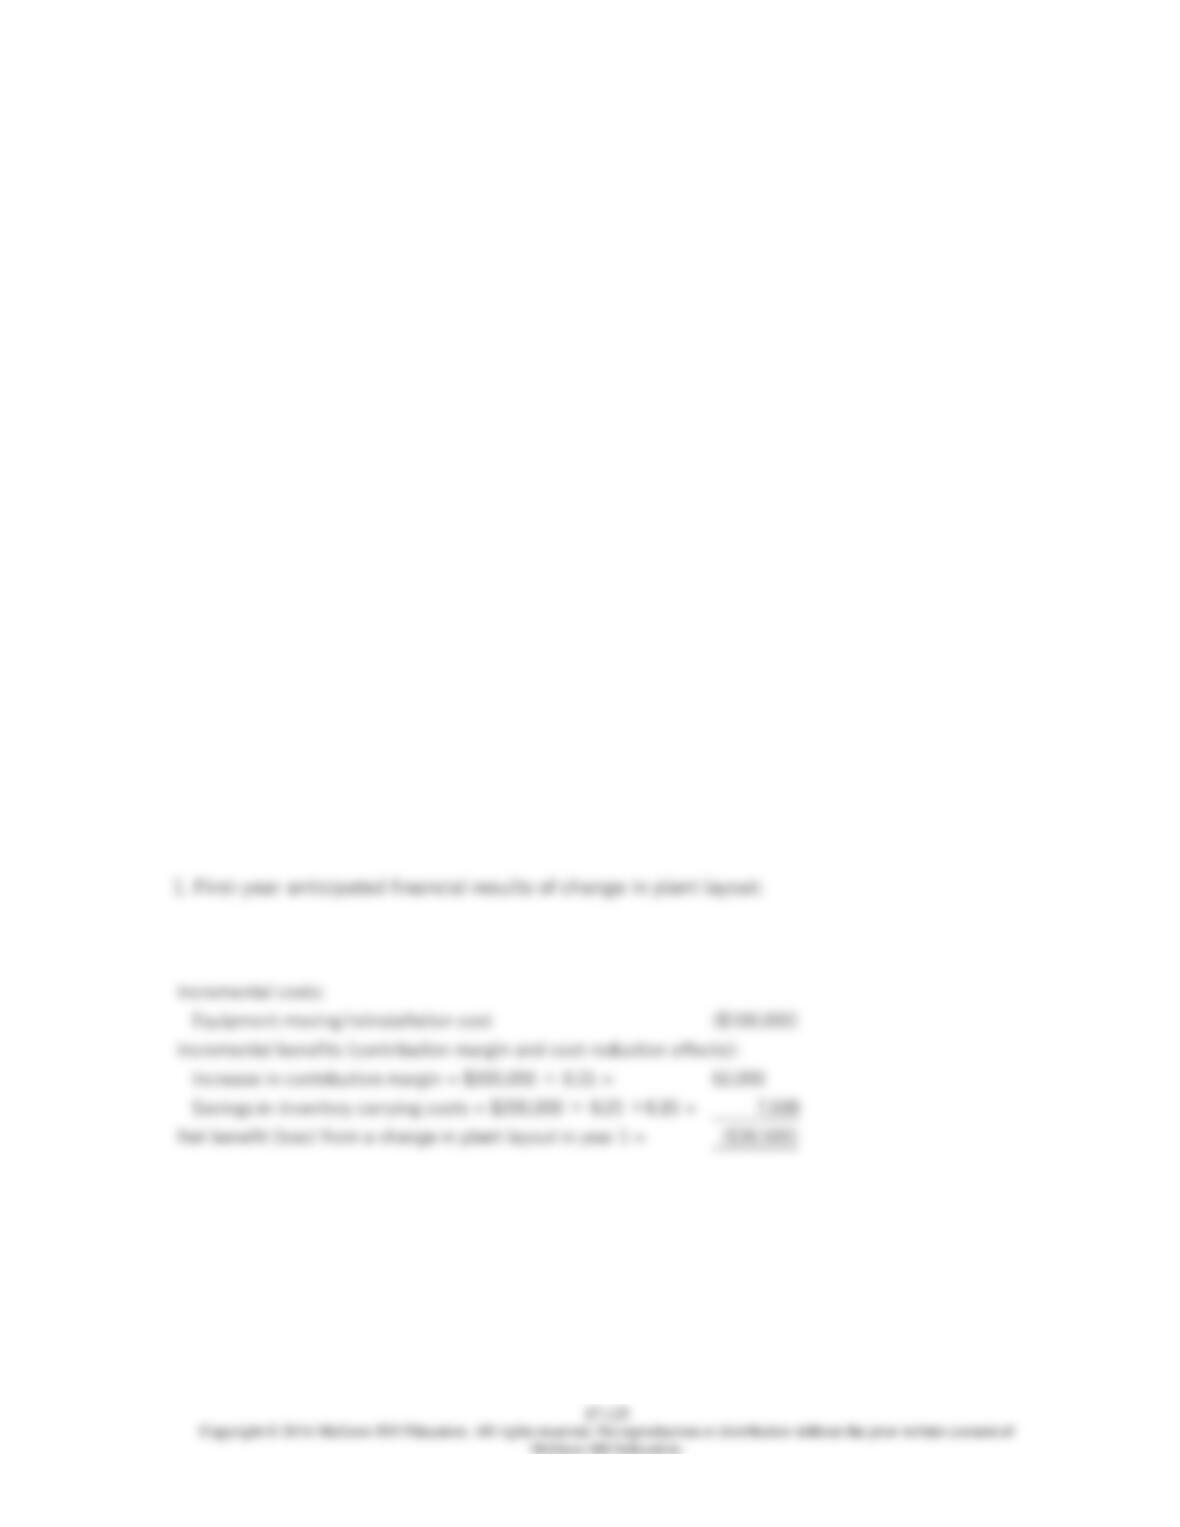
1. Should the company implement the proposed change in plant layout? To support your answer
show calculations associated with the first-year financial effect associated with the change.
2. What other considerations might be made before a decision regarding the change in factory
layout is made?
142. This question deals with the general topic of nonfinancial performance indicators.
Required:
Chapter 17 of the text discusses both financial and nonfinancial performance indicators that can
be used to manage and control quality. Provide a description of each of the following two
nonfinancial quality indicators:
1. Customer response time (CRT)
2. Cycle time efficiency
3. Into what three components can CRT be broken down?
143. Explain what is meant by the term “net promoter score” and what relevance this metric
has in terms of the goal of developing a comprehensive framework for managing and controlling
quality.
144. As noted in the text, a comprehensive framework for managing and controlling quality
contains both financial and non-financial performance indicators (metrics). Provide four (4)
examples of internal quality metrics and four (4) examples of external (i.e., customer–based) non–
financial quality metrics.
145. Provide four reasons why both internal and external
nonfinancial measures of quality
are
integral components of a comprehensive system for managing and controlling quality.
146. Provide a definition of the term “quality,” as used in Chapter 17 of the text. Into what two
categories (or dimensions) can total quality be divided? Define each of these two dimensions.
How, conceptually, can cost management contribute to the management of each of these two
dimensions of quality?
147. Exhibit 17.3 provides a diagrammatical representation of a comprehensive framework for
managing and controlling quality. Discuss, briefly, five elements of this framework.