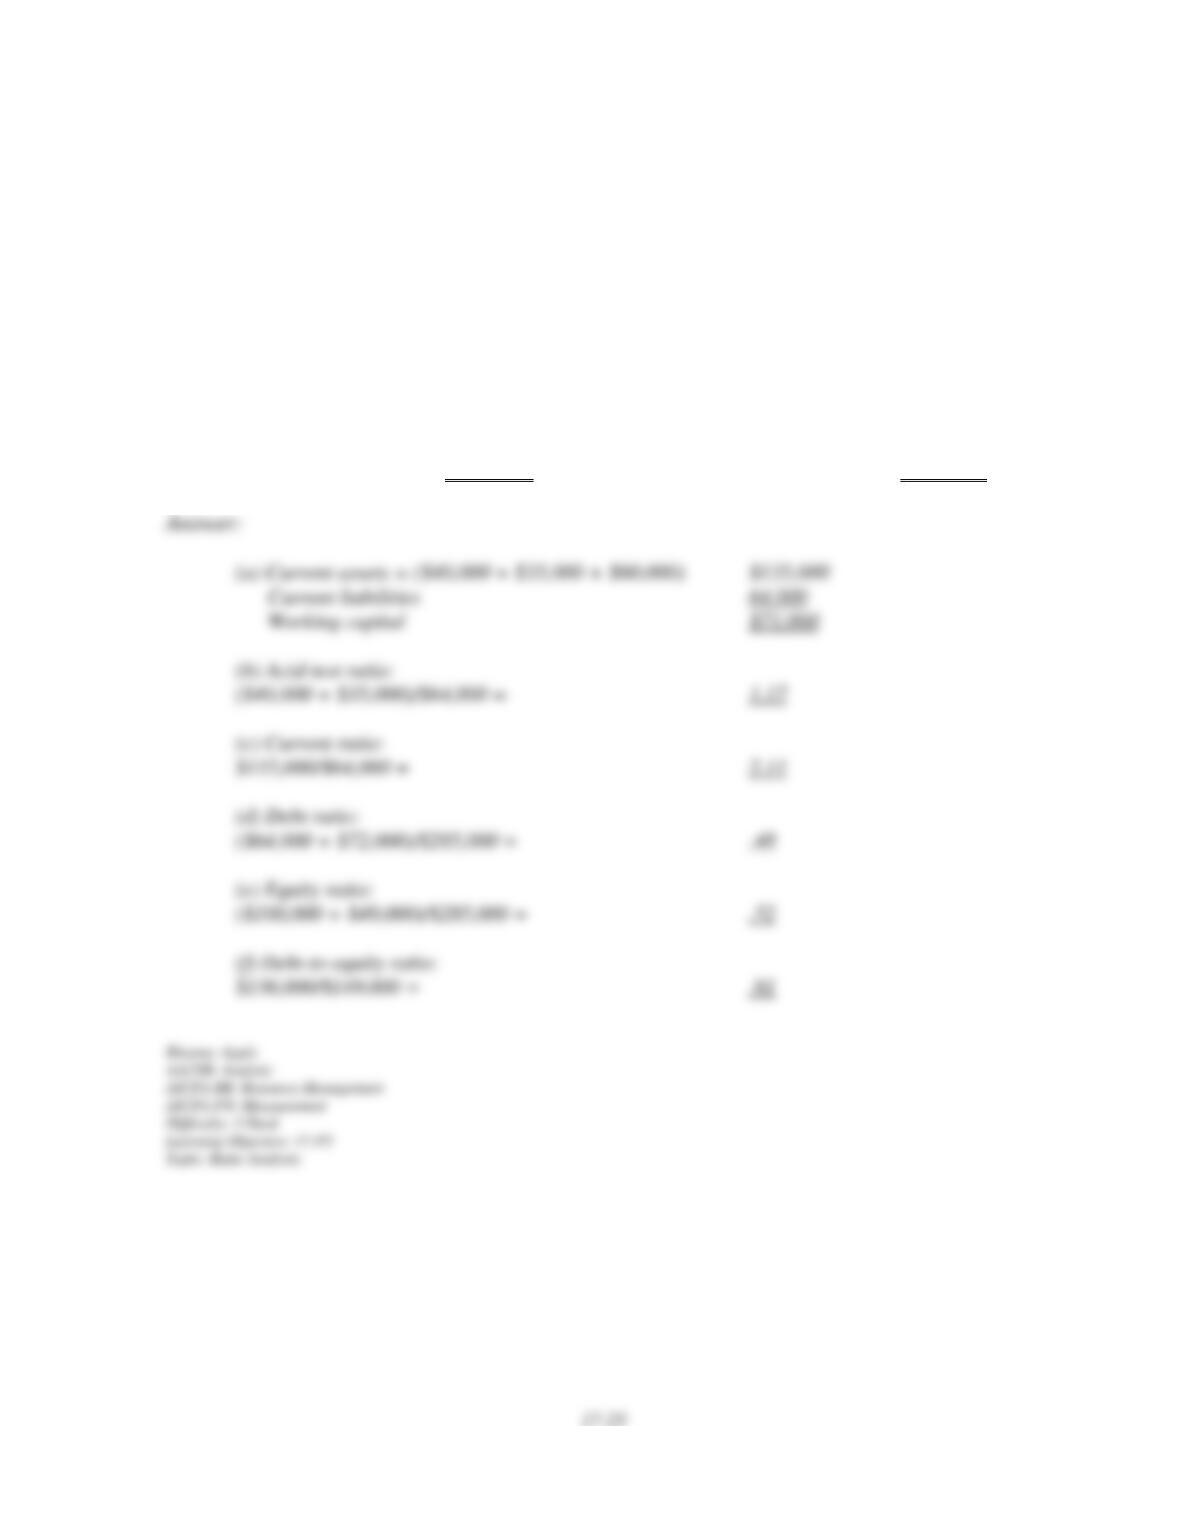
(a) working capital
(b) acid-test ratio
(c) current ratio
(d) debt ratio
(e) equity ratio
(f) debt-to-equity ratio
Cash……………………….. $ 40,000 Current liabilities …………. $ 64,000
Accounts receivable………. 35,000 Long-term liabilities……….72,000
Inventory………………….. 60,000 Common stock……………..100,000
Equipment………………… 150,000 Retained earnings…………. 49,000
Total assets……………….. $285,000 Total liabilities and equity $285,000
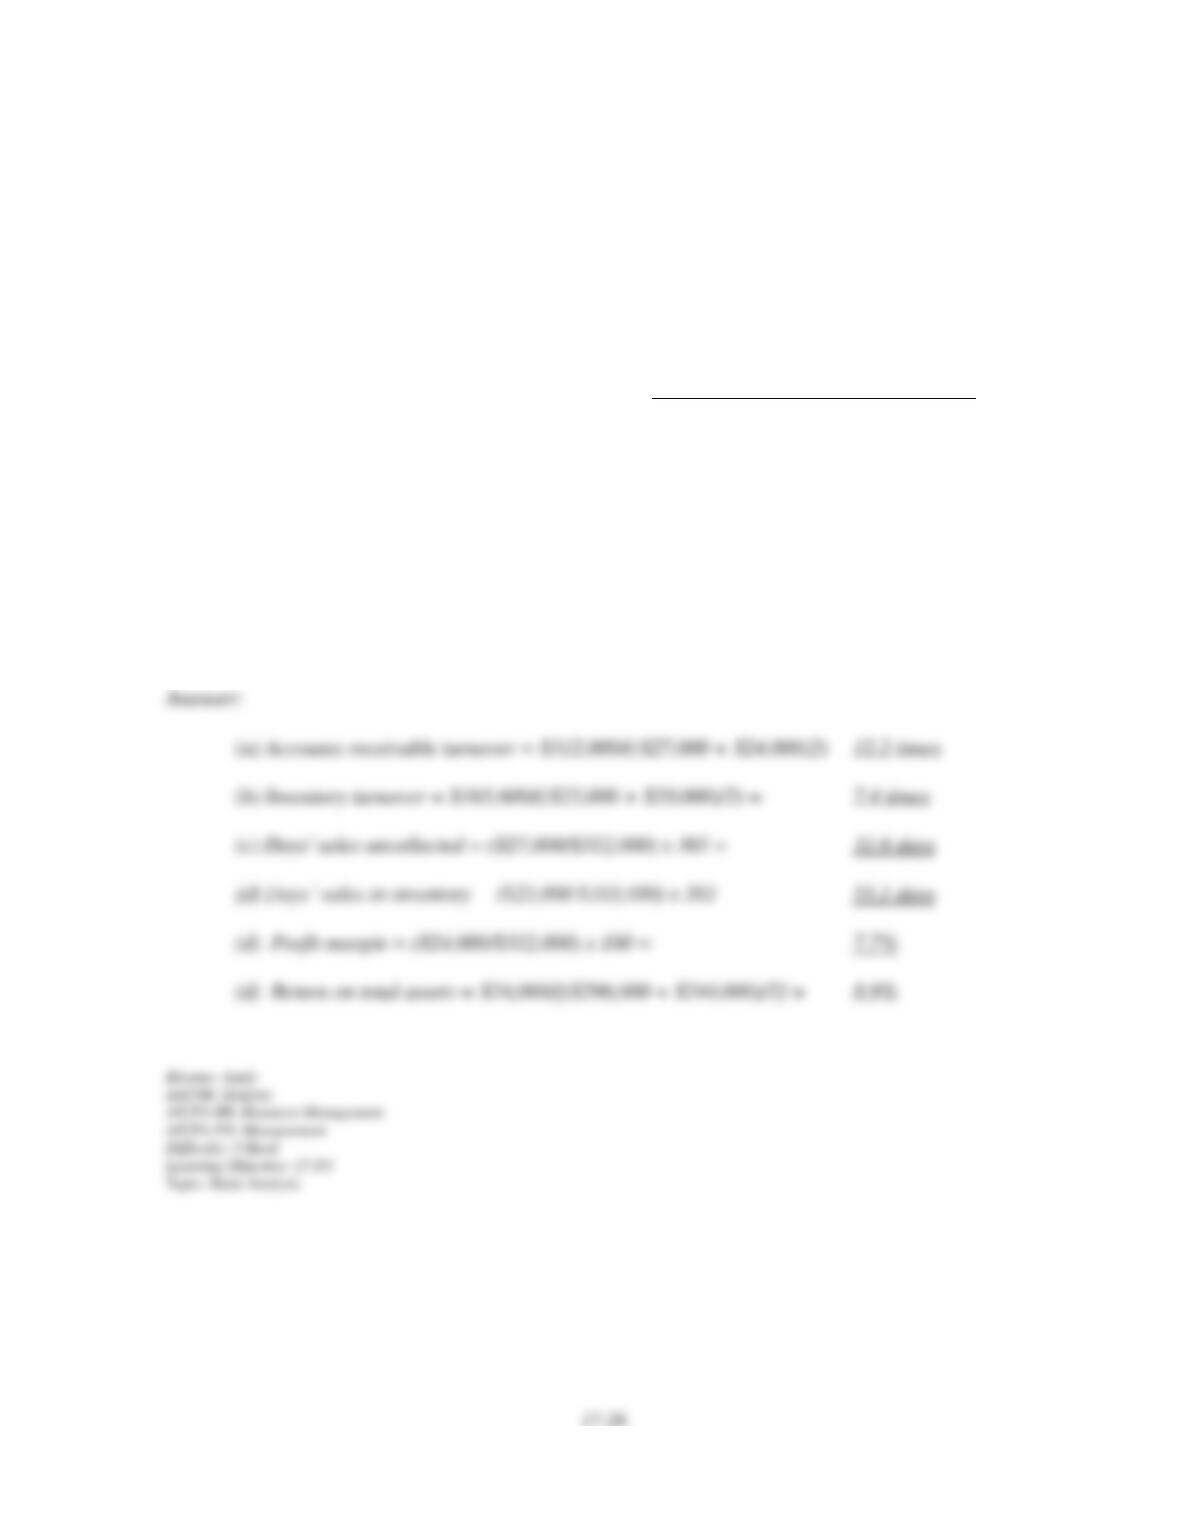
165. Selected balances from a company’s financial statements are shown below. Calculate the
following ratios for 2014:
(a) accounts receivable turnover
(b) inventory turnover
(c) days’ sales uncollected
(d) days’ sales in inventory
(d) profit margin.
(e) return on total assets.
Dec. 31, Dec. 31, For the
2014 2013 Year 2014
Accounts receivable $ 27,000 $ 24,000
Merchandise inventory 25,000 20,000
Total assets 296,000 244,000
Accounts payable 26,000 32,000
Salaries payable 3,000 4,400
Sales (all on credit) $312,000
Cost of goods sold 165,600
Salaries expense 48,000
Other expenses 75,000
Net income 24,000
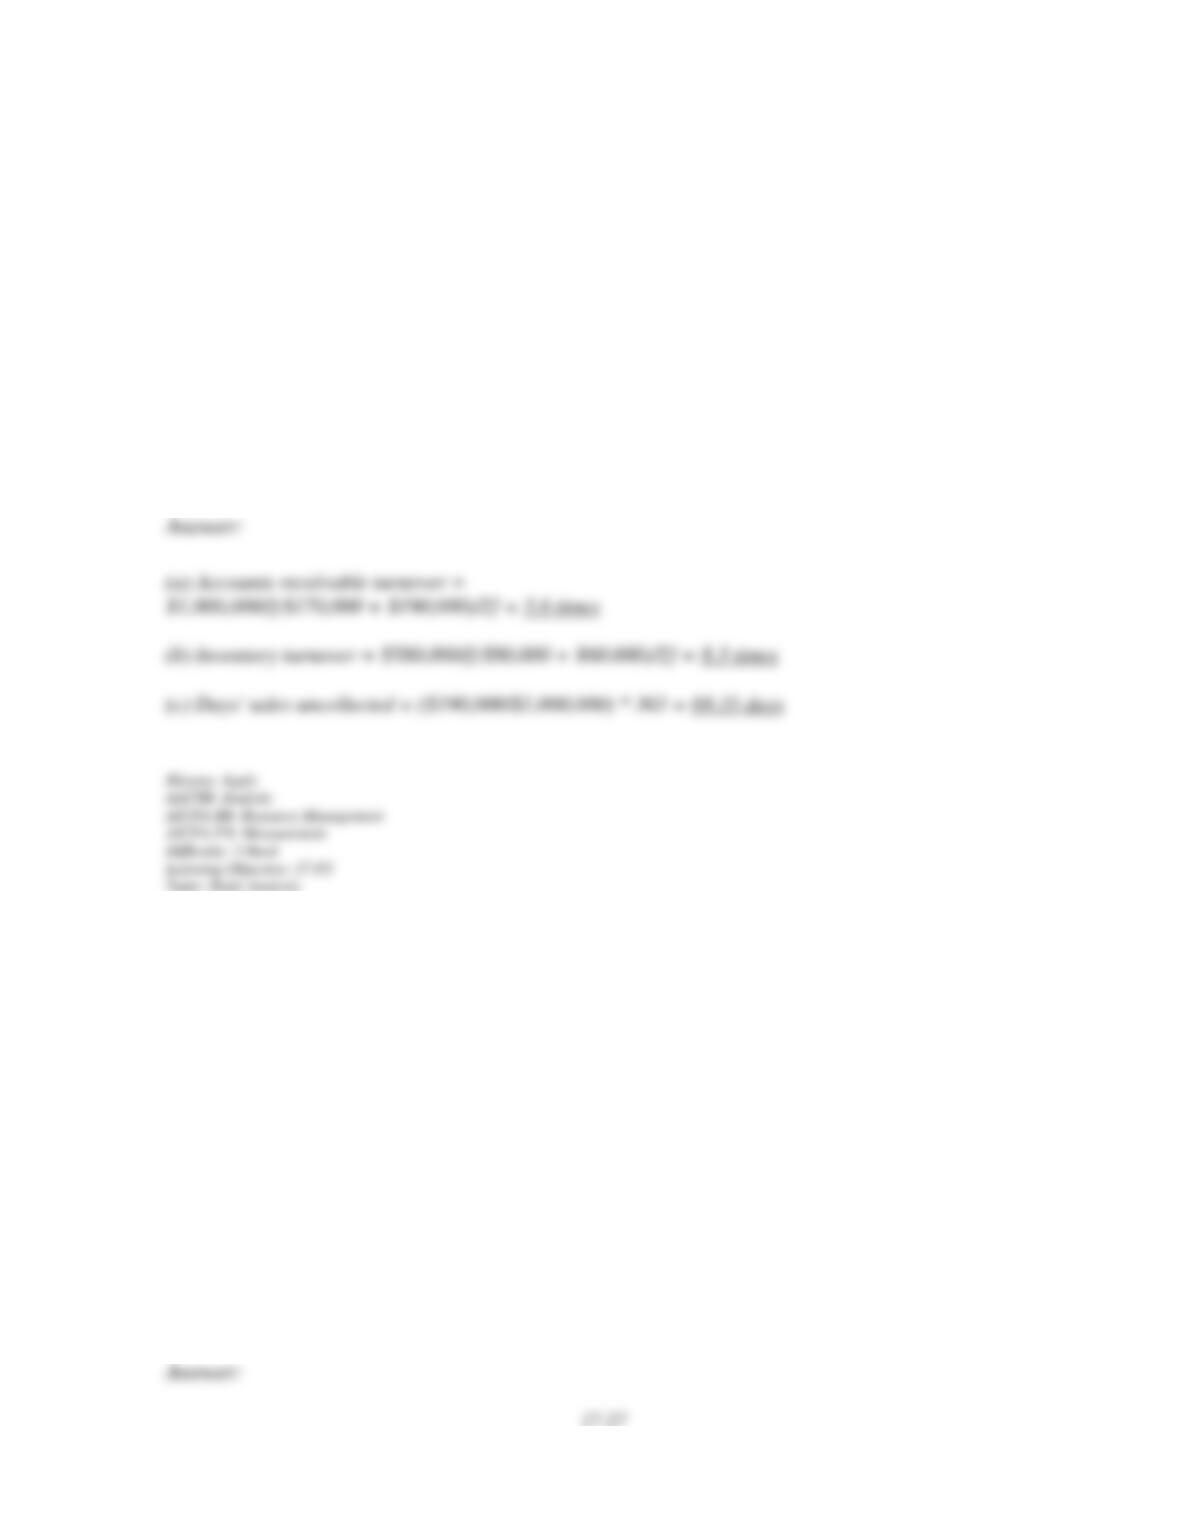
166. The following selected financial information for a company was reported for the current
year end. Calculate the following company ratios:
(a) Accounts receivable turnover.
(b) Inventory turnover.
(c) Days’ sales uncollected
Accounts receivable, beginning-year……………. $170,000
Accounts receivable, year-end…………………… 190,000
Merchandise inventory, beginning–year…………. 80,000
Merchandise inventory, year-end………………… 60,000
Cost of goods sold………………………………… 580,000
Credit sales………………………………………... 1,000,000
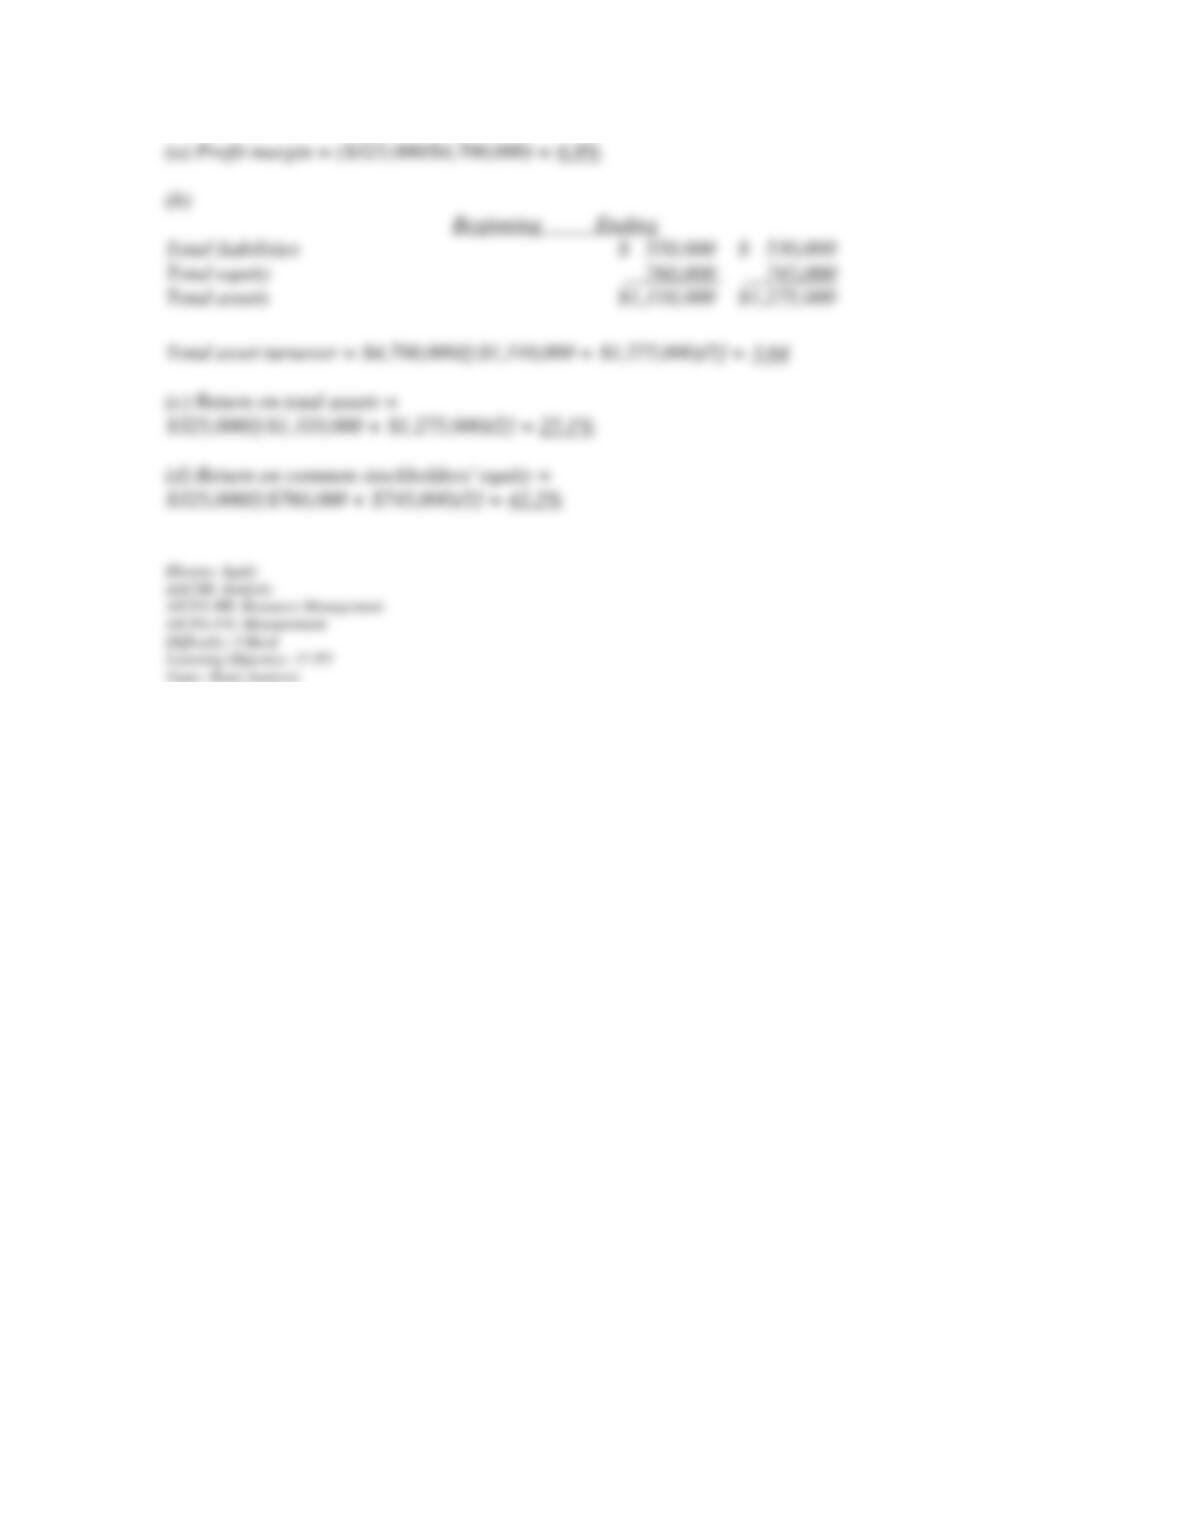
167. Selected current year end financial information for a company is presented below.
Calculate the following company ratios:
(a) Profit margin.
(b) Total asset turnover.
(c) Return on total assets.
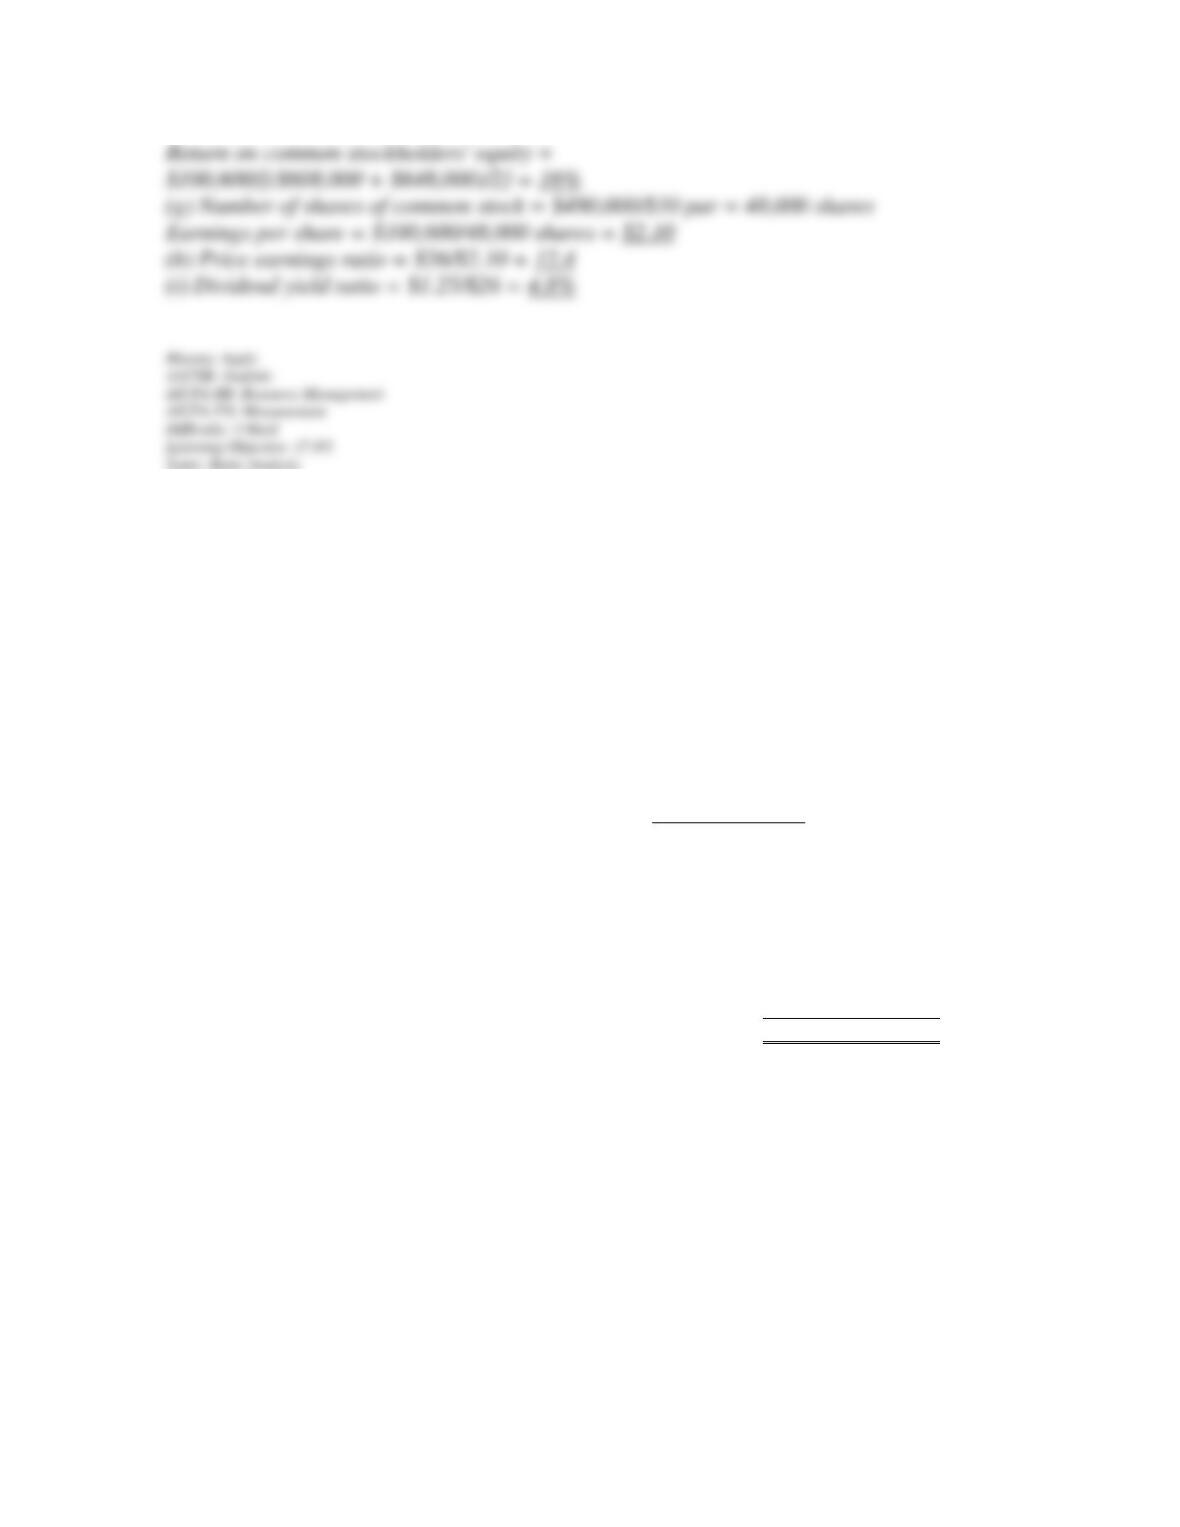
(d) Return on common stockholders’ equity (assume the company has no preferred stock).
Net income……………………………….. $ 325,000
Net sales………………………………….. 4,700,000
Total liabilities, beginning-year………….. 550,000
Total liabilities, end-of-year……………… 530,000
Total stockholders’ equity, beginning-year. 760,000
Total stockholders’ equity, end-of-year….. 745,000
17–28
168. Use the following information from the current year financial statements of a company to
calculate the ratios below:
(a) Current ratio.
(b) Accounts receivable turnover. (Assume the prior year’s accounts receivable balance was
$100,000.)
(c) Days’ sales uncollected.
(d) Inventory turnover. (Assume the prior year’s inventory was $50,200.)
(e) Times interest earned ratio.
(f) Return on common stockholders’ equity. (Assume the prior year’s common stock balance
was $480,000 and the retained earnings balance was $128,000.)
(g) Earnings per share (assuming the corporation has a simple capital structure, with only
common stock outstanding).
(h) Price earnings ratio. (Assume the company’s stock is selling for $26 per share.)
(i) Divided yield ratio. (Assume that the company paid $1.25 per share in cash dividends.)
Income statement data:
Sales (all on credit) $1,075,000
Cost of goods sold 575,000
Gross profit on sales $ 500,000
Operating expenses 305,000
Operating income $ 195,000
Interest expense 20,400
Income before taxes $ 174,600
Income taxes 74,000
Net income $ 100,600
Balance sheet data:
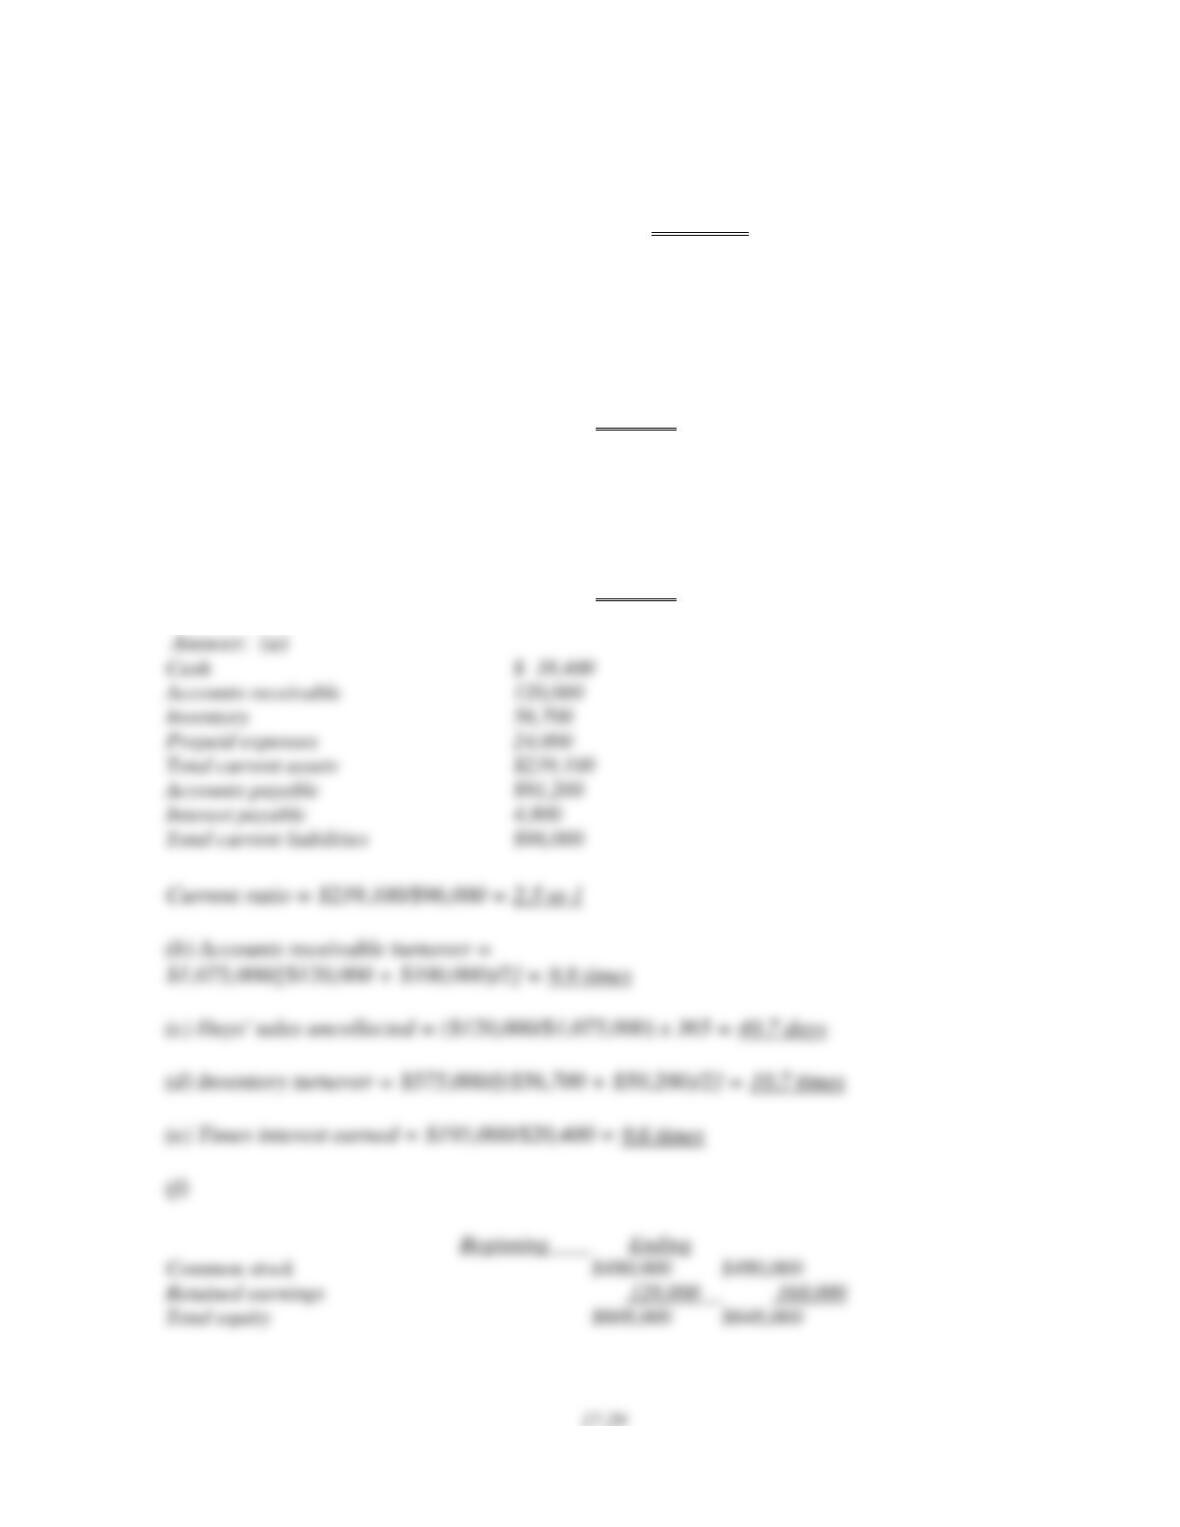
Cash $ 38,400
Accounts receivable 120,000
Inventory 56,700
Prepaid Expenses 24,000
Total current assets $239,100
Total plant assets 708,900
Total assets $948,000
Accounts payable $ 91,200
Interest payable 4,800
Long-term liabilities 204,000
Total liabilities $300,000
Common stock, $10 par 480,000
Retained earnings 168,000
Total liabilities and equity $948,000
17–30
169. Financial information for Omega Corporation is presented below. Calculate the
following ratios for 2014:
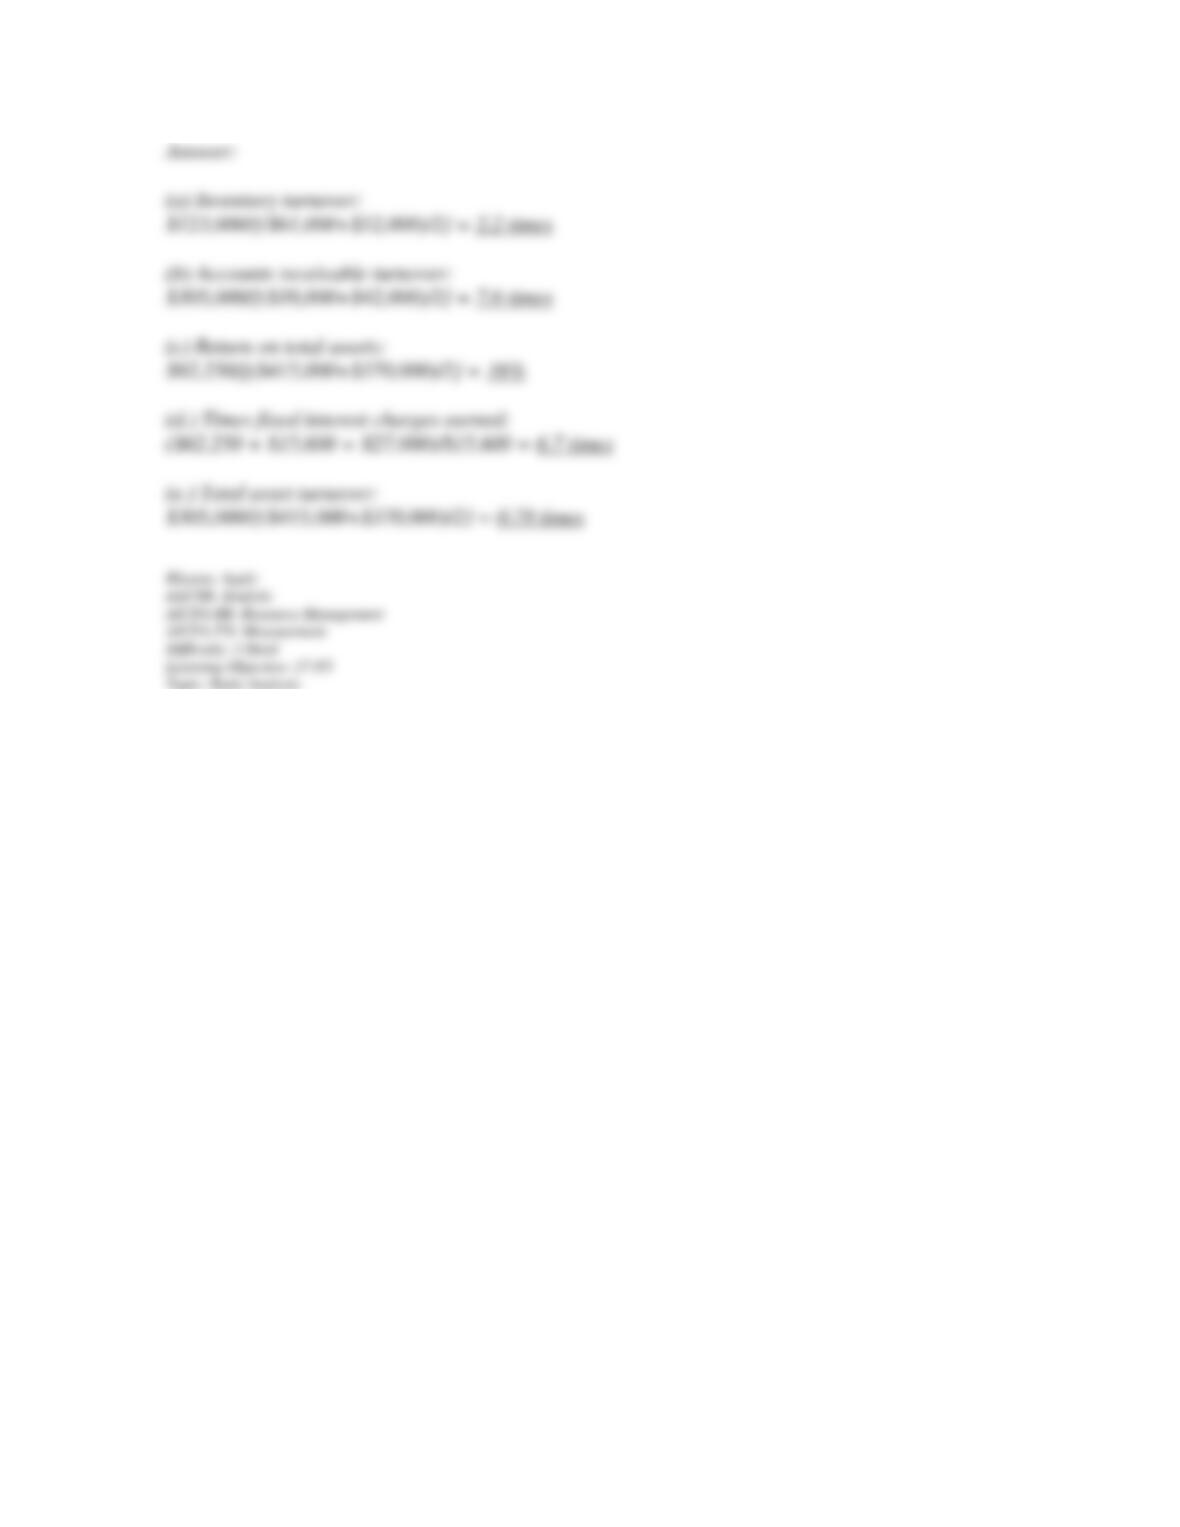
(a) Inventory turnover.
(b) Accounts receivable turnover.
(c) Return on total assets.
(d) Times interest earned.
(e) Total asset turnover.
2014 2013
Assets:
Cash $ 18,000 $ 22,000
Marketable securities 25,000 0
Accounts receivable 38,000 42,000
Inventory 61,000 52,000
Prepaid insurance 6,000 9,000
Long-term investments 49,000 20,000
Plant assets, net 218,000 225,000
Total assets $415,000 $370,000
Net income $ 62,250
Sales (all on credit) 305,000
Cost of goods sold 123,000
Interest expense 15,600
Income tax expense 27,000
17–31
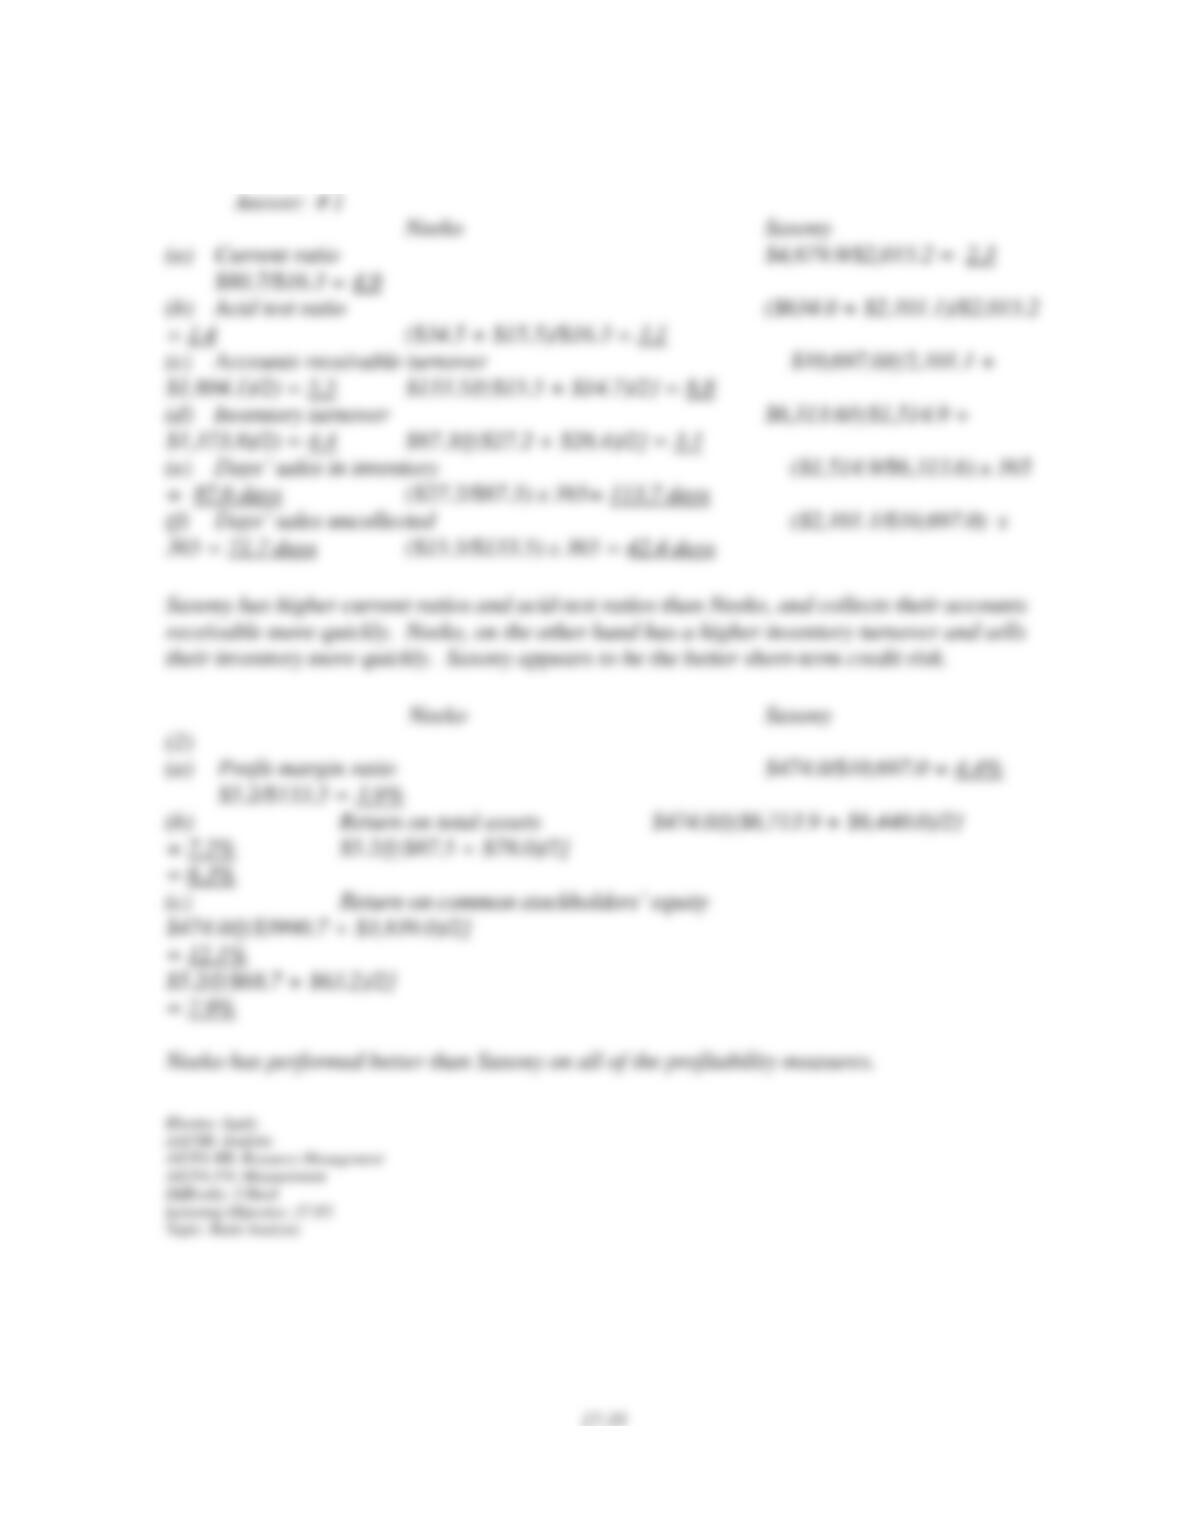
170. The following summaries from the income statements and balance sheets of Neeko, Inc.
and Saxony, Inc. are presented below.
(1) For both companies for 2014, compute the:
(a) Current ratio
(b) Acid-test ratio
(c) Accounts receivable turnover
(d) Inventory turnover
(e) Days’ sales in inventory
(f) Days’ sales uncollected
Which company do you consider to be the better short-term credit risk? Explain.
(2) For both companies for 2014, compute the:
(a) Profit margin ratio
(b) Return on total assets
(c) Return on common stockholders’ equity
Which company do you consider to have better profitability ratios?

Neeko, Inc.
Consolidated Balance Sheets
(in millions)
May 31
2014 2013
Assets
Current assets:
Cash and cash equivalents $ 634.0
$575.5
Accounts receivable, net of allowance 2,101.1
1,804.1
Inventories 1,514.9
1,373.8
Other current assets 429.9
401.3
Total current assets 4,679.9
4,154.7
Property, plant, and equipment, net 1,620.8
1,614.5
Other long term assets 413.2
670.8
Total assets $6,713.9
$6,440.0
Liabilities and Stockholders’ Equity
Current liabilities:
Current portion of long-term debt $ 205.7 $
55.3
Notes payable 75.4
425.2
Accounts payable 572.7
504.4
Accrued liabilities 1,054.2
765.3
Income taxes payable 107.2
83.0
Total current liabilities 2,015.2
1,833.2
Long term liabilities 708.0
767.8
Total liabilities 2,723.2
2,601.0
Stockholders’ equity:
Common stock 2.8 2.8
Contributed capital in excess of par value 589.0
538.7
Unearned stock compensation (0.6) (5.1)
17–33
Accumulated other comprehensive loss (239.7)
(192.4)
Retained earnings 3,639.2
3,495.0
Total stockholders’ equity 3,990.7
3,839.0
Total liabilities and stockholders’ equity $6,713.9
$6,440.0
Neeko, Inc.
Consolidated Statement of Income
May 31, 2014
(in millions)
Revenues $10,697.0
Cost of sales 6,313.6
Gross profit 4,383.4
Operating expenses 3,137.6
Operating income 1,245.8
Interest expense 42.9
Other revenues and expenses 79.9
Income before tax 1,123.0
Income taxes 382.9
Income before effect of accounting change 740.1
Cumulative effect of accounting change, net of tax 266.1
Net income $ 474.0
Saxony, Inc.
Consolidated Balance Sheets
Jan. 3, Jan. 4,
2014 2013
Assets
Current assets:
Cash and cash equivalents $34.5
$22.2
Accounts receivable, net of allowance 15.5 14.7
Inventories 27.2 28.4
Other current assets 3.5
4.2
Total current assets 80.7 69.5
Property, plant, and equipment, net 5.7 7.0
Other long term assets 1.1
1.5
Total assets $87.5
$78.0

17–34
Liabilities and Stockholders’ Equity
Current liabilities:
Accounts payable $ 8.5 $
6.6
Accrued liabilities 7.8
5.6
Total current liabilities 16.3 12.2
Long term liabilities 2.5
2.6
Total liabilities 18.8
14.8
Stockholders’ equity:
Common stock 2.3 2.3
Contributed capital in excess of par value 17.8 17.4
Unearned stock compensation (0.1) (0.5)
Accumulated other comprehensive loss (0.9) (1.3)
Treasury stock (6.3) (5.4)
Retained earnings 55.9
50.7
Total stockholders’ equity 68.7
63.2
Total liabilities and stockholders’ equity $87.5
$78.0
Saxony, Inc.
Consolidated Statement of Income
January 3, 2014
(in millions)
Revenues $133.5
Cost of sales 87.3
Gross profit 46.2
Operating expenses 37.3
Operating income 8.9
Interest expense (0.1)
Other revenues and expenses 0.3
Income before tax 9.1
Income taxes 3.9
Net income $ 5.2
Fill in the Blank Questions
171. _________________ applies analytical tools to general-purpose financial statements and
related data for making business decisions.
172. A common focus of financial statement users in evaluating a company’s performance
includes evaluation of its (1) __________________, (2) ______________, and (3)
___________________.
173. General-purpose financial statements include the (1)______________, (2)
_____________, (3) _______________, (4) ______________ and (5) ________________.
174. The four building blocks of financial analysis are (1)_____________, (2) ____________,
(3) ____________ and (4) _________________.
175. The standards for comparisons in financial statement analysis include (1) ___________,
(2) ____________, (3) _____________, and (4) _______________.
176. The comparison of a company’s financial condition and performance across time is
known as ____________________.
177. The comparison of a company’s financial condition and performance to a base amount is
known as _________________.
178. The measurement of key relationships between financial statement items is known as
________________.
179. Three of the most common tools of financial analysis are (1) ____________, (2)
__________________, and (3) ______________________.
17–39
180. A good financial statement analysis report usually includes the following six sections:
(1) ________________________, (2) ______________________, (3) _________________,
(4) __________________ (5) ____________________, and (6) ______________________.
181. _______________ are reports where financial amounts are placed side-by-side in
columns on a single statement for analytical purposes.
182. Trend percentage is calculated by dividing _________________________ by
___________________________ and multiplying the result by 100.
183. ____________ is a method of analysis used to evaluate individual financial statement
items or groups of items in terms of a specific base amount.
184. The current ratio and acid-test ratio are used to reflect the ____________ of a business.
185. The debt ratio, the equity ratio, pledged assets to secured liabilities, and times interest
earned are all ___________________ ratios.
186. The gross margin ratio, return on total assets, and basic earnings per share are all
_____________ ratios.
187. ______________________ ratios include the price-earnings ratio and dividend yield.
188. Ratios may be expressed as (1) ________________, (2) __________________, or (3)
__________________.
189. In order to be classified as an extraordinary gain or loss, the item must be both (1)
_______________ and (2) ____________.
190. The income level most likely to continue into the future and is commonly used in PE
ratios and other market-based measures of performance is the ________________________.