Unlock document.
This document is partially blurred.
Unlock all pages and 1 million more documents.
Get Access
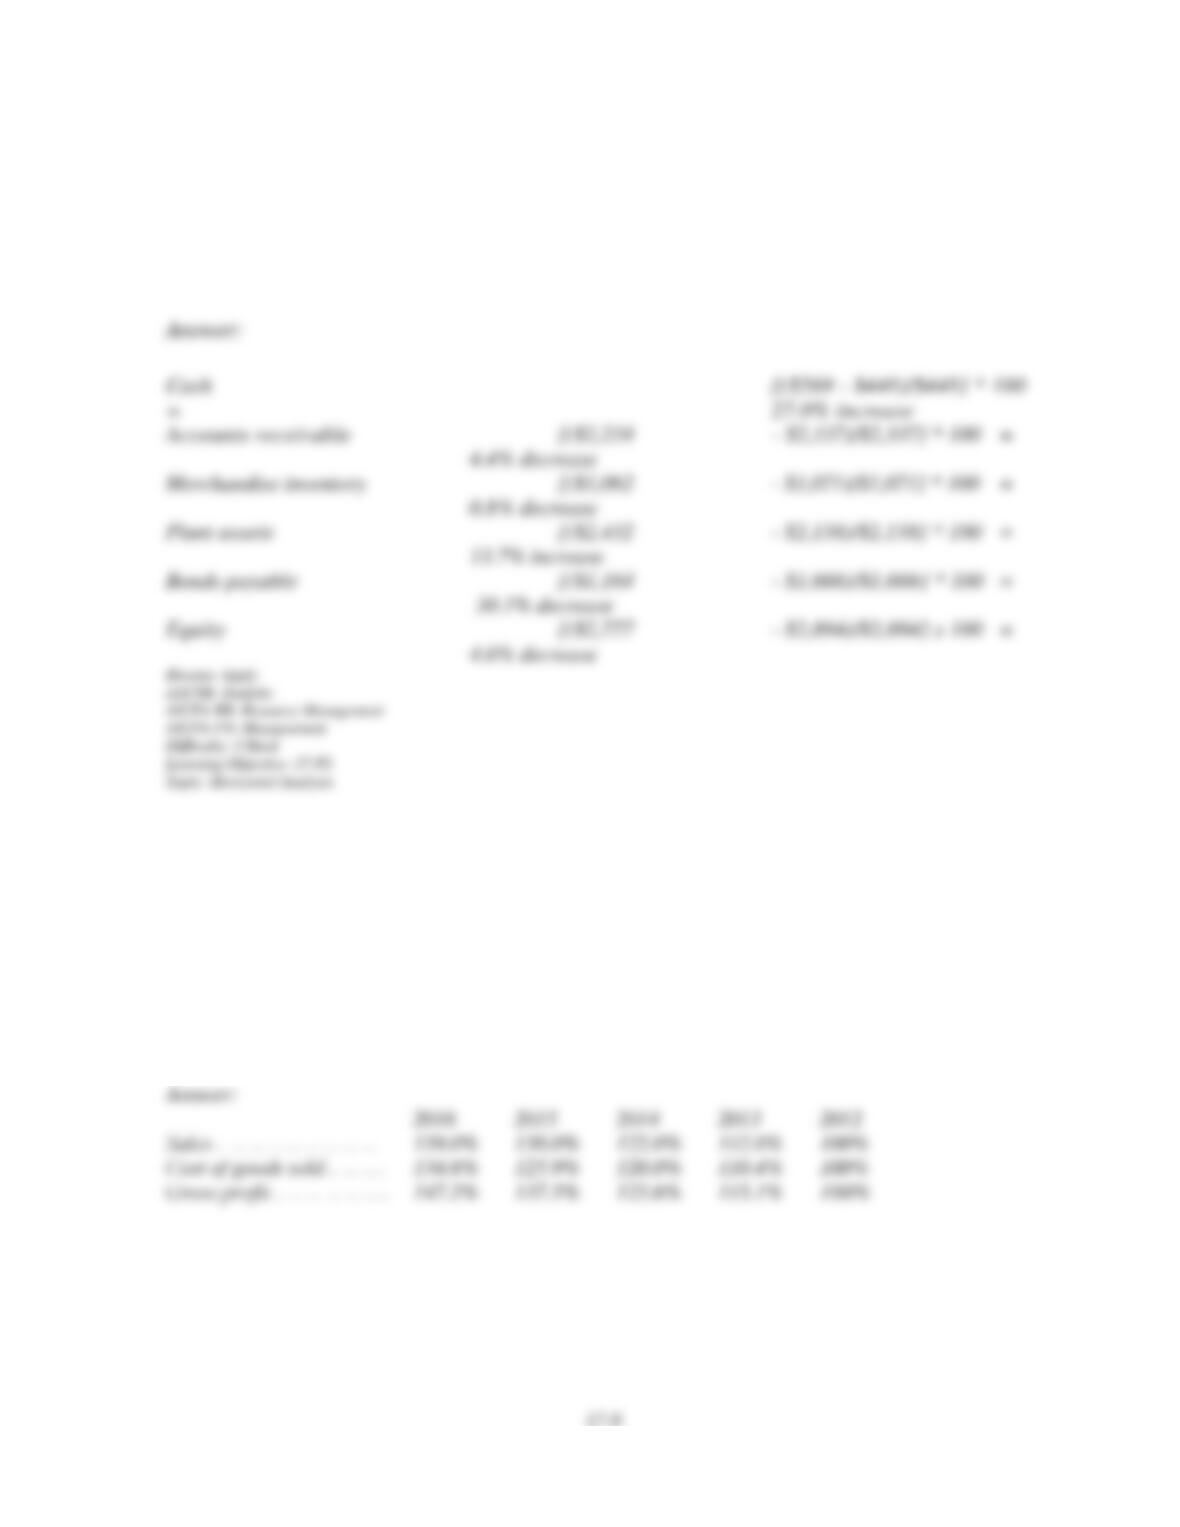
Cash $ 569 $ 448
Accounts receivable 2,234 2,337
Merchandise inventory 1,062 1,071
Plant assets 2,432 2,138
Bonds payable 1,164 1,666
Equity 2,777 2,894
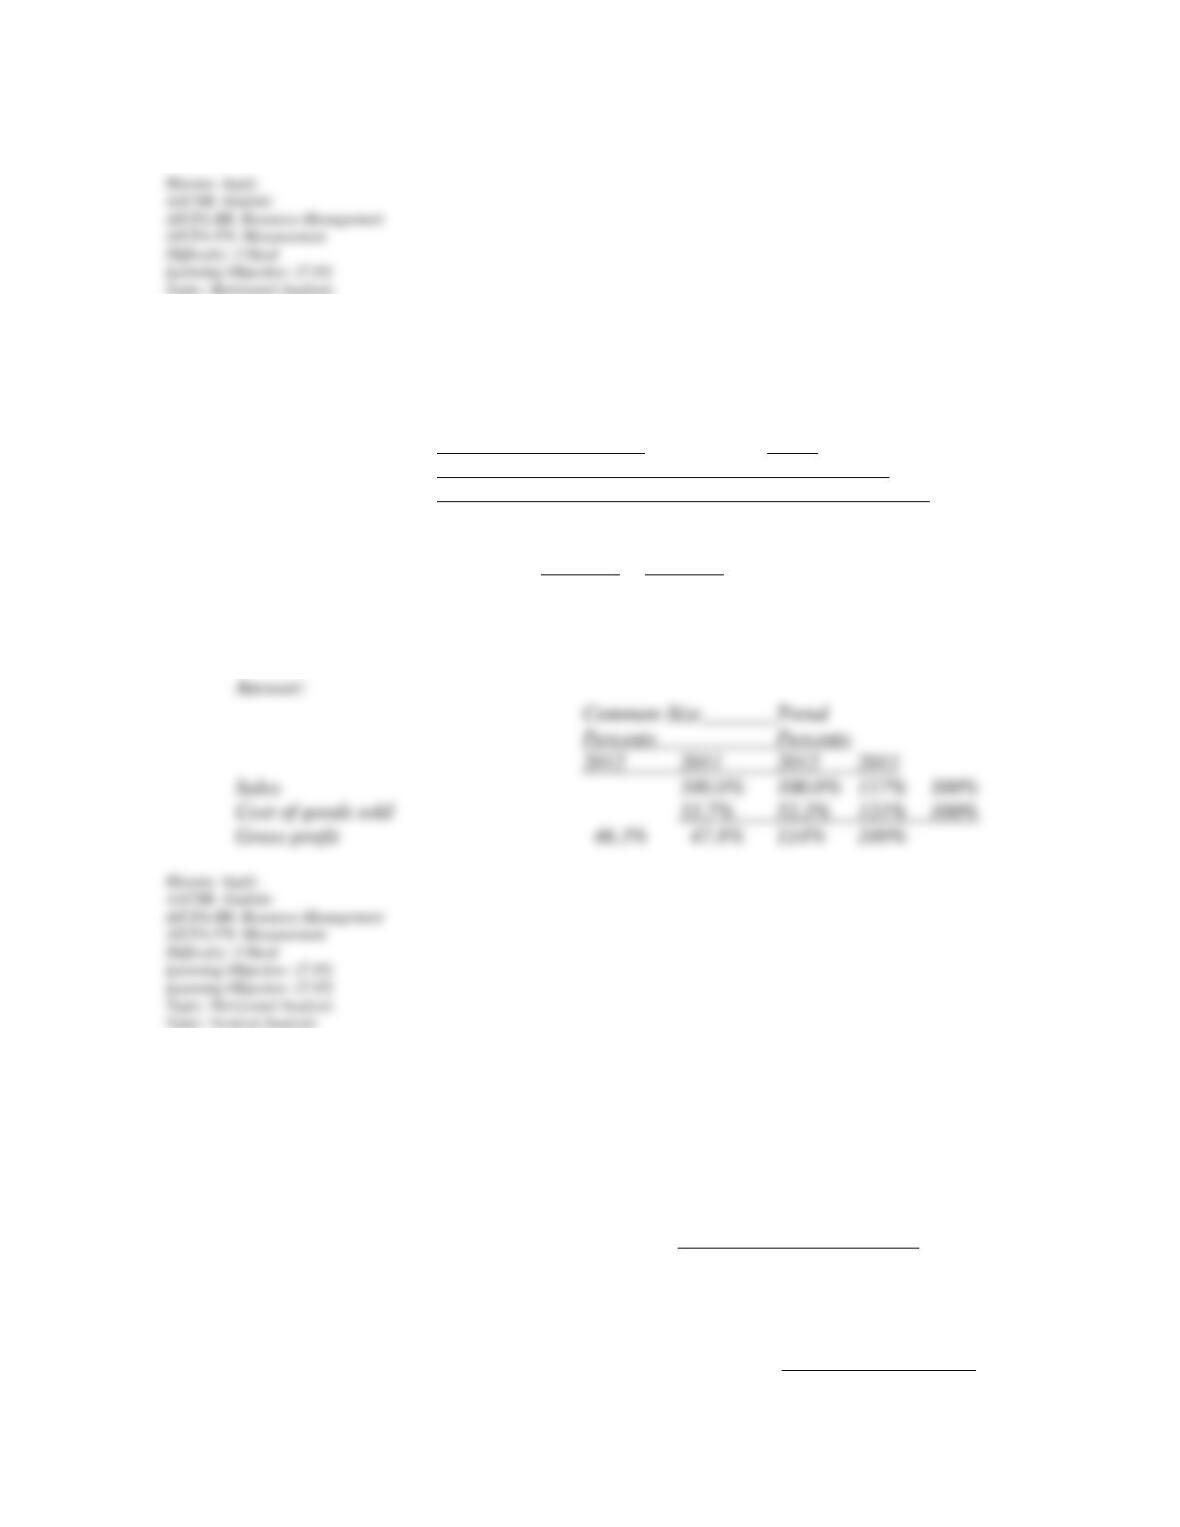
146. For the following financial statement items, calculate trend percents using 2012 as the
base year:
2016 2015 2014 2013 2012
Sales…………………… $1,195,400 $1,118,000 $1,049,000 $963,200 $860,000
Cost of sales………….. 752,400 704,000 671,000 616,700 559,000
Gross profit……………. $443,000 $414,000 $378,000 $346,500 $301,000
17-9
147. Express the following income statement information in common-size percents and in
trend percents using 2012 as the base year.
Common-Size Trend
Percents Percents
2013 2012 2013 2012 2013 2012
Sales $540,000 $460,000 ____ ____ ____
____
Cost of goods sold. 290,000 240,000 ____ ____ ____
____
Gross profit $250,000 $220,000 ____ ____ ____
____
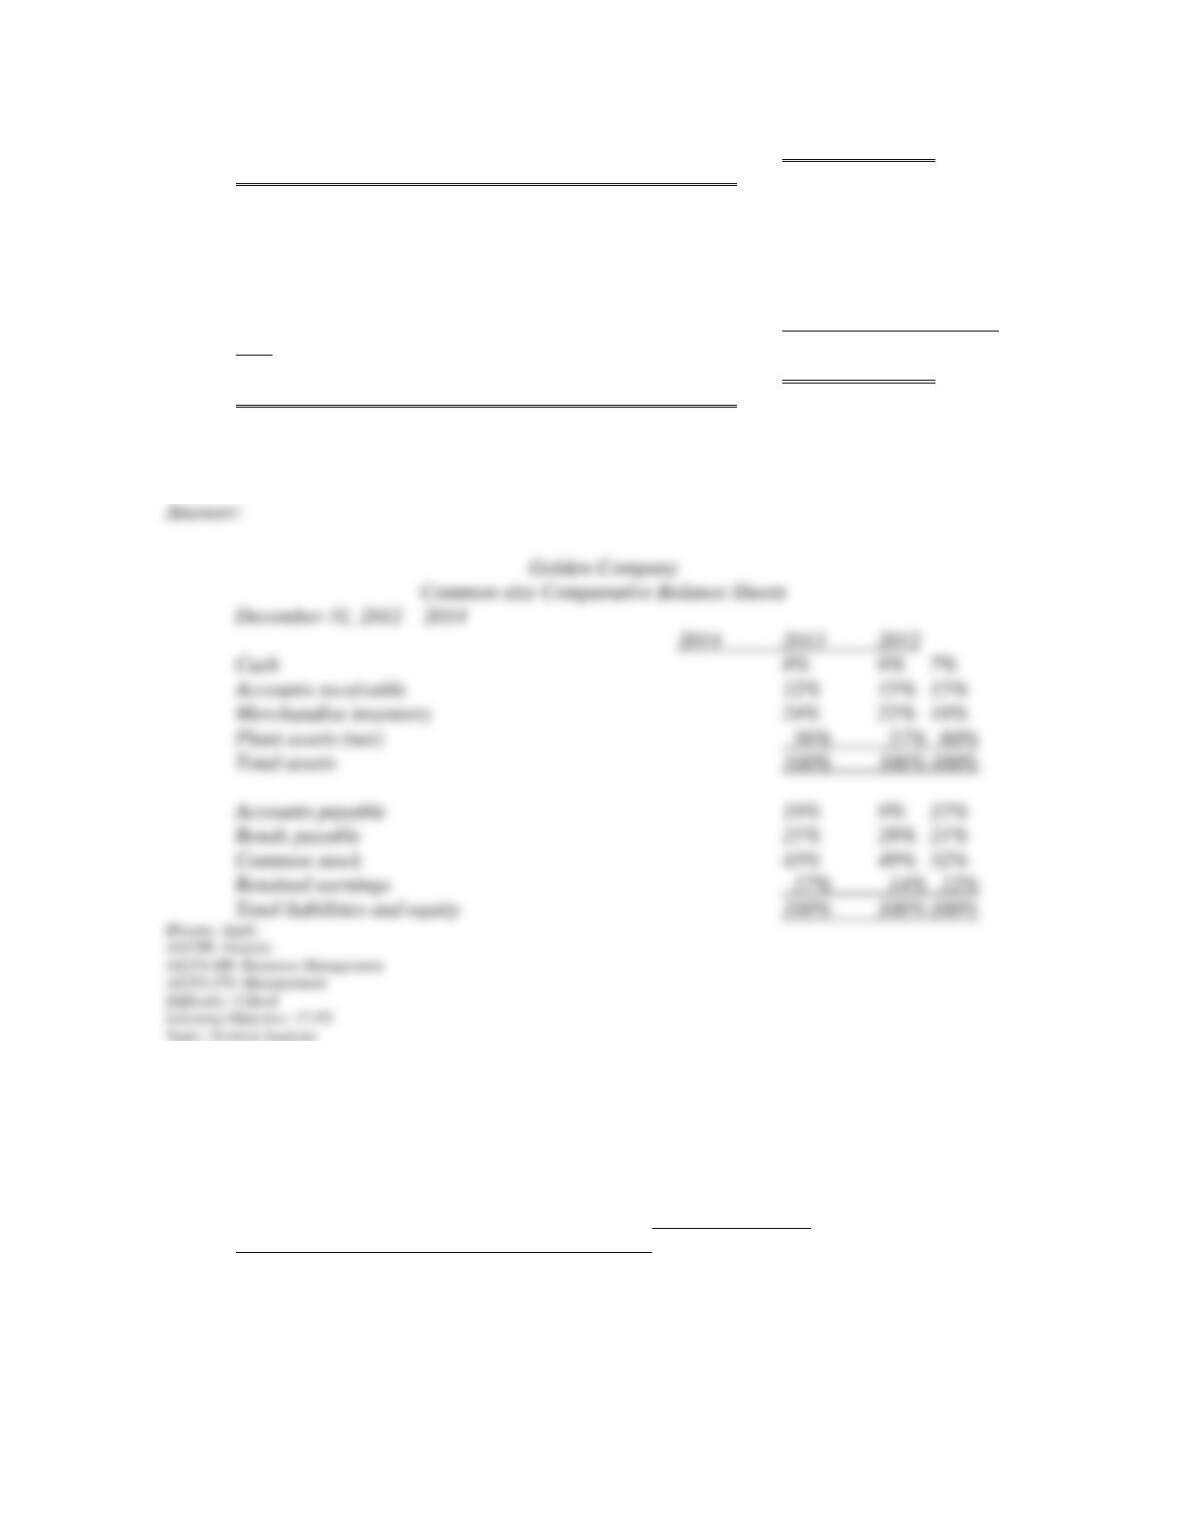
148. The comparative balance sheet for Golden Co. is shown below. Express the balance
sheet in common-size percents.
Golden Company
Comparative Balance Sheets (in $000)
December 31, 2012 – 2014
2014 2013 2012
Cash $ 49.6 $ 34.2 $
35.7
Accounts receivable 74.4 85.5 76.5
Merchandise inventory 148.8 125.4 91.8
Plant assets (net) 347.2 324.9 306.0
17-10
Total assets $620.0 $570.0
$510.0
Accounts payable $117.8 $ 51.3 $
76.5
Bonds payable 130.2 159.6 107.1
Common stock 266.6 279.3 265.2
Retained earnings 105.4 79.8
61.2
Total liabilities and equity $620.0 $570.0
$510.0
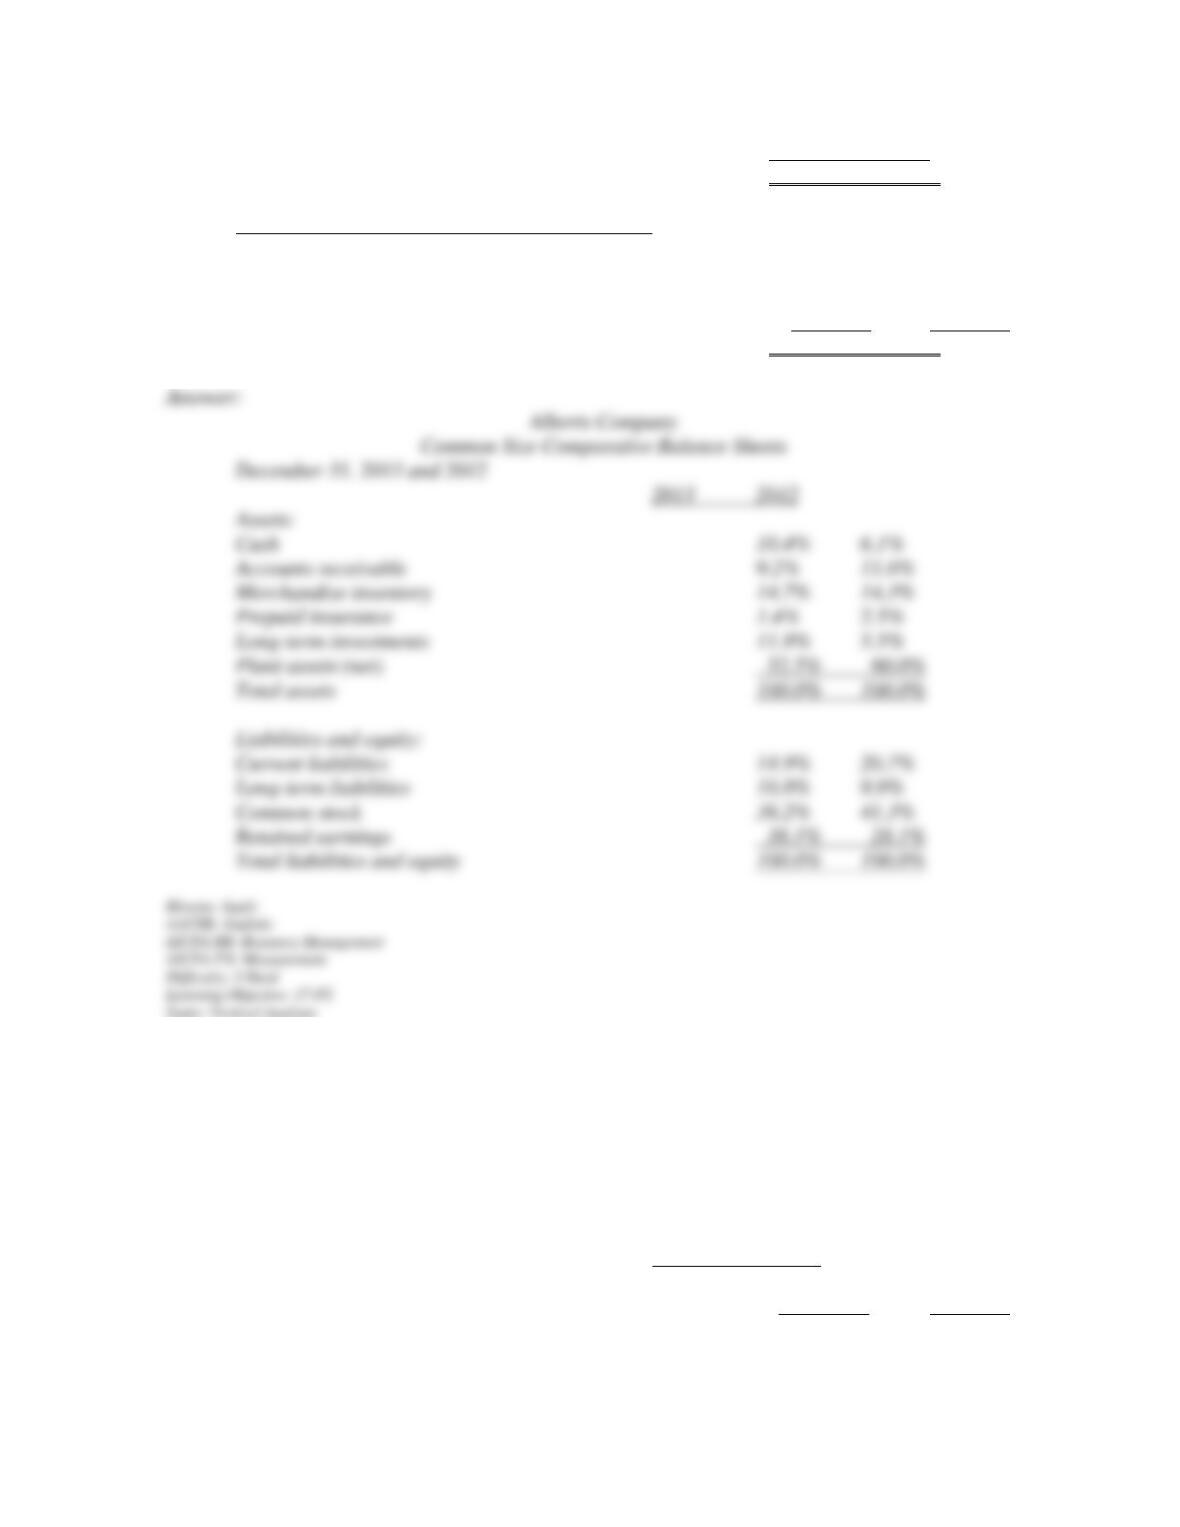
149. Express the following balance sheets for Alberts Company in common-size percents.
Alberts Company
Balance Sheets
December 31, 2013 and 2012
2013 2012
Assets
Cash $ 43,000 $ 22,000
Accounts receivable 38,000 42,000
Merchandise inventory 61,000 52,000
Prepaid insurance 6,000 9,000
Long-term investments 49,000 20,000
17-11
Plant assets (net) 218,000 218,000
Total assets $415,000 $363,000
Liabilities and Equity
Current liabilities $ 62,000 $ 75,000
Long-term liabilities 45,000 36,000
Common stock 150,000 150,000
Retained earnings 158,000 102,000
Total liabilities and equity $415,000 $363,000
150. Express the following income statement information in common-size percents (round to
nearest whole percent). Comment on the results.
Thorsten Corp.
Comparative Income Statements
For Years Ended December 31, 2014 and 2013
2014 2013
Sales $1,200,000 $1,000,000
Cost of goods sold 804,000 650,000
Gross profit $ 396,000 $ 350,000
Selling expenses 132,000 120,000
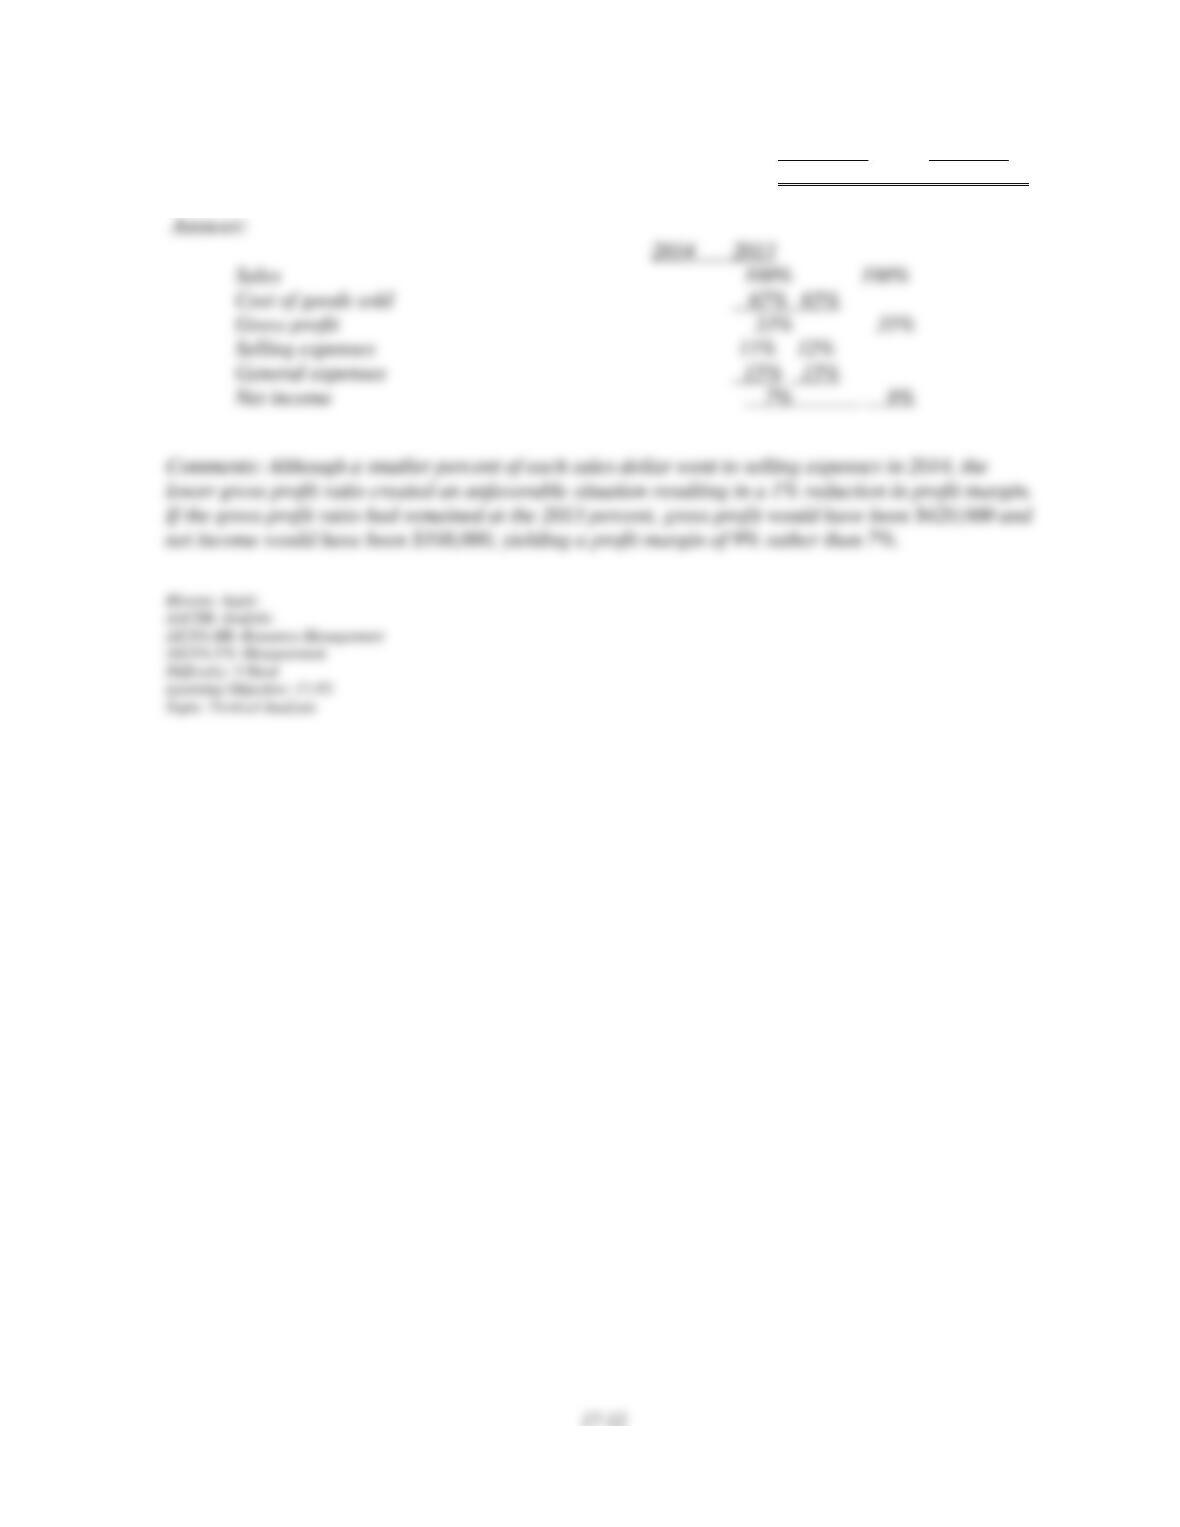
Administrative expenses 180,000 150,000
Net income $ 84,000 $ 80,000
17-13
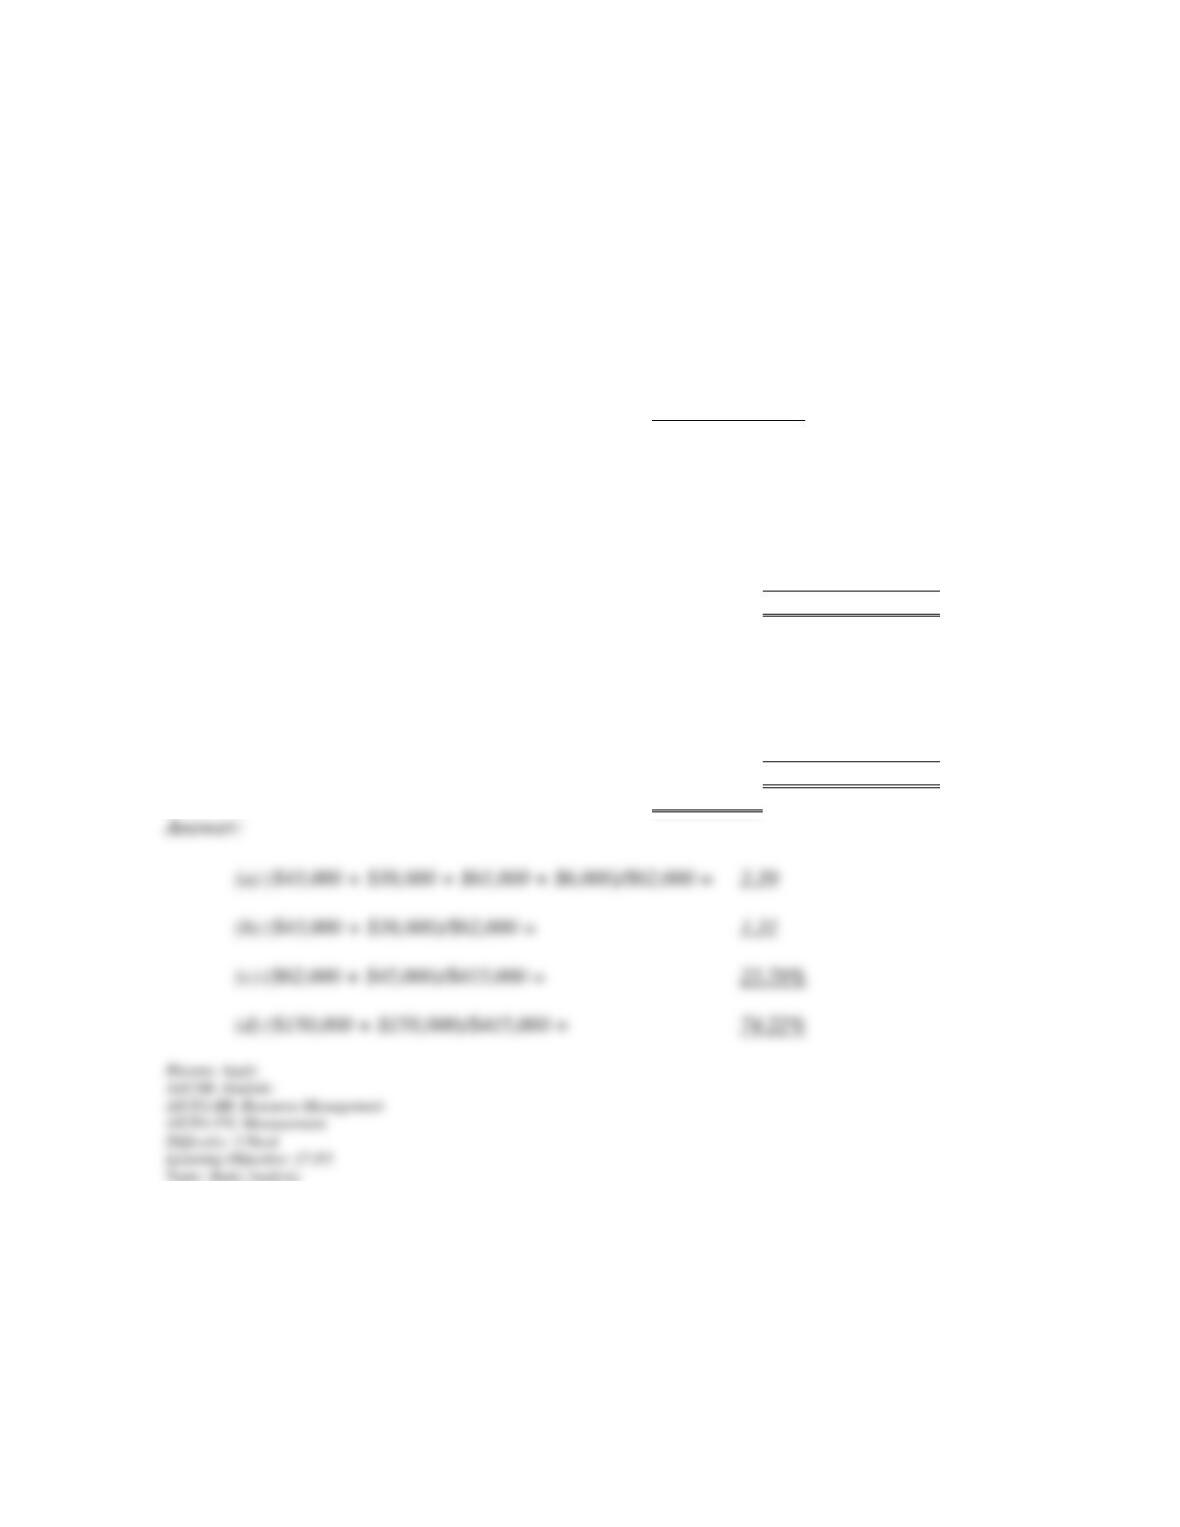
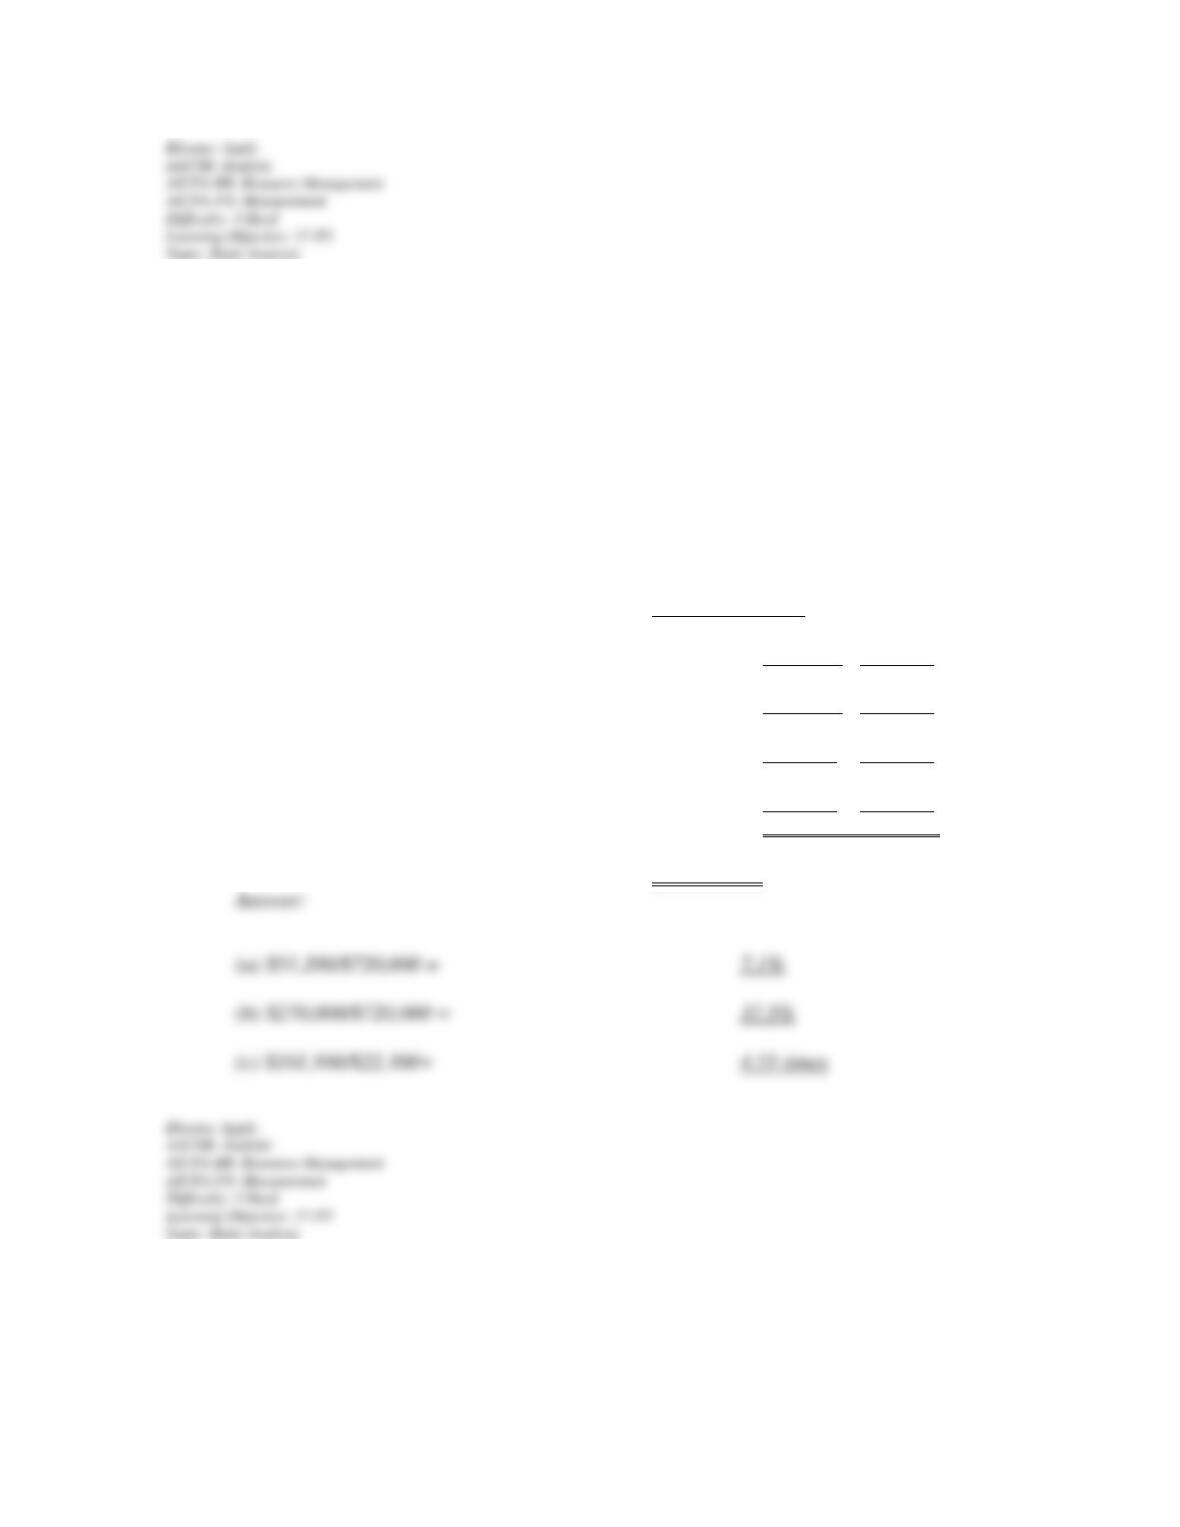
151. Use the balance sheets of Sando shown below to calculate the following ratios for 2014
(round to the hundredths):
(a) Current ratio.
(b) Acid-test ratio.
(c) Debt ratio.
(d) Equity ratio.
Sando Company
Balance Sheets
December 31, 2014 and 2013
2014 2013
Assets:
Cash $ 43,000 $ 22,000
Accounts receivable 38,000 42,000
Merchandise inventory 61,000 52,000
Prepaid insurance 6,000 9,000
Long-term investments 49,000 20,000
Plant assets (net) 218,000 218,000
Total assets $415,000 $363,000
Liabilities and Equity:
Current liabilities $ 62,000 $ 75,000
Long-term liabilities 45,000 36,000
Common stock 150,000 150,000
Retained earnings 158,000 102,000
Total liabilities and equity $415,000 $363,000
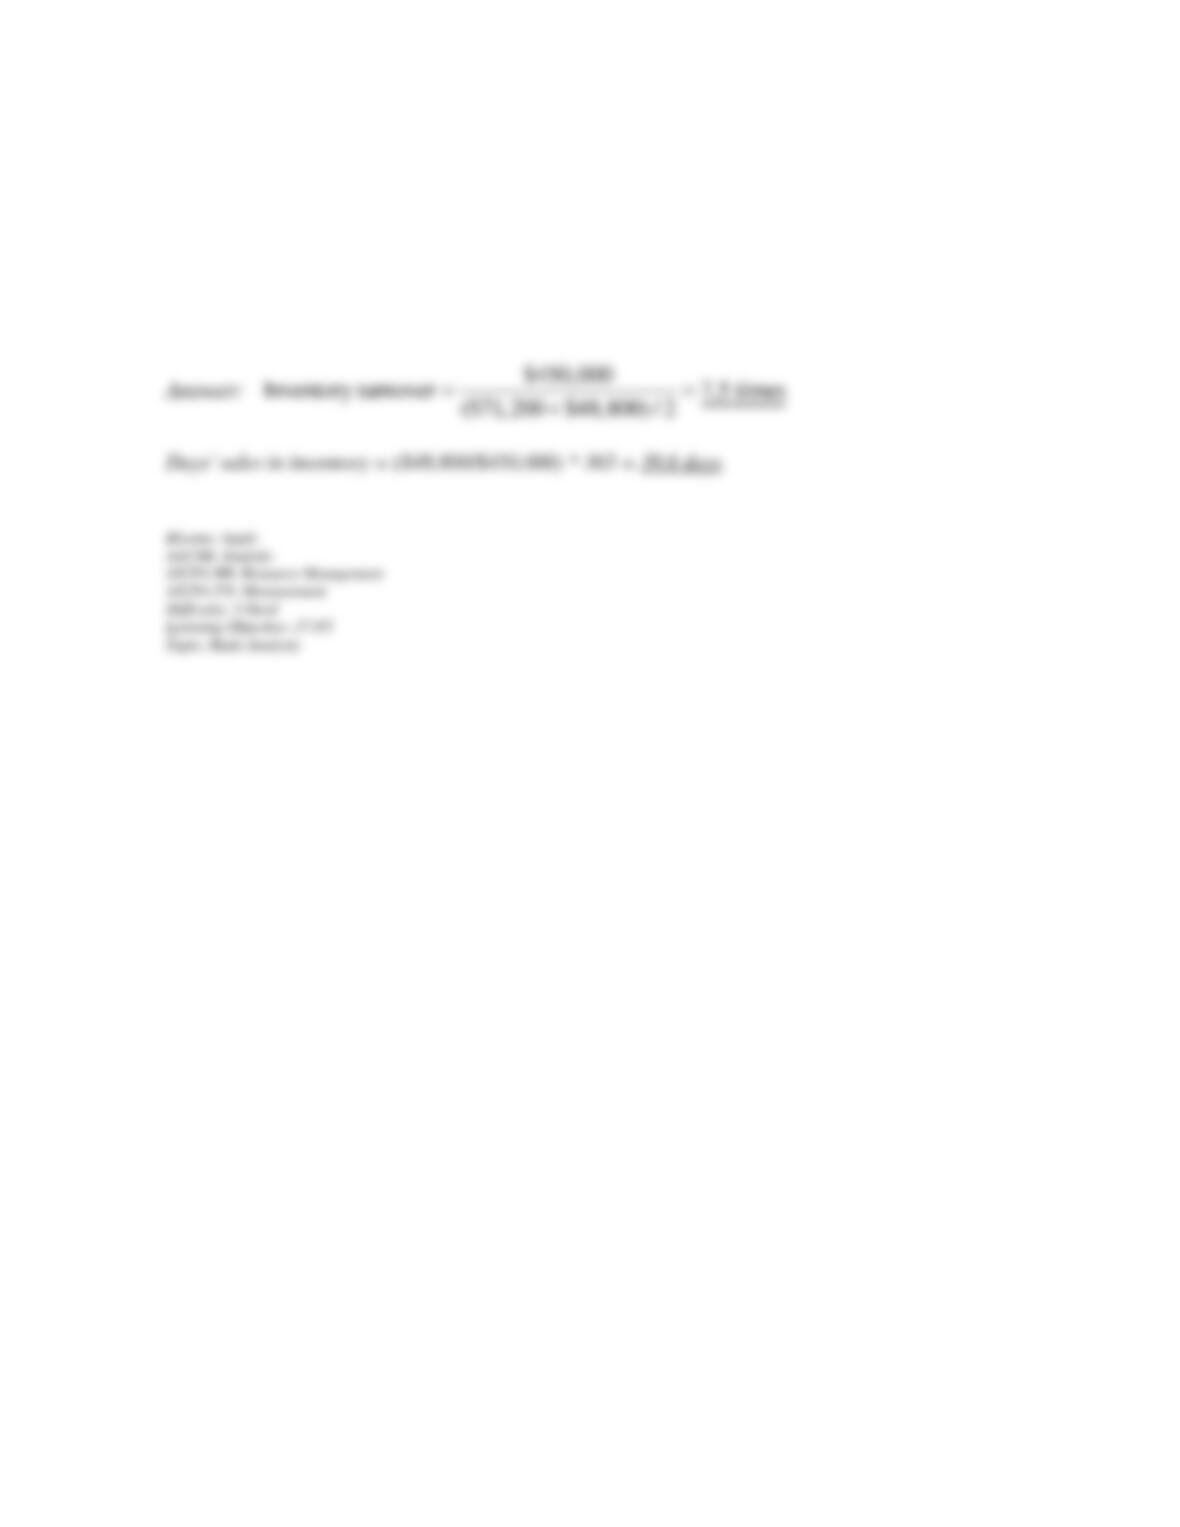
152. The following information is available for the McCartney Corporation:
Sales $750,000
Cost of goods sold 450,000
17-14
Gross profit 300,000
Operating income 85,000
Net income 42,000
Inventory, beginning-year 71,200
Inventory, end-of-year 48,800
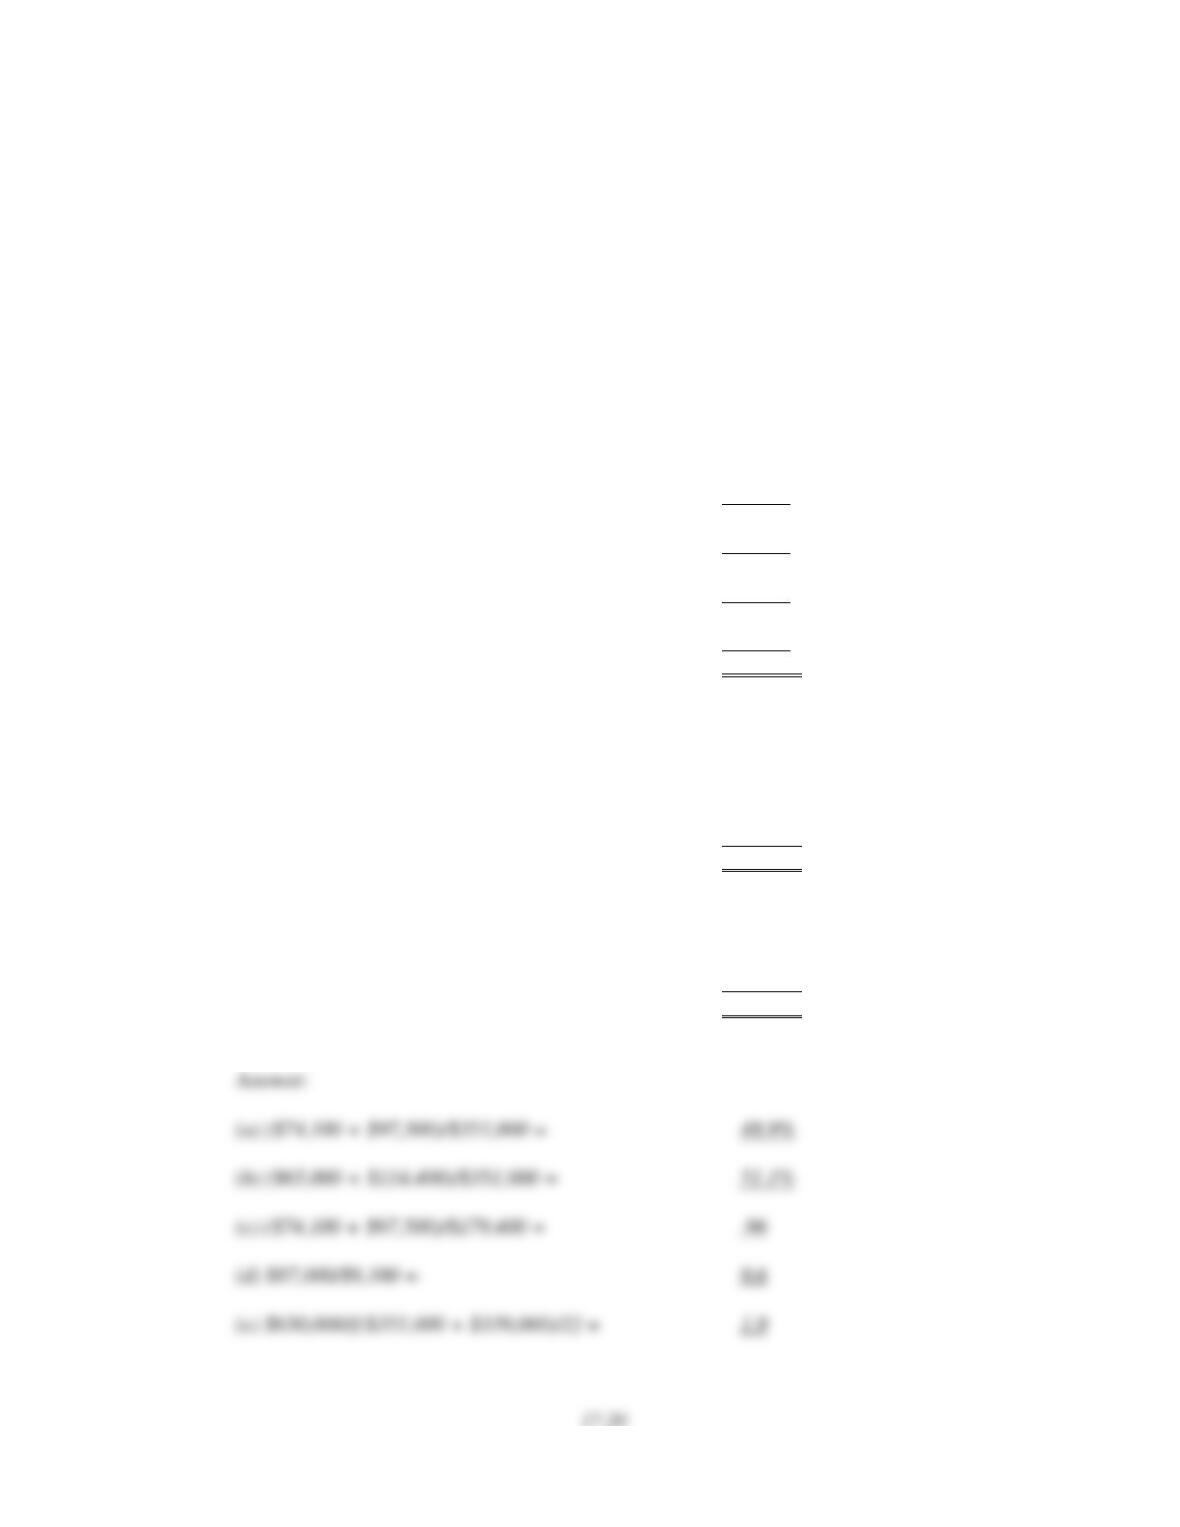
Calculate the company's inventory turnover and its days' sales in inventory.
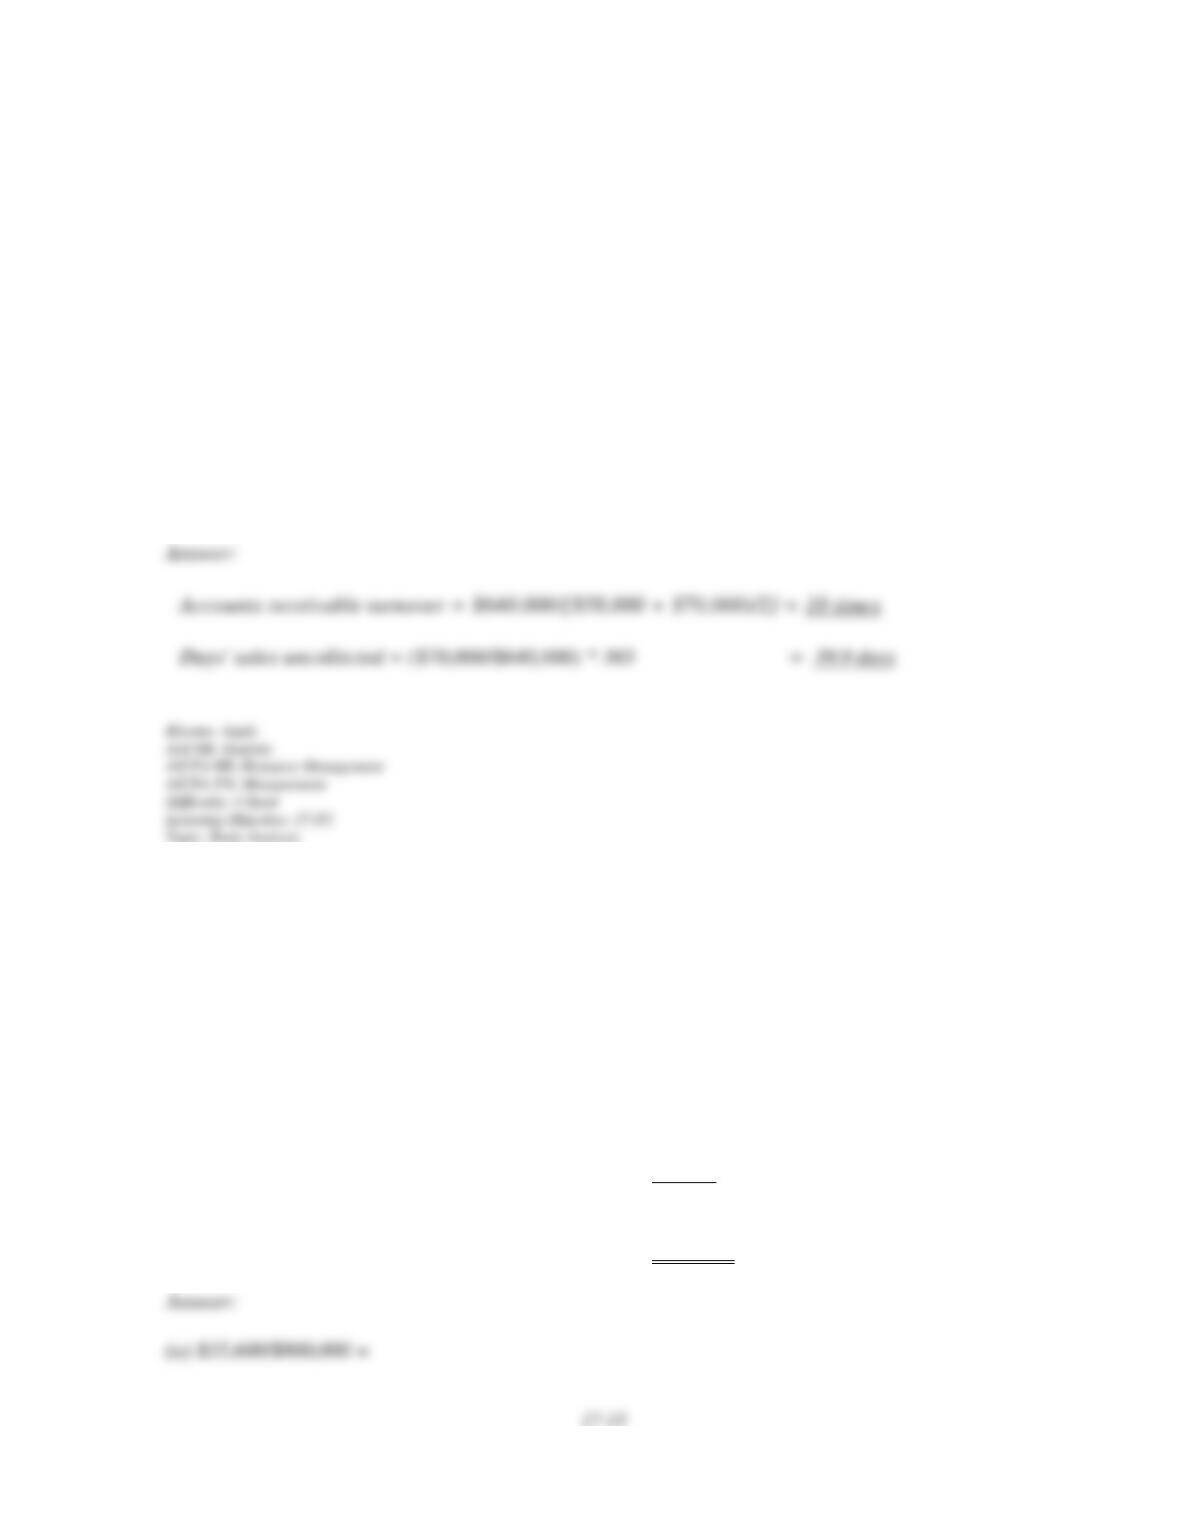
153. The following current year information is available from a manufacturing company:
Sales $640,000
Gross profit on sales 276,000
Operating income 64,000
Income before taxes 44,000
Net income 33,600
Accounts Receivable, beginning-year 58,000
Accounts Receivable, end-of-year 70,000
Calculate the company's accounts receivable turnover and its days' sales uncollected.
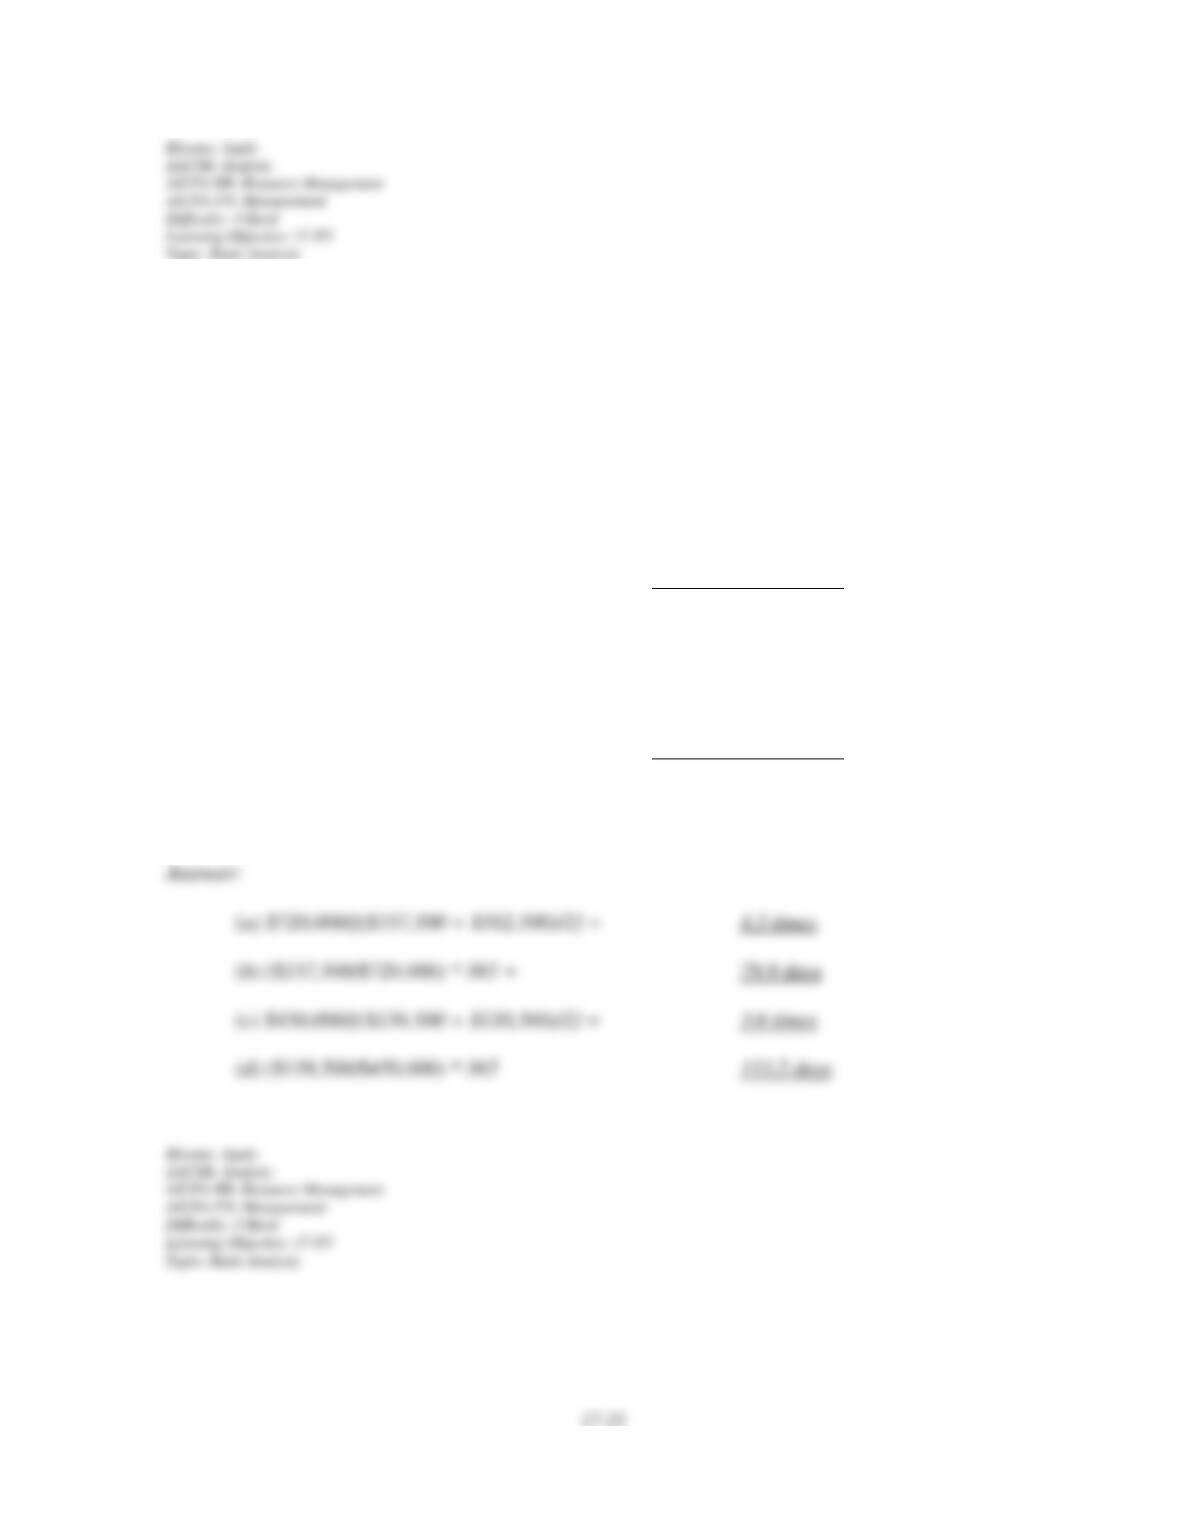
154. Information from a manufacturing company's current year income statement follows.
Calculate the company's (a) profit margin ratio, (b) gross margin ratio, and (c) times interest
earned.
Sales $800,000
Cost of goods sold 455,000
Gross profit $345,000
Operating expenses 265,000
Operating income $ 80,000
Interest expense 32,000
Income before taxes $ 48,000
Income taxes expense 12,400
Net income $ 35,600
155. A company reported net income of $78,000 and had 15,000 common shares outstanding
throughout the current year. At year-end, the price per share of the company's stock was
$49.40. What is the company's year-end price-earnings ratio?
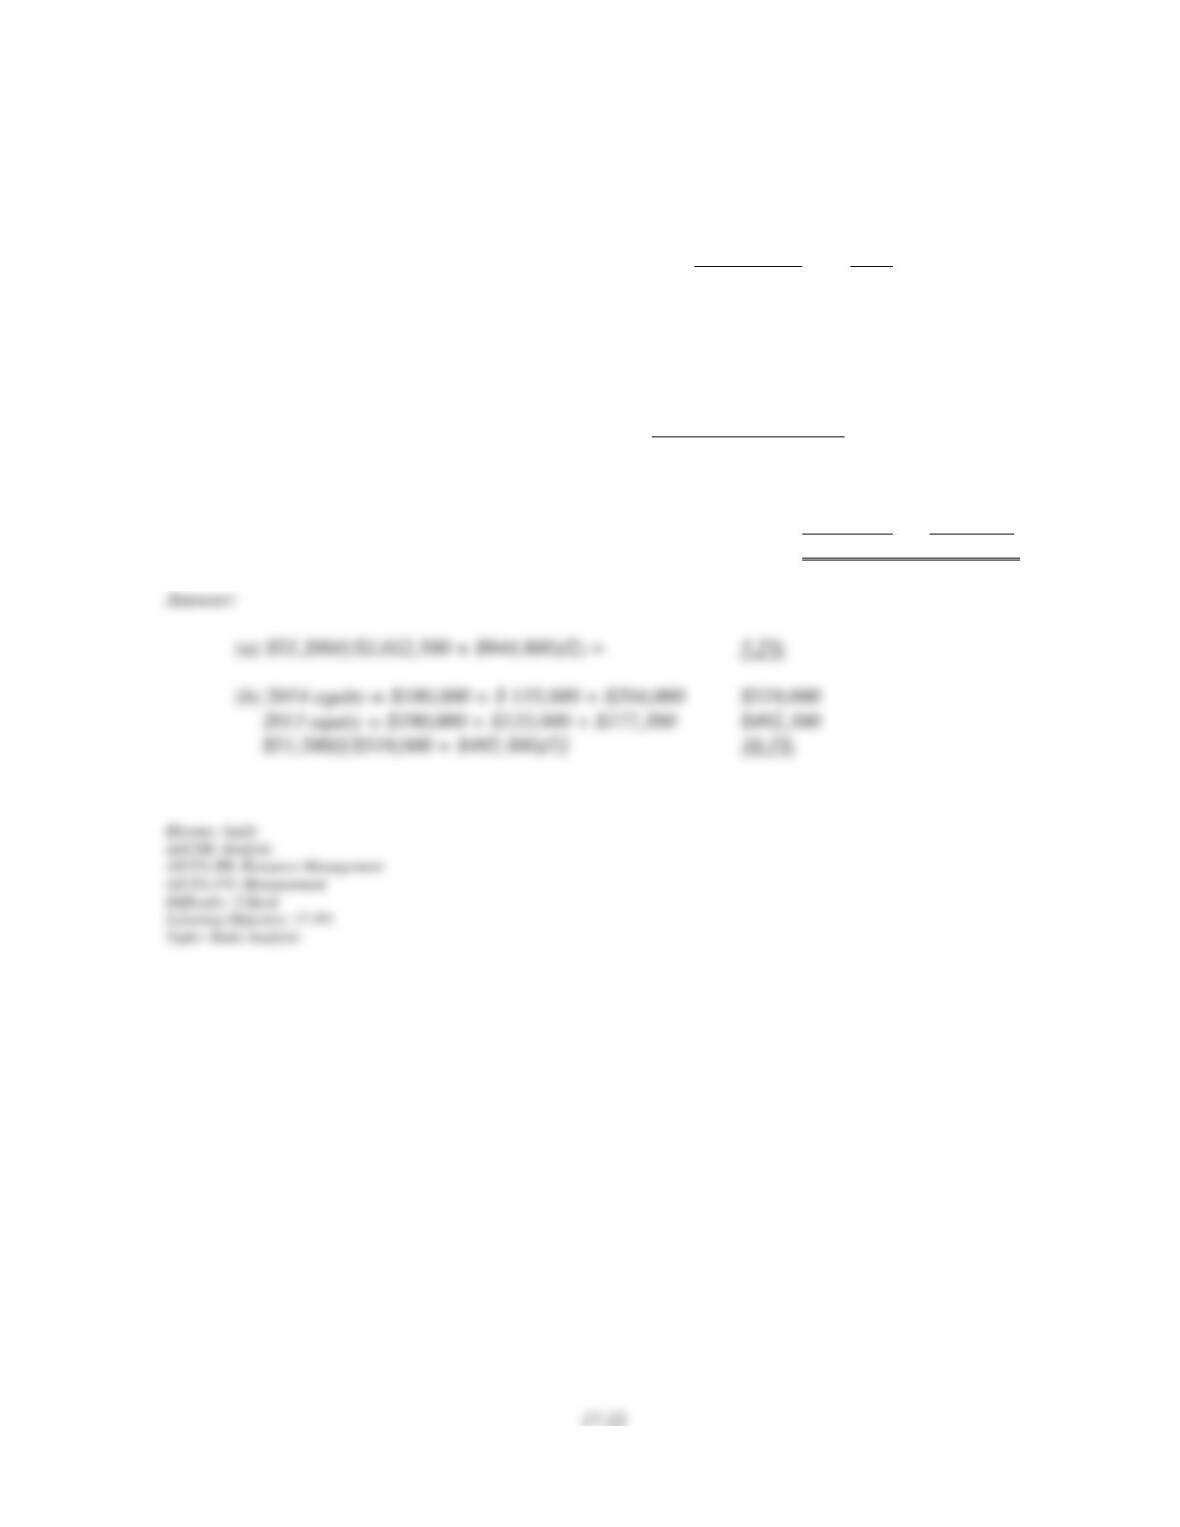
156. A company paid cash dividends on its preferred stock of $40,000 in the current year
when its net income was $120,000 and its average common stockholders' equity was
$640,000. What is the company's return on common stockholders' equity?
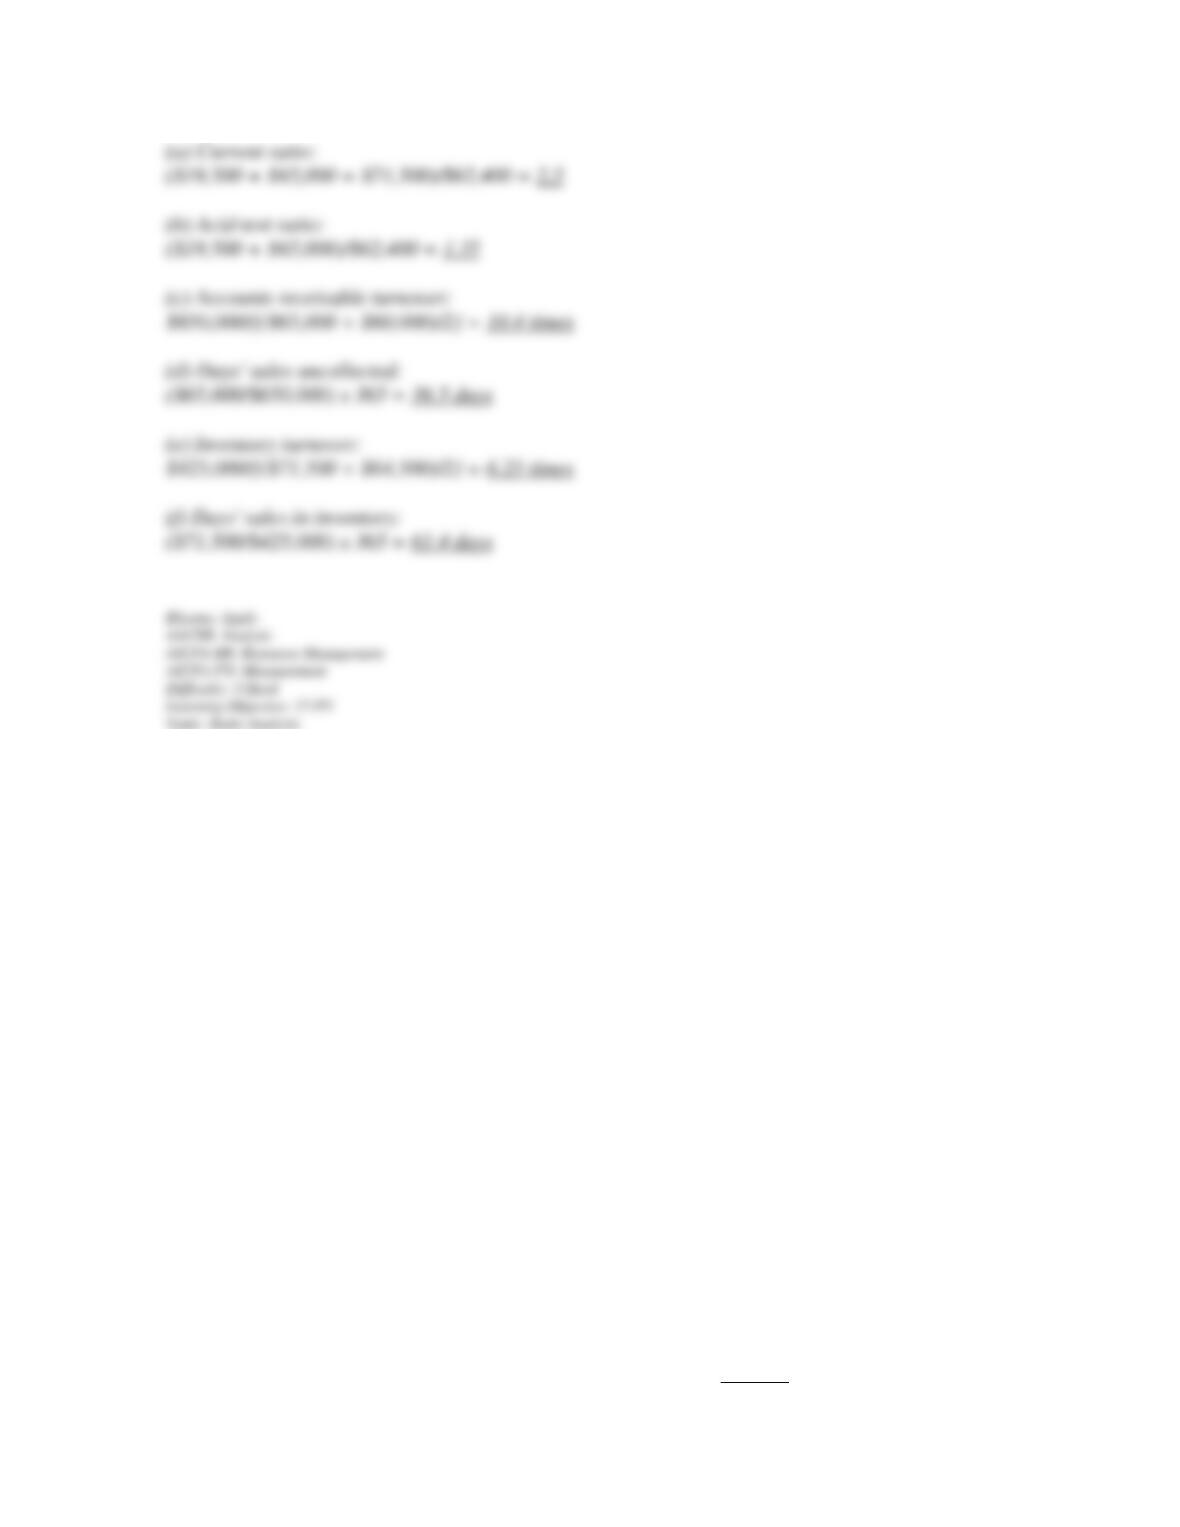
157. Use the financial data shown below to calculate the following ratios for the current year:
(a) Current ratio.
(b) Acid-test ratio.
(c) Accounts receivable turnover.
(d) Days' sales uncollected.
(e) Inventory turnover.
(f) Days' sales in inventory.
Income statement data
Sales (all on credit)………………………………… $650,000
Cost of goods sold…………………………………. 425,000
Income before taxes……………………………….. 78,000
Net income………………………………………… 54,600
Ending
Balances Beginning
Balances
Cash $ 19,500 $ 15,000
Accounts receivable (net) 65,000 60,000
Inventory 71,500 64,500
Plant and equipment (net) 195,000 183,900
Total assets $351,000 $323,400
Current liabilities $ 62,400 $ 52,700
Long-term notes payable 97,500 100,000
17-18
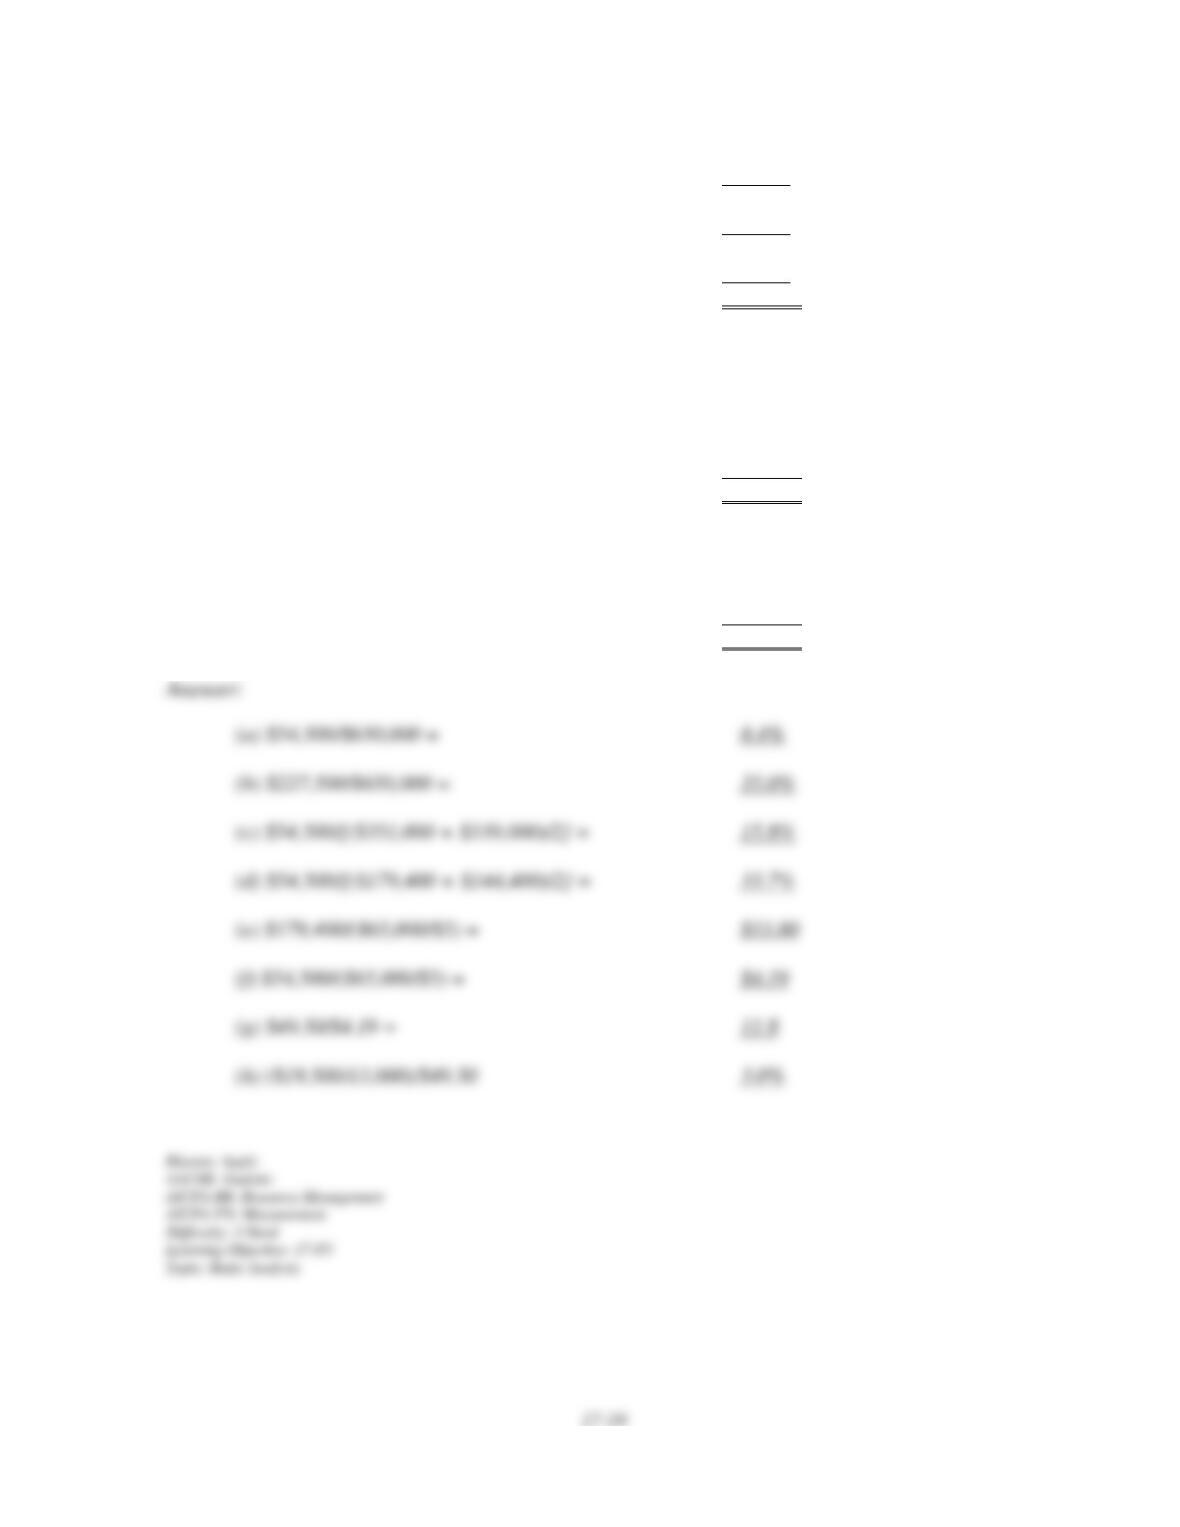
158. A company's calendar-year financial data are shown below. The company had total
assets of $339,000 and total equity of $144,400 for the prior year. No additional shares of
common stock were issued during the year. The December 31 market price per share is
$49.50. Cash dividends of $19,500 were paid during the year. Calculate the following ratios
for the company:
(a) profit margin ratio
(b) gross margin ratio
(c) return on total assets
(d) return on common stockholders’ equity
(e) book value per common share
(f) basic earnings per share
(g) price earnings ratio
(h) dividend yield.
Net sales $650,000
Cost of goods sold 422,500
Gross profit $227,500
Operating expenses 140,500
Operating income $ 87,000
Interest expense 9,100
Income before taxes $ 77,900
Income taxes 23,400
Net income $ 54,500
Ending
Balances
Cash $ 19,500
Accounts receivable (net) 65,000
Inventory 71,500
Plant assets (net) 195,000
Total assets $351,000
Current liabilities $ 74,100
Long-term notes payable 97,500
Common stock, $5 par value 65,000
Retained earnings 114,400
Total liabilities and equity $351,000
159. A company's calendar-year financial data are shown below. The company had total
assets of $339,000 and total equity of $144,400 for the prior year. No additional shares of
common stock were issued during the year. The December 31 market price per share is
$49.50. Cash dividends of $19,500 were paid during the year. Calculate the following ratios
for the company:
(a) debt ratio
(b) equity ratio
(c) debt-to-equity ratio
(d) times interest earned
(e) total asset turnover
Net sales $650,000
Cost of goods sold 422,500
Gross profit $227,500
Operating expenses 140,500
Operating income $ 87,000
Interest expense 9,100
Income before taxes $ 77,900
Income taxes 23,400
Net income $ 54,500
Ending
Balances
Cash $ 19,500
Accounts receivable (net) 65,000
Inventory 71,500
Plant assets (net) 195,000
Total assets $351,000
Current liabilities $ 74,100
Long-term notes payable 97,500
Common stock, $5 par value 65,000
Retained earnings 114,400
Total liabilities and equity $351,000
160. Comparative calendar-year financial data for a company are shown below. Calculate the
following ratios for the company for 2014:
(a) accounts receivable turnover
(b) day’s sales uncollected
(c) inventory turnover
(d) days’ sales in inventory
2014 2013
Sales $ 720,000 $607,500
Cost of goods sold 450,000 382,700
Operating expenses 168,500 134,900
Net income 51,200 51,700
December 31, December 31,
2014 2013
Accounts receivable (net) $ 157,500 $162,500
Inventory 139,500 110,500
Total assets 1,012,500 944,800
161. Comparative calendar year financial data for a company are shown below. Calculate the
following ratios for 2014:
(a) return on total assets
(b) return on common stockholders' equity.
2014 2013
Sales $ 720,000 $ 607,500
Gross profit 270,000 224,800
Income before taxes 79,200 78,700
Net income 51,200 51,700
December 31, December 31,
2014 2013
Liabilities $ 493,500 $ 452,500
Common stock ($12 par) 180,000 180,000
Contributed capital in excess of par 135,000 135,000
Retained earnings 204,000 177,300
Total liabilities and equity $1,012,500 $ 944,800
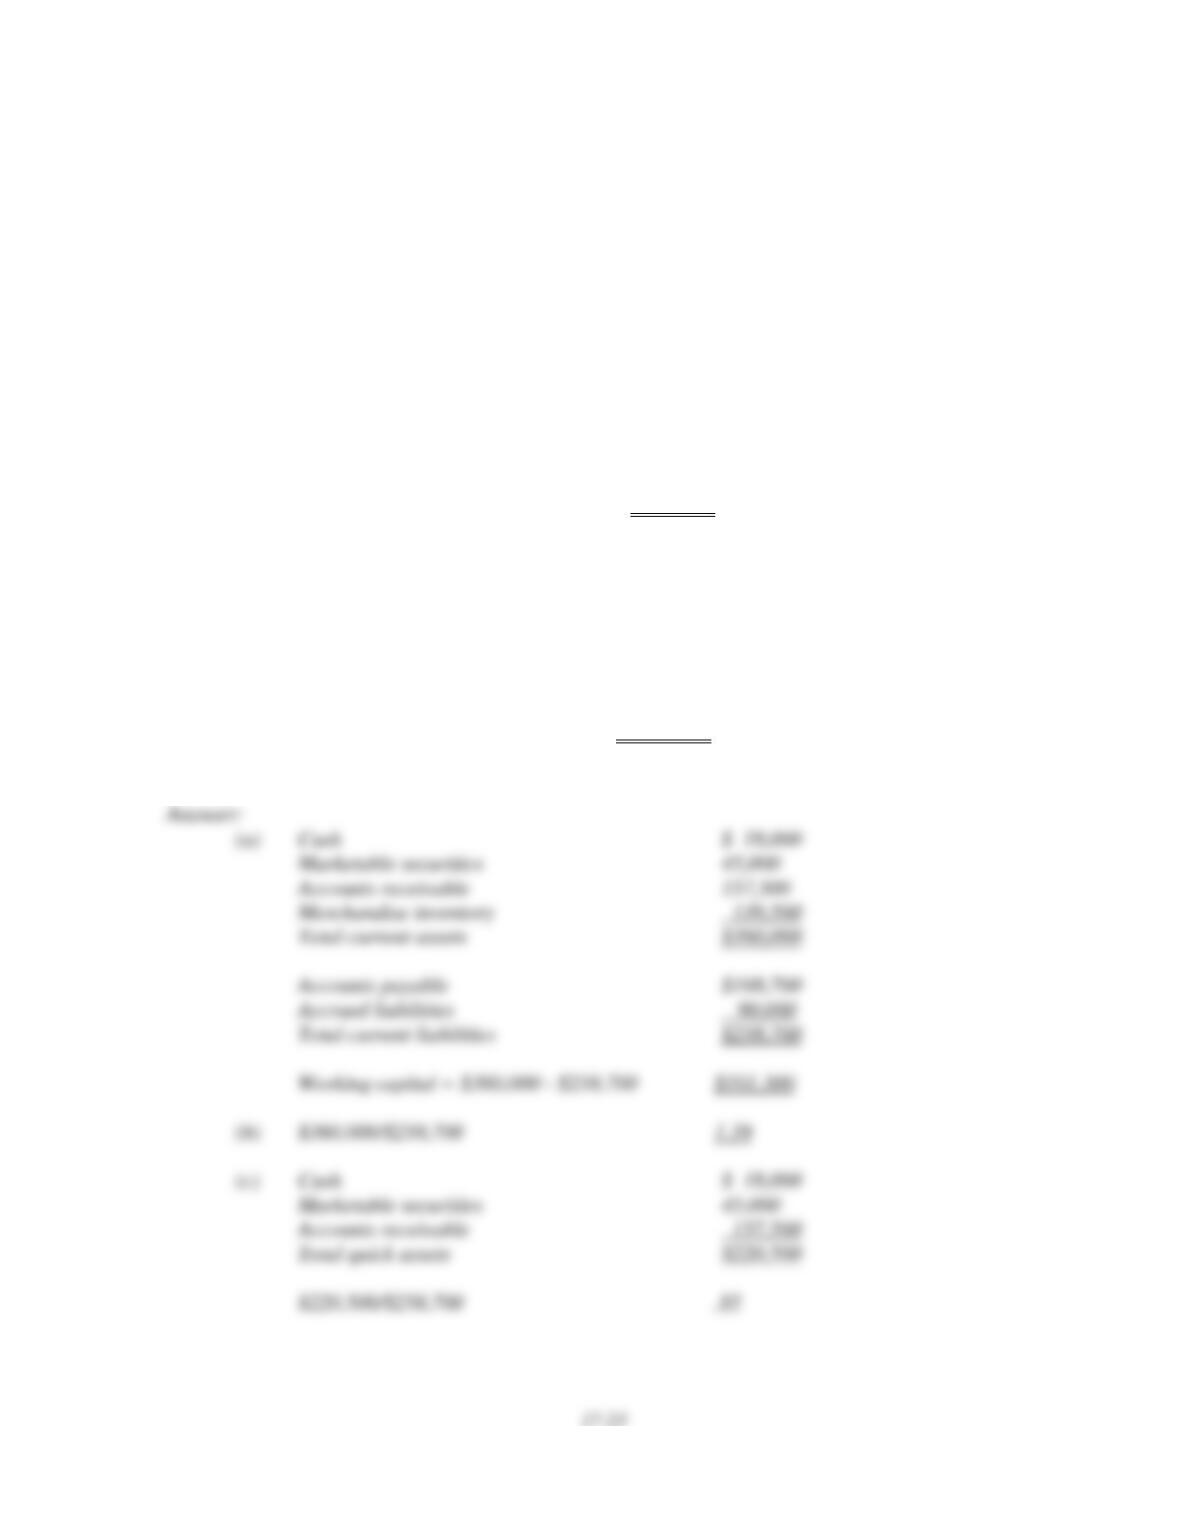
162. The current year-end balance sheet data for a company are shown below. Calculate the
company's:
(a) working capital
(b) current ratio
(c) acid-test ratio.
Assets:
Cash .................................................................... $ 18,000
Marketable securities ......................................... 45,000
Accounts receivable (net) .................................. 157,500
Merchandise inventory ....................................... 139,500
Long-term investments ...................................... 135,000
Plant assets (net) ................................................. 517,500
Total assets ......................................................... $ 1,012,500
Liabilities and equity:
Accounts payable ............................................... $ 168,700
Accrued liabilities .............................................. 90,000
Notes payable (secured by plant assets) 234,800
Common stock ($12 par) ................................... 180,000
Contributed capital in excess of par .................. 135,000
Retained earnings ............................................... 204,000
Total liabilities and equity ................................ $1,012,500
17-24
163. The comparative income statements for Golden Company are shown below. Calculate
the following ratios for 2014:
(a) profit margin
(b) gross margin
(c) times interest earned.
Golden Company
Income Statements
For Years Ended December 31, 2014 and 2013
2014 2013
Net sales $720,000 $607,500
Cost of goods sold 450,000 382,700
Gross profit $270,000 $224,800
Operating expense 168,500 134,900
Income from operations $101,500 $ 89,900
Interest expense 22,300 11,200
Income before taxes $ 79,200 $ 78,700
Income taxes 28,000 27,000
Net income $ 51,200 $ 51,700
164. A corporation reports the following year-end balance sheet data. Calculate the following
ratios:


