117. Wheat Inc. has an exclusive contract with an exporter. Two brands of wheat are imported,
labeled AB and CD. The following data are provided for the current fiscal year:
Budgeted Actual Results
AB CD AB CD
Price per bushel $20 $10 $25 $12
Variable cost per bushel $15 $5 $15 $8
Sales (in bushels) 1,500 2,500 1,200 3,600
The total market was estimated to 40,000 bushels at the time of budget. The actual total market
for the year is 32,000 bushels.
What is the firm’s market size variance?
118. Which of the following is not a key determinant of productivity for most organizations?
119. Which of the following is a total productivity measure?
120. A firm manufactures 5,000 umbrellas per year. The umbrellas cost $25,000 to
manufacture. The firm has an annual overhead cost of $5,000. What is the total productivity of
manufacturing umbrellas?
121. Which of the following is not an element of a product’s sales quantity variance?
122. Which of the following is not a part of the sales mix variance equation?
123. The market share variance measures the effect of the difference in market shares on the
firm’s total contribution margin and:
124. Julie Hilger started New Treads to combine fashion and sustainability. The original
production of sandals made from recycled plastic has expanded to a complete line of casual
footwear. Current sales total over $2 million. Julie hired the firm’s first controller early this year,
and has asked him to detail suggestions for ways to increase profits. Adrian Warring, the new
controller, has compiled a list of recommended changes that focus on quality improvements. New
Treads customers expect high quality at a low price, a “value” product. So the company must
simultaneously watch costs and quality. After receiving his list of suggestions, Julie calls Adrian
to her office and says, “I don’t see how improving quality can increase productivity. In fact, it
seems to me that efforts to improve quality will slow down production and decrease productivity.”
Required:
Using specific examples, help Adrian explain to Julie why efforts to improve quality can also boost
productivity. How does productivity play a role in the firm’s strategy and competitive
environment?
125. Dr. Howard Abelson is the director of the Wellness House, a residential center for
recovering alcoholics. A typical patient spends 3-4 weeks in an intensive program of
rehabilitation. The Wellness House has a staff of 45, including 12 certified therapists, to serve an
average patient load of 15. Howard Abelson is attempting to develop some productivity measures
for the center, but is not aware of the limitations of productivity measurement in not–for-profit
organizations. You have been called in as a consultant to help develop appropriate productivity
measures.
Required:
(a) Identify any major differences/limitations you face in developing performance measures for
the Wellness House.
(b) Recommend two or three overall measures of productivity that are appropriate for the
Wellness House as a not-for-profit organization.

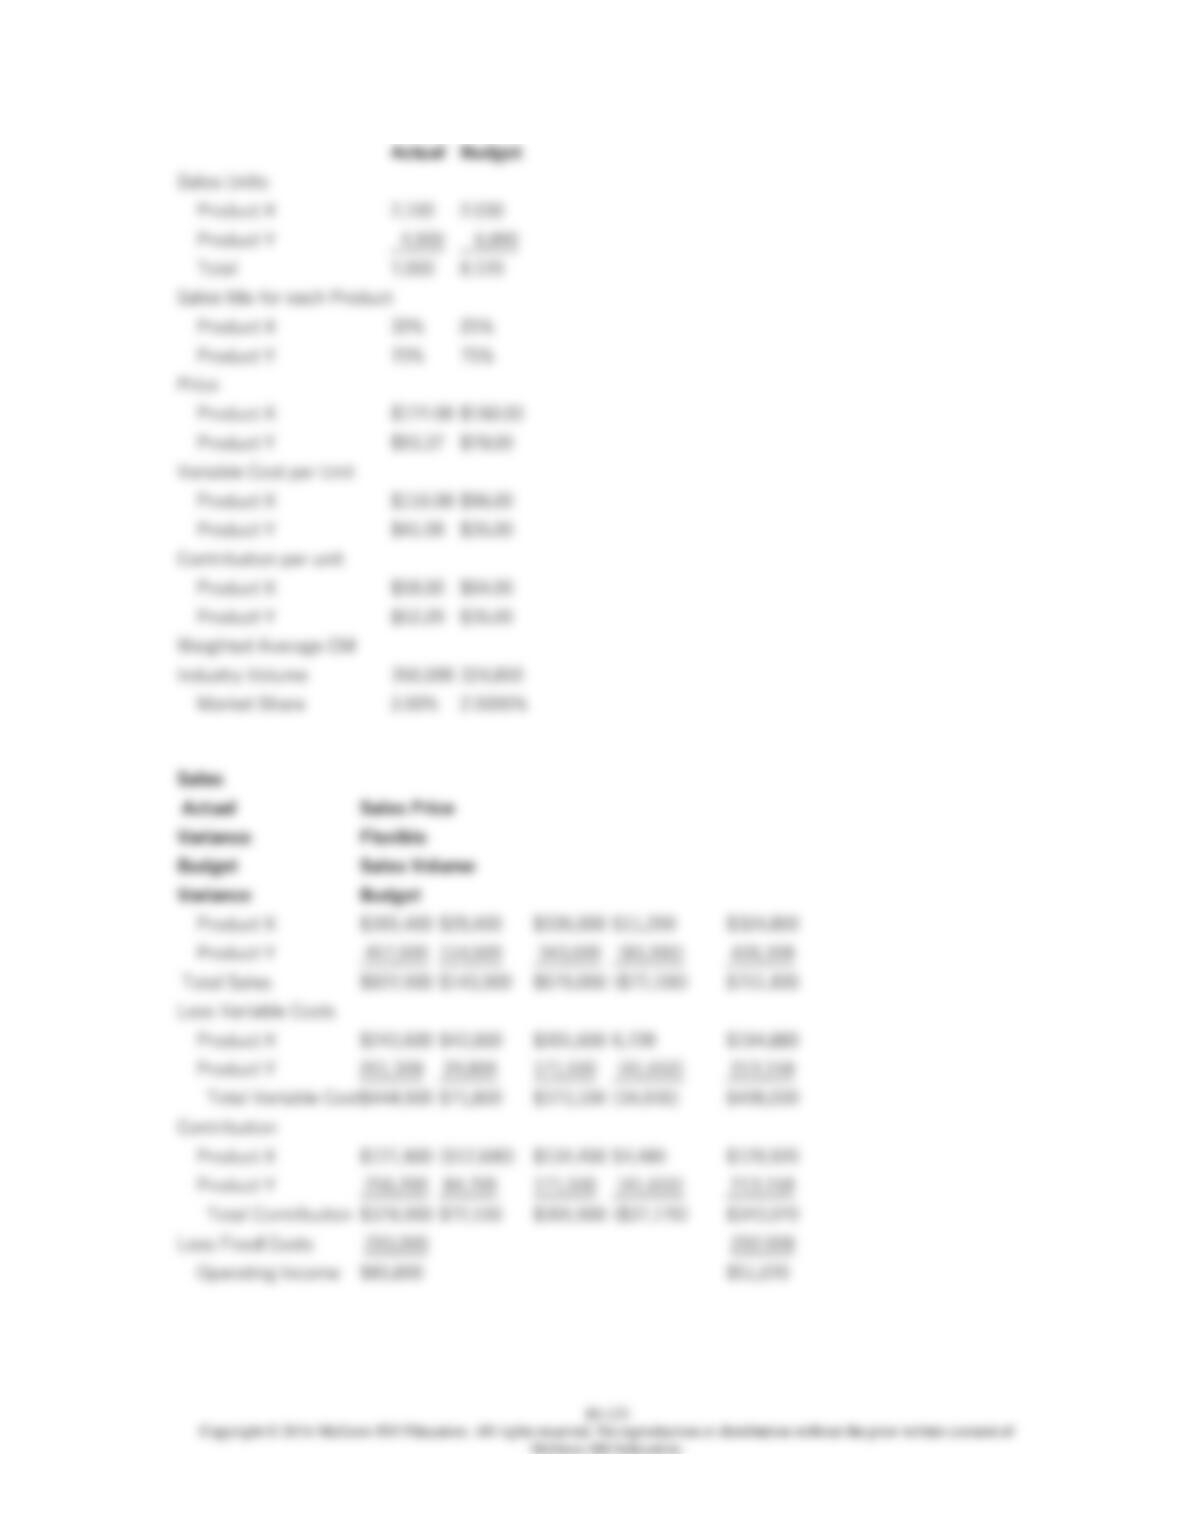
126. Paquindo Co. has two products: X and Y. The firm had the following budget and operating
results for the period just ended. The budgeted total industry sales for both products was
324,800 units and the actual industry sales was 350,000.
Master Budget
Product X Product Y Total
Sales $324,800 $426,300 $751,100
Variable costs 194,880 213,150 408,030
Contribution margin 129,920 213,150 $343,070
Fixed costs 162,000 130,000 292,000
Operating income ($32,080) $83,150 $51,070
Selling price per unit $160 $70
Operating Results Product X Product Y Total
Sales $365,400 $457,500 $822,900
Variable costs 243,600 201,300 444,900
Contribution margin 121,800 256,200 378,000
Fixed costs 163,000 130,000 293,000
Operating income ($41,200) $126,200 $85,000
Units sold 2,100 4,900
Required:
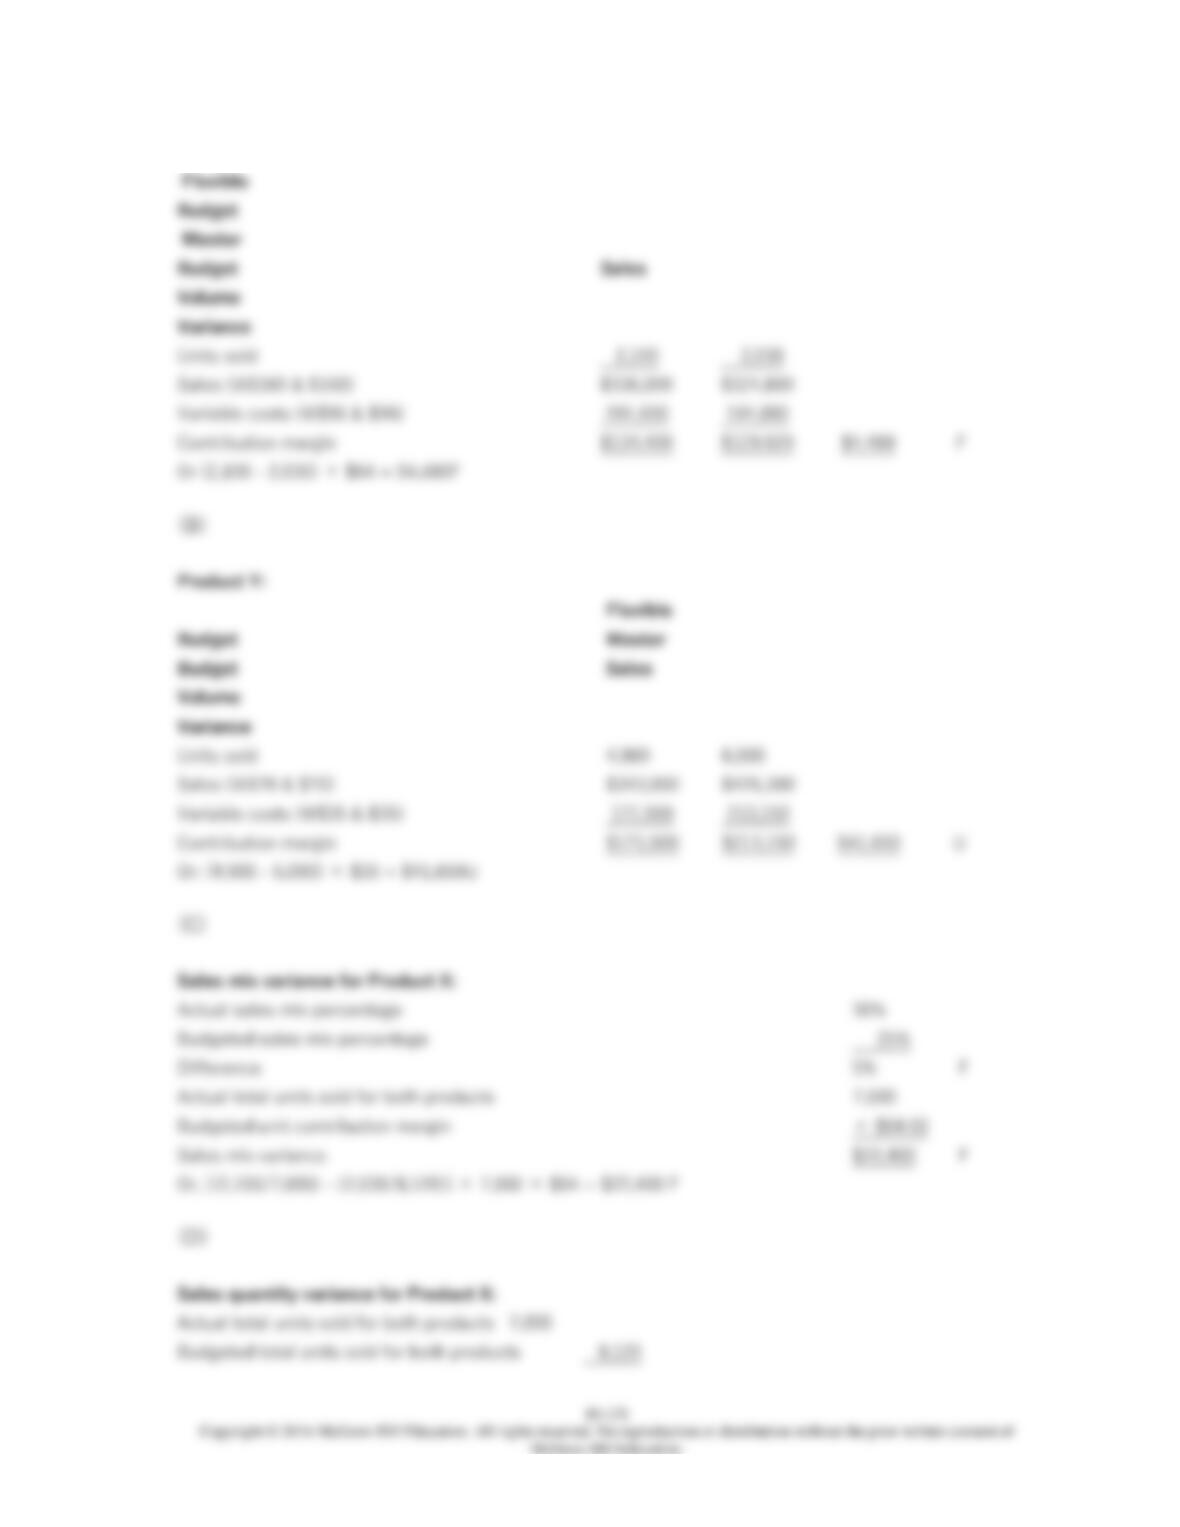
(A) Calculate the contribution margin sales volume variance for Product X.
(B) Calculate the contribution margin sales volume variance for Product Y.
(C) Calculate the sales mix variance for Product X.
(D) Calculate the sales quantity variance for Product X.
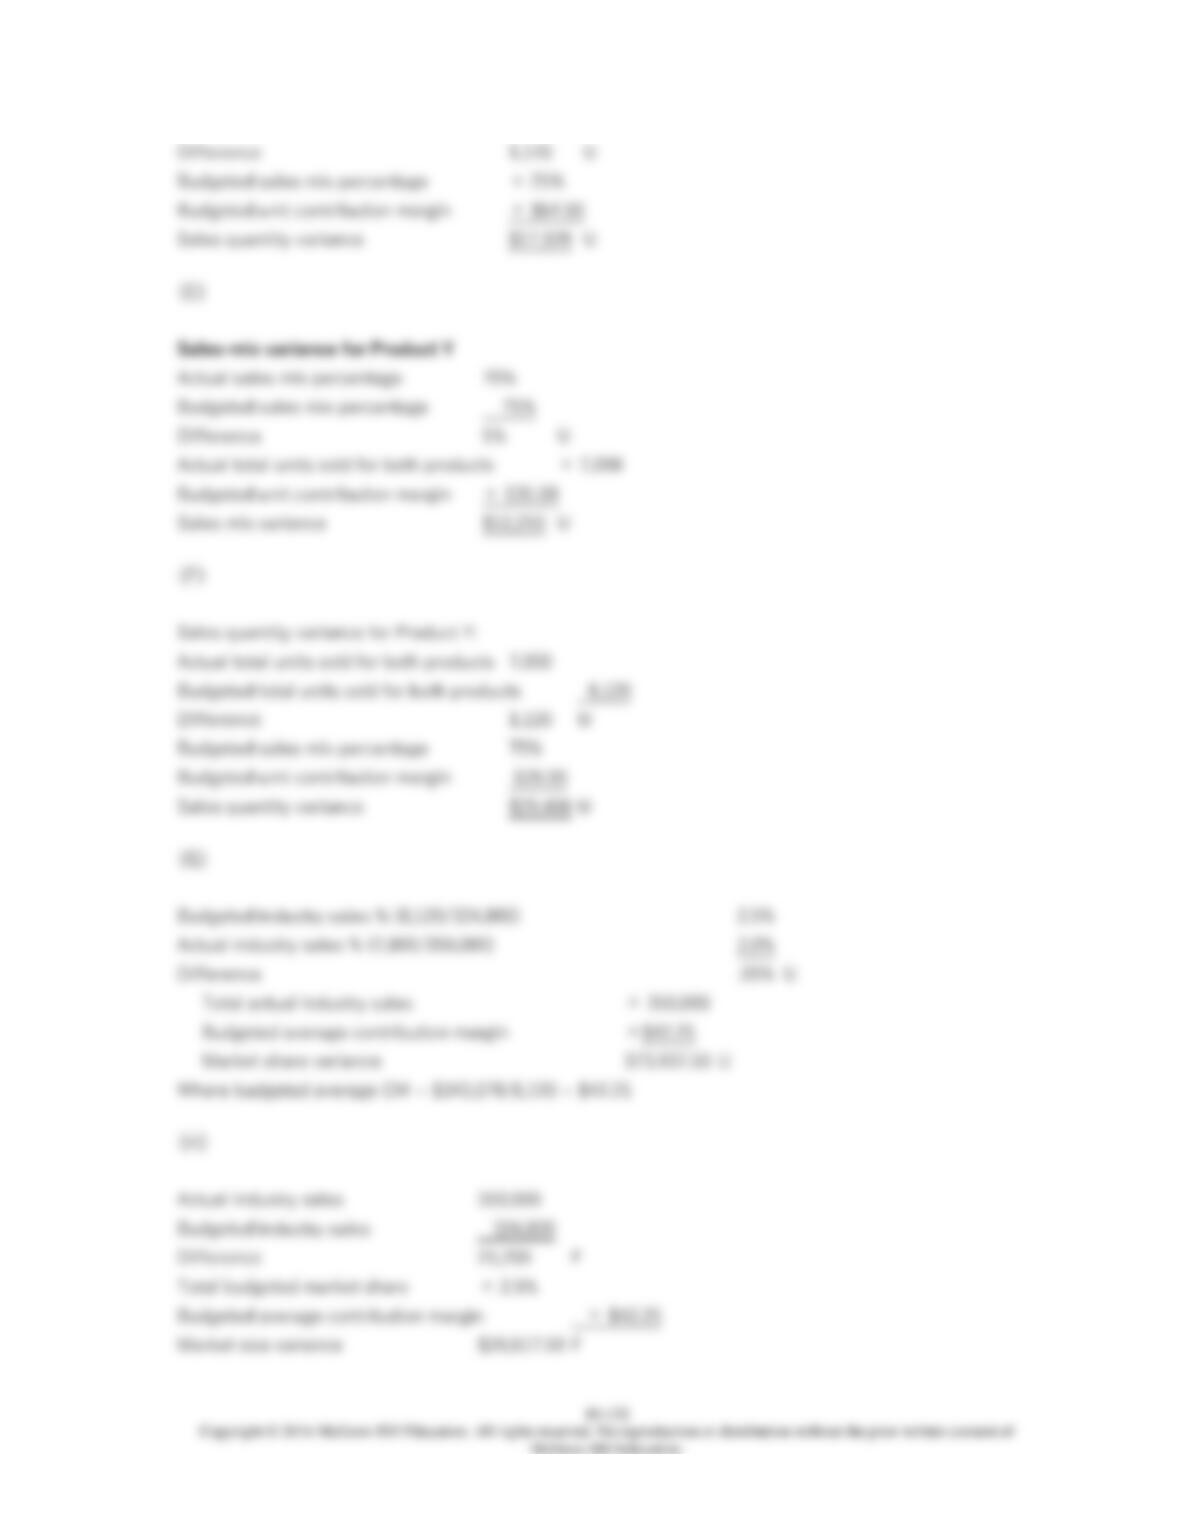
(E) Calculate the sales mix variance for Product Y.
(F) Calculate the sales quantity variance for Product Y.
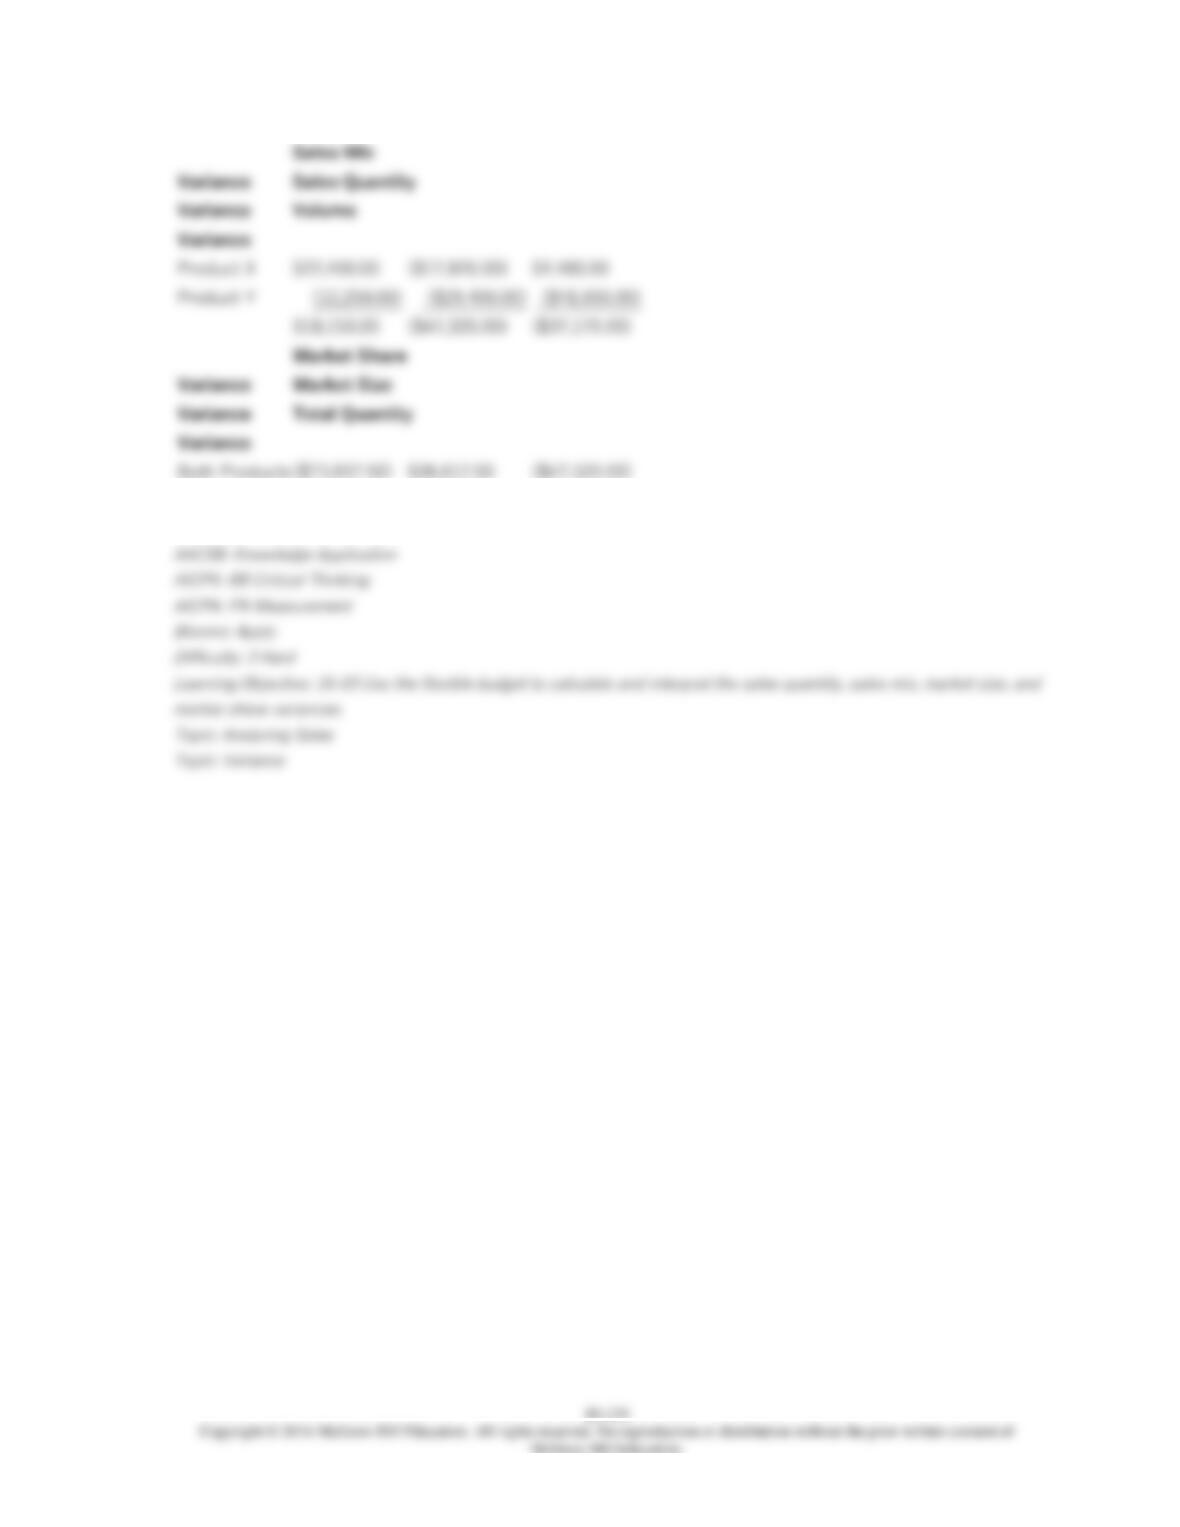
(G) Calculate the market share variance for both products.
(H) Calculate the market size variance for both products.

127. Zeller Company had two products named Q and R. The firm had the following budget for
the period just ended:
Master Budget
Product Q Product R Total
Sales $100,000 $150,000 $250,000
Variable costs 75,000 127,500 202,500
Contribution margin 25,000 22,500 47,500
Fixed costs 10,000 8,000 18,000
Operating income $15,000 $14,500 $29,500
Selling price per unit $100 $100
Operating Results
Actual Results Product Q Product R Total
Sales $110,000 $168,000 $278,000
Variable costs 82,500 112,000 194,500
Contribution margin 27,500 56,000 83,500
Fixed costs 10,000 8,000 18,000
Operating income $17,500 $48,000 $65,500
Units sold 1,100 1,400
Required:
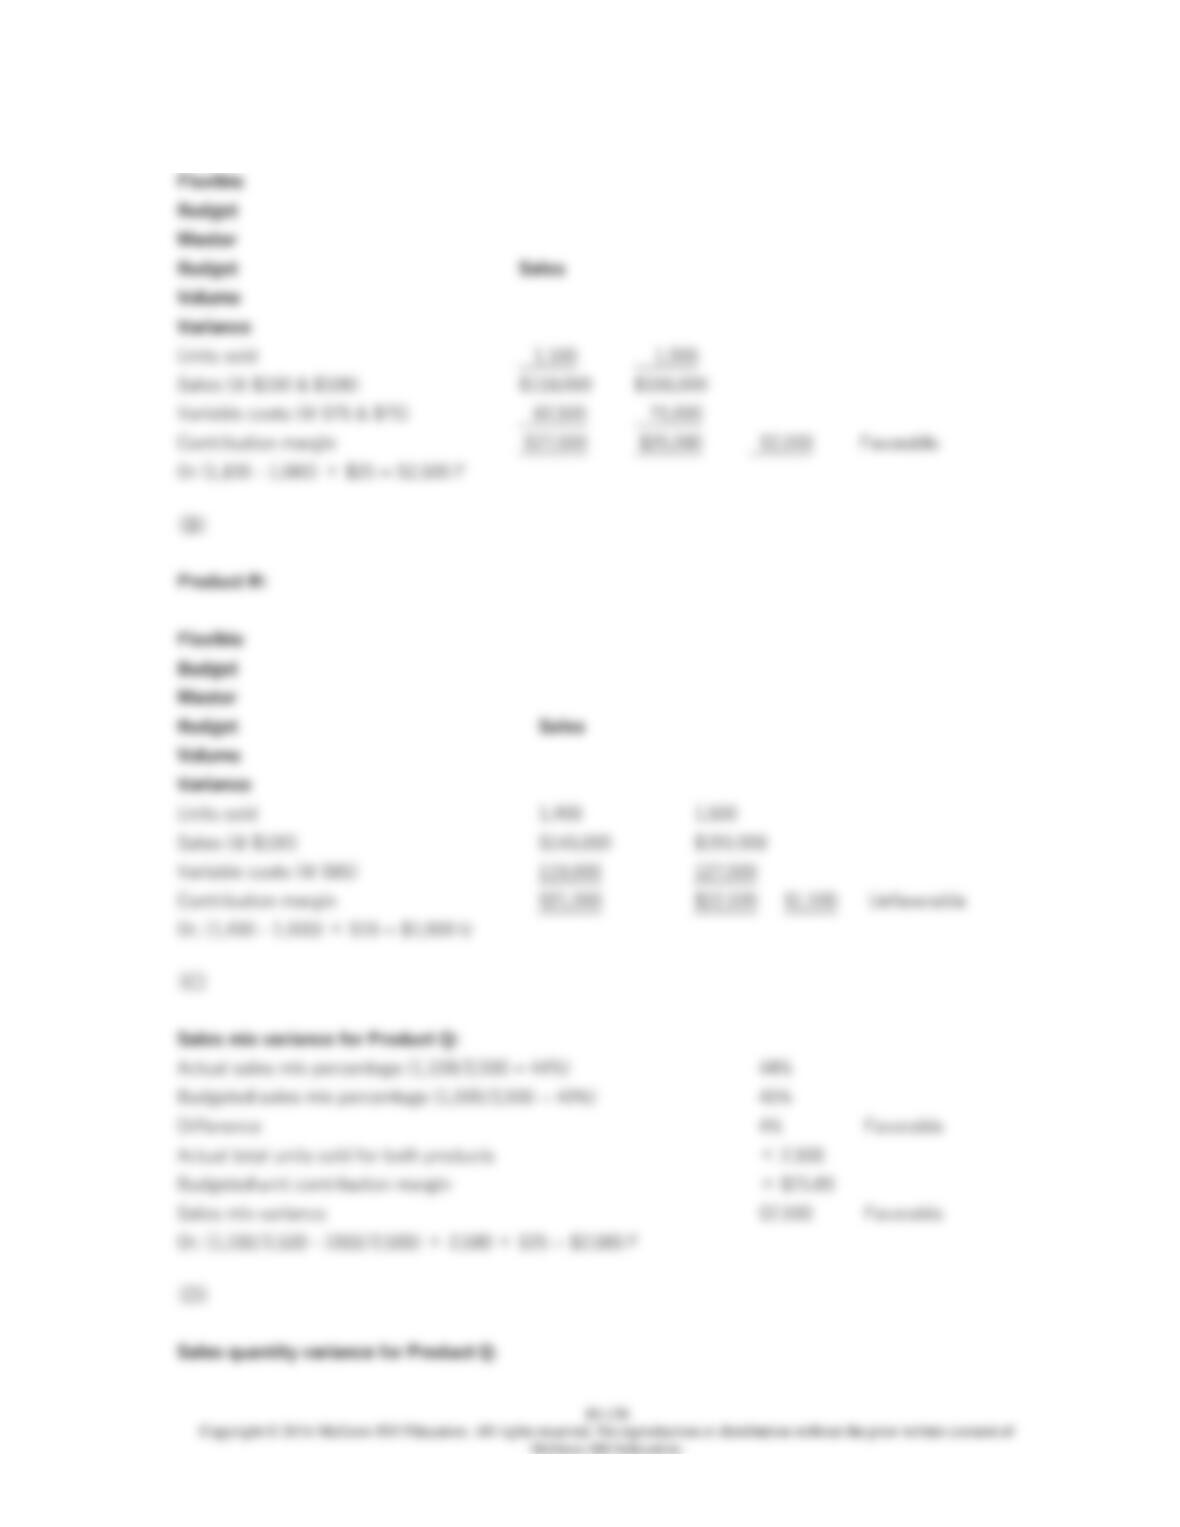
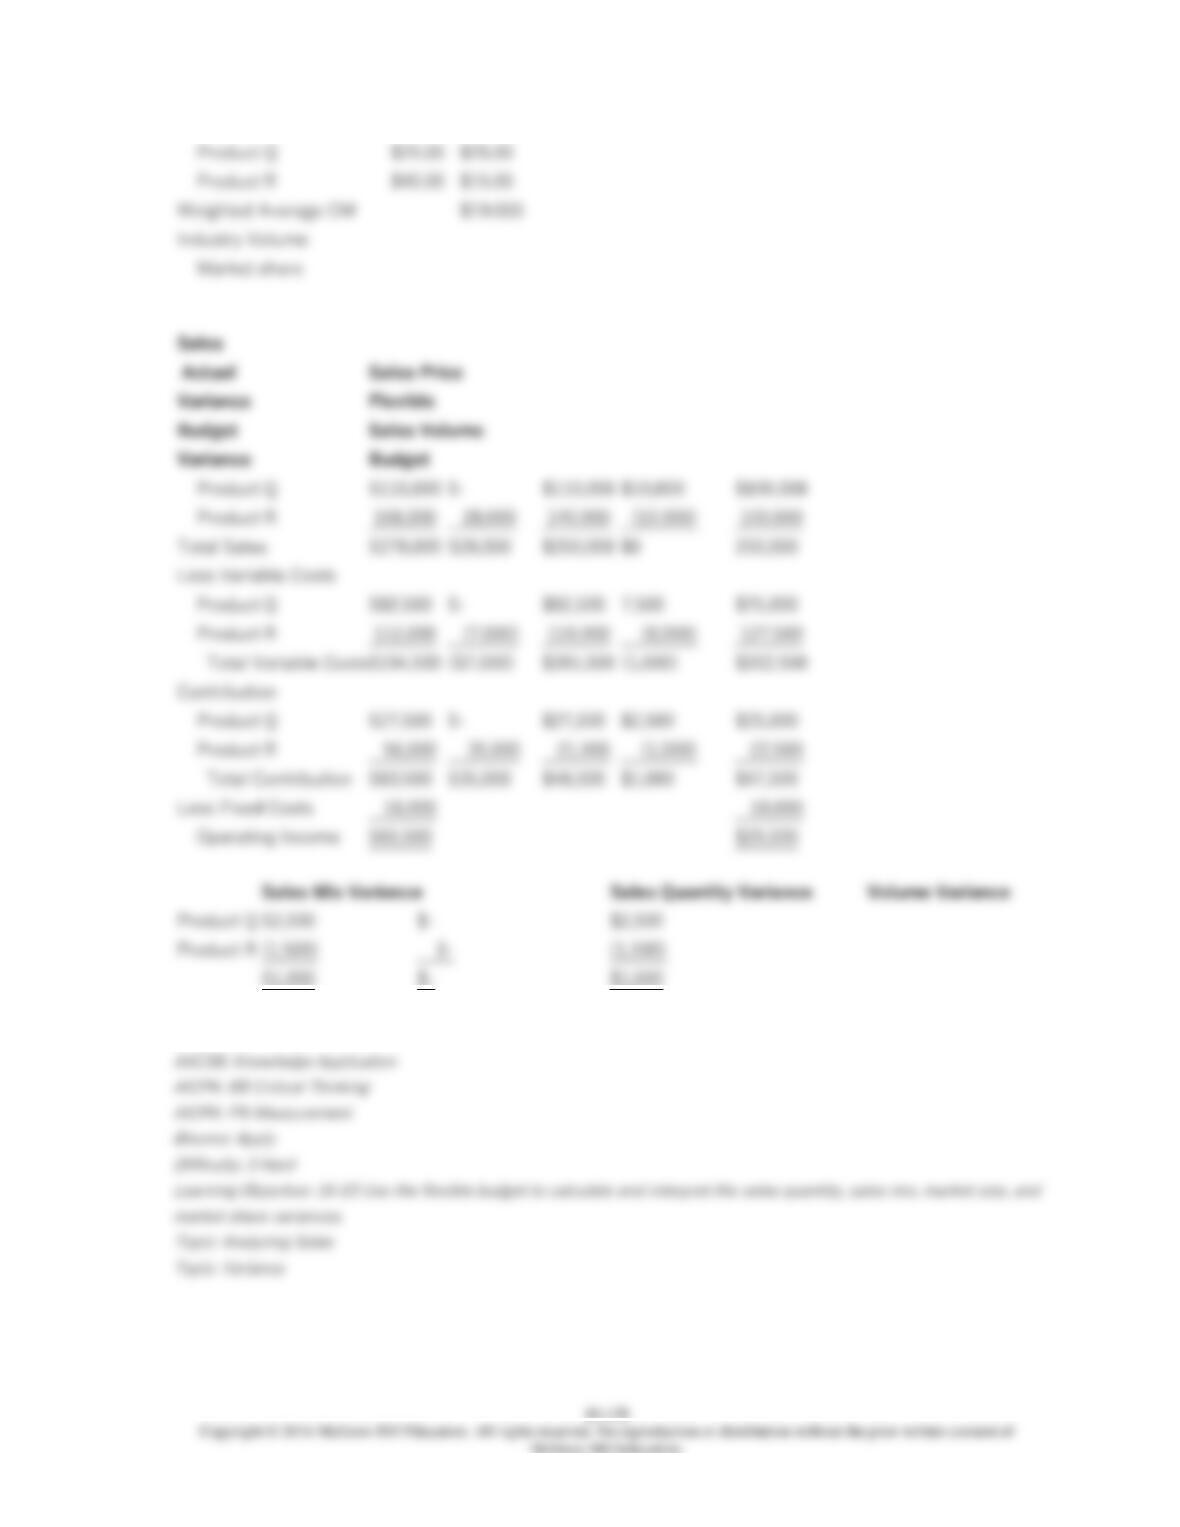
(A) Calculate the contribution margin sales volume variance for Product Q.
(B) Calculate the contribution margin sales volume variance for Product R.
(C) Calculate the sales mix variance for Product Q.
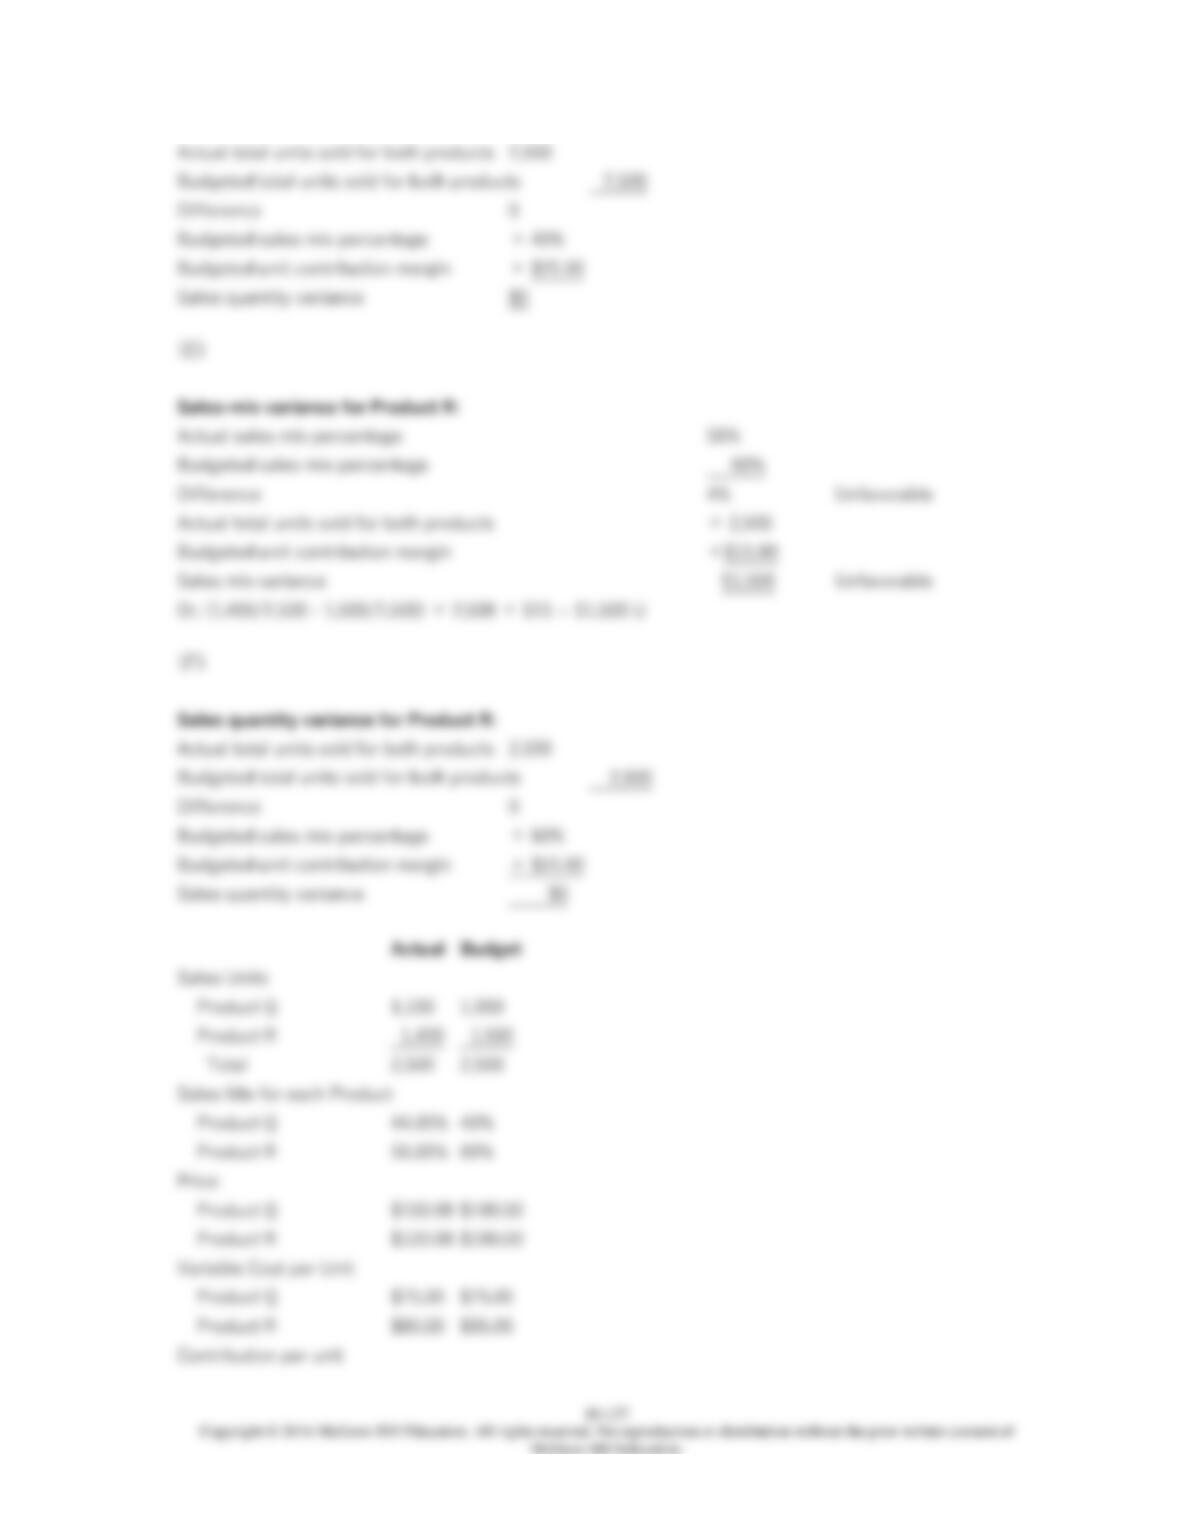
(D) Calculate the sales quantity variance for Product Q.
(E) Calculate the sales mix variance for Product R.
(F) Calculate the sales quantity variance for Product R.
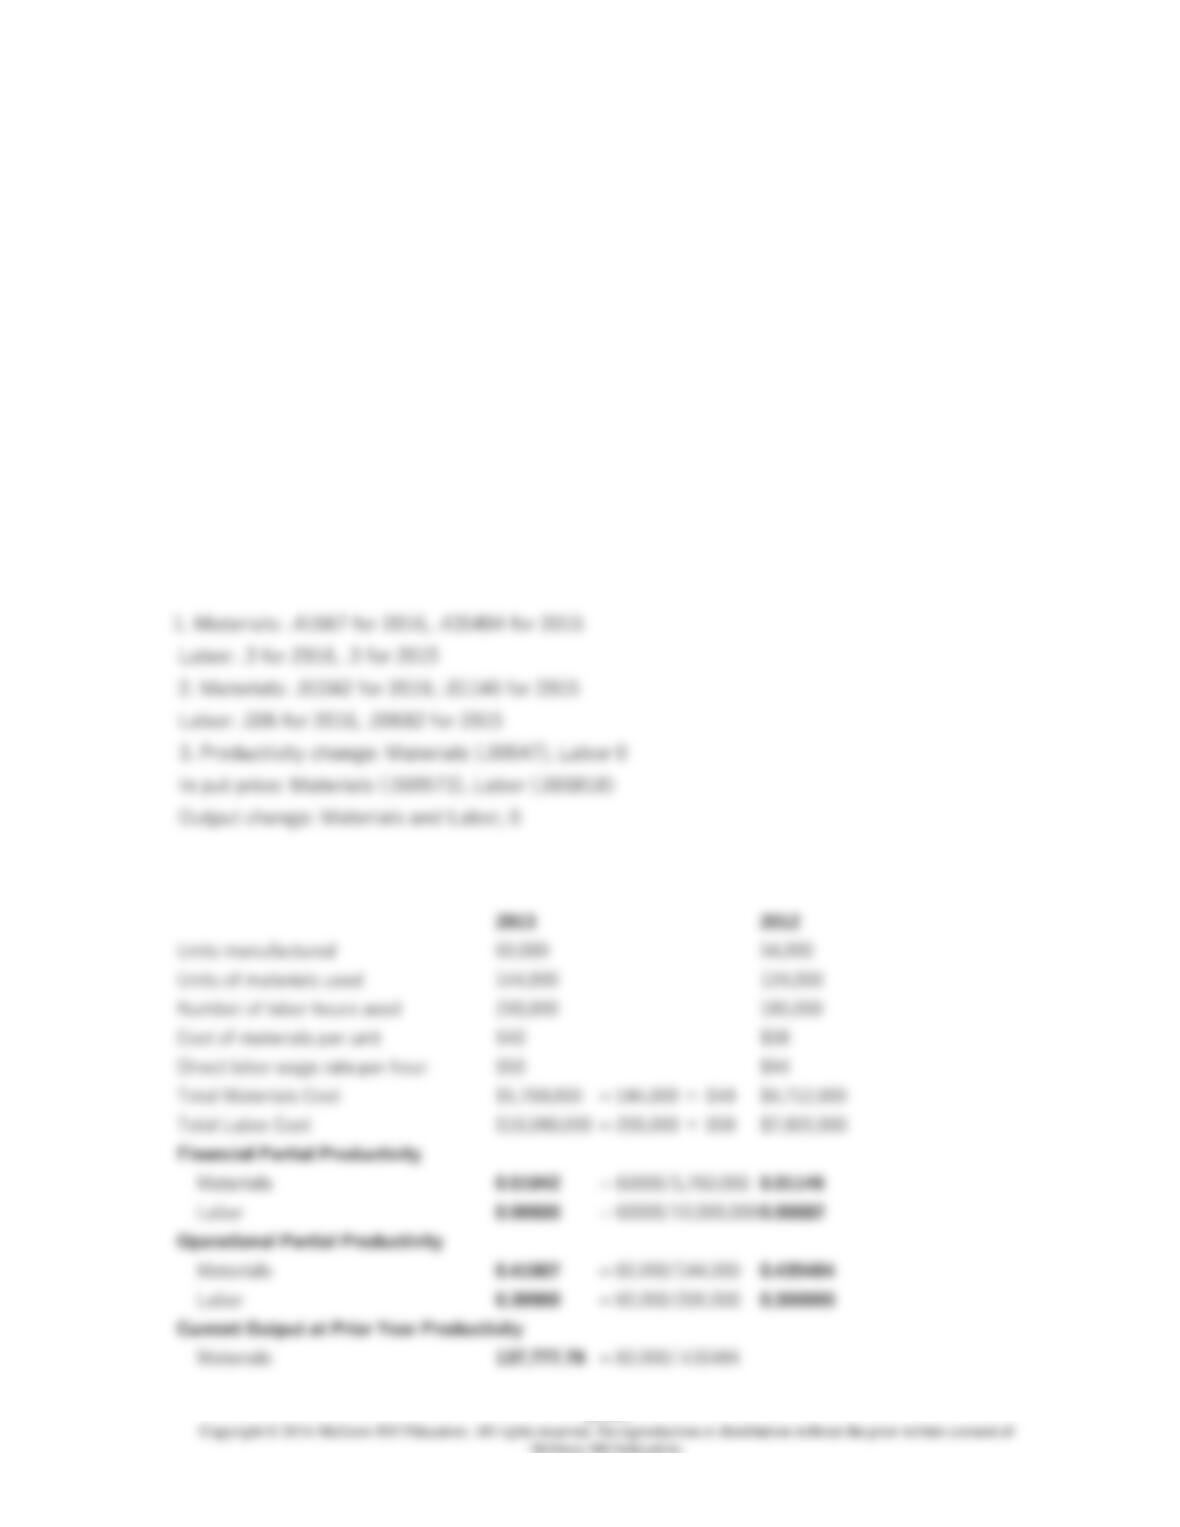
128. The following information is for the Wetherby Company.
2016 2015
Units manufactured 60,000 54,000
Units of materials used 144,000 124,000
Number of labor hours used 200,000 180,000
Cost of materials per unit $40 $38
Direct labor wage rate per hour $50 $44
1. Compute the partial operational productivity measures for 2015 and 2016.
2. Compute the partial financial productivity ratios for 2015 and 2016.
3. Separate the changes of the partial financial productivity ratios from 2015 to 2016 into
productivity change, input price change, and output change.